| Param | Original file | Final file |
|---|---|---|
| Filename | modeM0/AS1G07_004T01_9000001532_10560cztM0_level2.evt | modeM0/AS1G07_004T01_9000001532_10560cztM0_level2_quad_clean.evt |
| Size (bytes) | 1,427,469,120 | 213,652,800 |
| Size | 1.3 GB | 203.8 MB |
| Events in quadrant A | 8,456,442 | 1,307,089 |
| Events in quadrant B | 11,710,802 | 1,304,636 |
| Events in quadrant C | 8,165,504 | 1,340,843 |
| Events in quadrant D | 13,659,749 | 1,254,311 |
| Mode M0 | |||
|---|---|---|---|
| Quadrant | BADHDUFLAG | Total packets | Discarded packets |
| A | 0 | 37595 | 5 |
| B | 0 | 46933 | 4 |
| C | 0 | 37318 | 4 |
| D | 0 | 52255 | 4 |
| Mode SS | |||
|---|---|---|---|
| Quadrant | BADHDUFLAG | Total packets | Discarded packets |
| A | 0 | 374 | 0 |
| B | 0 | 374 | 0 |
| C | 0 | 374 | 0 |
| D | 0 | 374 | 0 |
| Mode M9 | |||
|---|---|---|---|
| Quadrant | BADHDUFLAG | Total packets | Discarded packets |
| A | 0 | 24 | 0 |
| B | 0 | 24 | 0 |
| C | 0 | 24 | 0 |
| D | 0 | 24 | 0 |
| Quadrant | Total seconds | Saturated seconds | Saturation percentage |
|---|---|---|---|
| A | 18337 | 248 | 1.352457% |
| B | 18337 | 1104 | 6.020614% |
| C | 18337 | 195 | 1.063424% |
| D | 18337 | 1436 | 7.831161% |
Noise dominated data is calculated using 1-second bins in cleaned event files. If a bin has >2000 counts, and if more than 50% of those come from <1% of pixels, then it is considered to be noise-dominated and hence unusable.
| Quadrant | # 1 sec bins | Bins with >0 counts | Bins with >2000 counts | High rate bins dominated by noise | Noise dominated (total time) | Noise dominated (detector-on time) | Marked lightcurve |
|---|---|---|---|---|---|---|---|
| A | 20657 | 18341 | 1 | 1 | 0.00% | 0.01% | 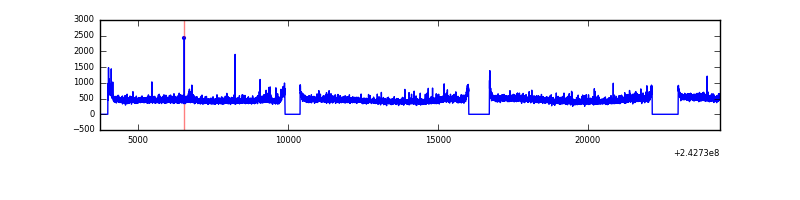 |
| B | 20657 | 18341 | 541 | 541 | 2.62% | 2.95% | 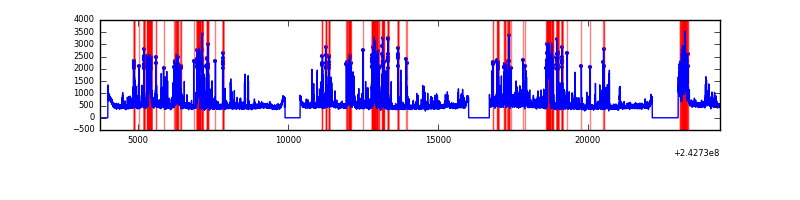 |
| C | 20657 | 18341 | 1 | 1 | 0.00% | 0.01% | 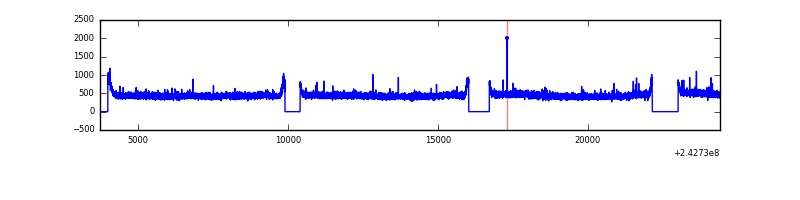 |
| D | 20657 | 18341 | 1173 | 1173 | 5.68% | 6.40% | 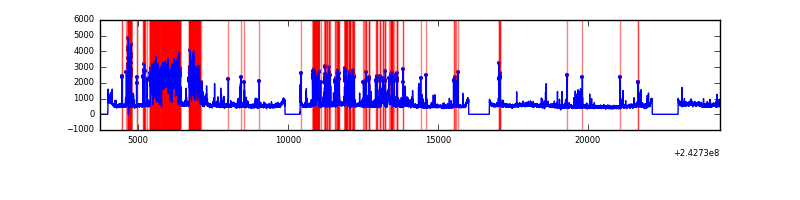 |
Top three noisy pixels from each quadrant. If the there are fewer than three noisy pixels in the level2.evt file, extra rows are filled as -1
| Pixel properties | Quadrant properties | ||||||
|---|---|---|---|---|---|---|---|
| Quadrant | DetID | PixID | Counts | Sigma | Mean | Median | Sigma |
| A | 1 | 162 | 95328 | 214.39 | 2135 | 2089 | 434.9 |
| A | 13 | 251 | 54993 | 121.65 | 2135 | 2089 | 434.9 |
| A | 14 | 254 | 32270 | 69.4 | 2135 | 2089 | 434.9 |
| B | 4 | 239 | 3043983 | 7592.76 | 2107 | 2053 | 400.6 |
| B | 11 | 51 | 164798 | 406.22 | 2107 | 2053 | 400.6 |
| B | 0 | 214 | 113627 | 278.49 | 2107 | 2053 | 400.6 |
| C | 14 | 234 | 18292 | 33.54 | 2086 | 2094 | 482.9 |
| C | 13 | 61 | 15530 | 27.82 | 2086 | 2094 | 482.9 |
| C | 4 | 175 | 12332 | 21.2 | 2086 | 2094 | 482.9 |
| D | 1 | 52 | 3672428 | 7589.01 | 2016 | 1960 | 483.7 |
| D | 8 | 195 | 1130914 | 2334.21 | 2016 | 1960 | 483.7 |
| D | 2 | 16 | 740960 | 1527.95 | 2016 | 1960 | 483.7 |
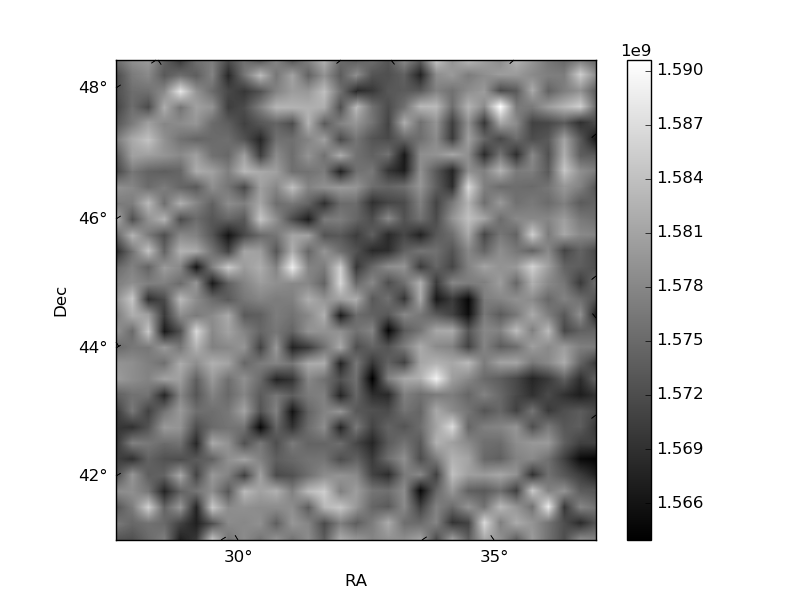
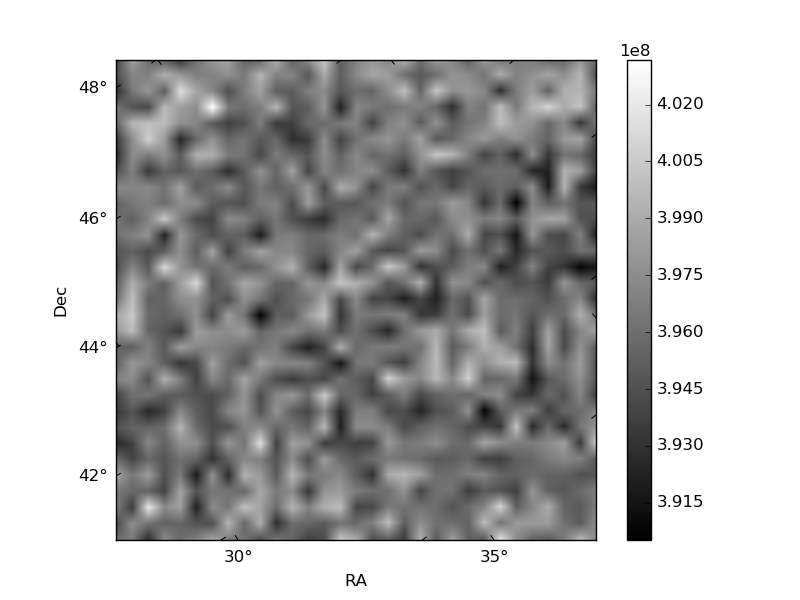
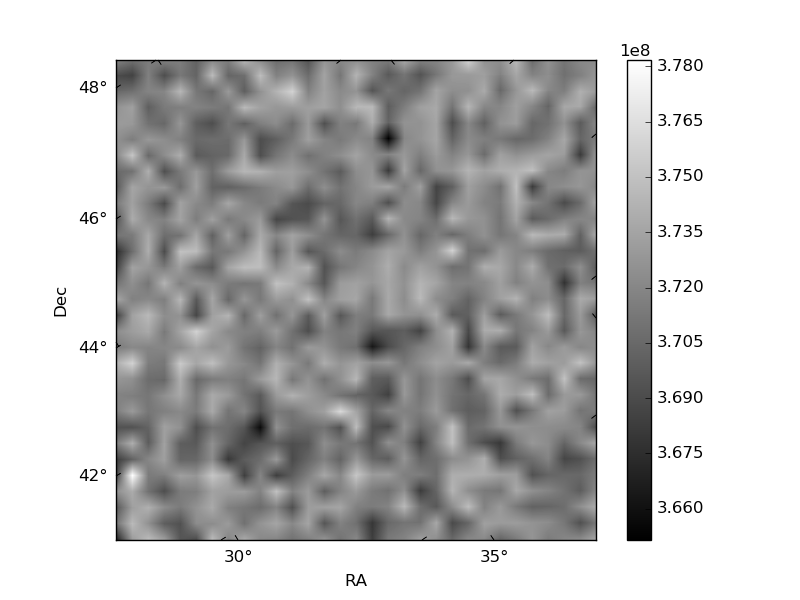
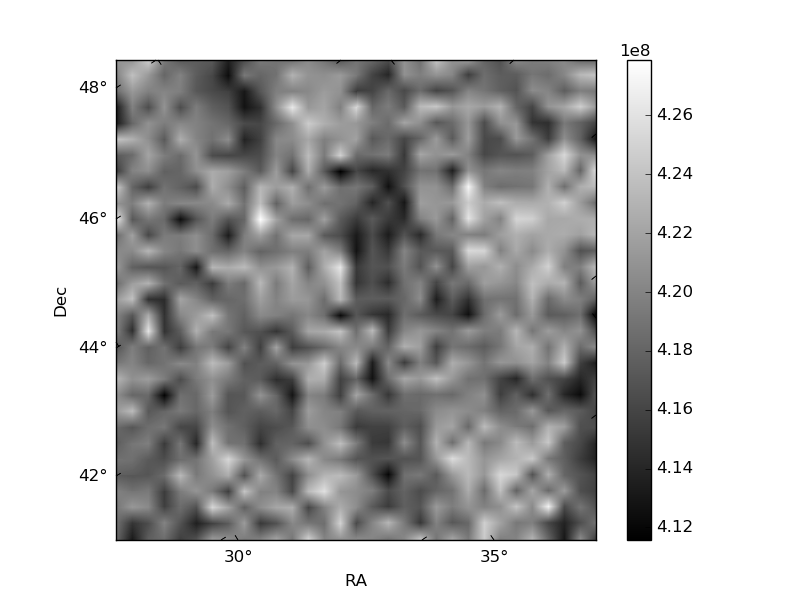
Histogram calculated using DETX and DETY for each event in the final _common_clean file
| Quadrant A | 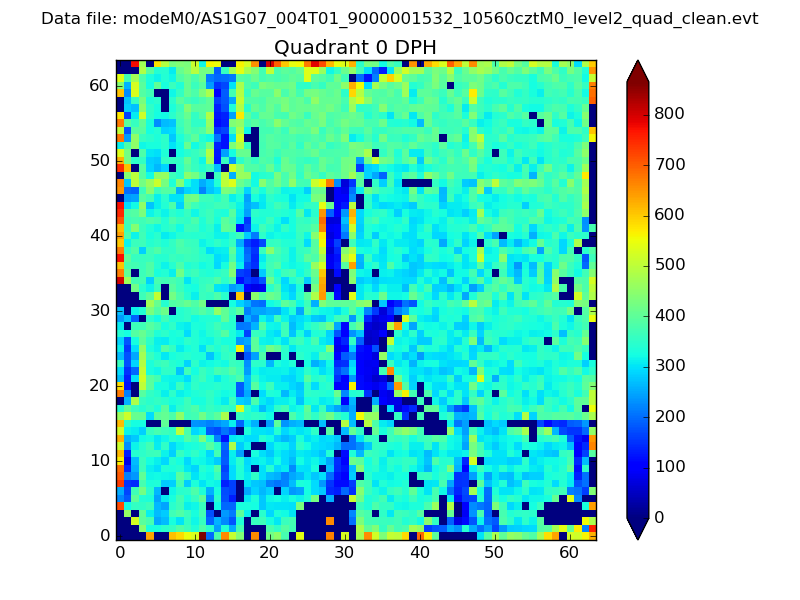 |
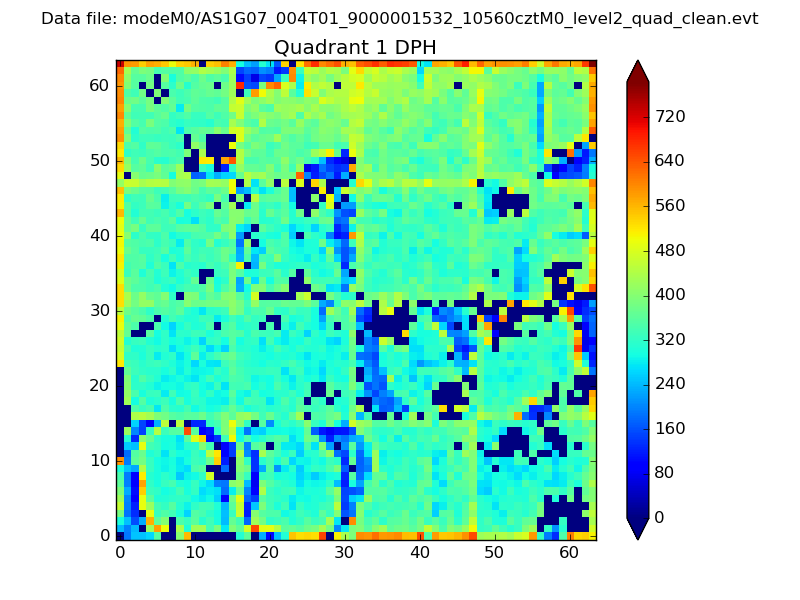 |
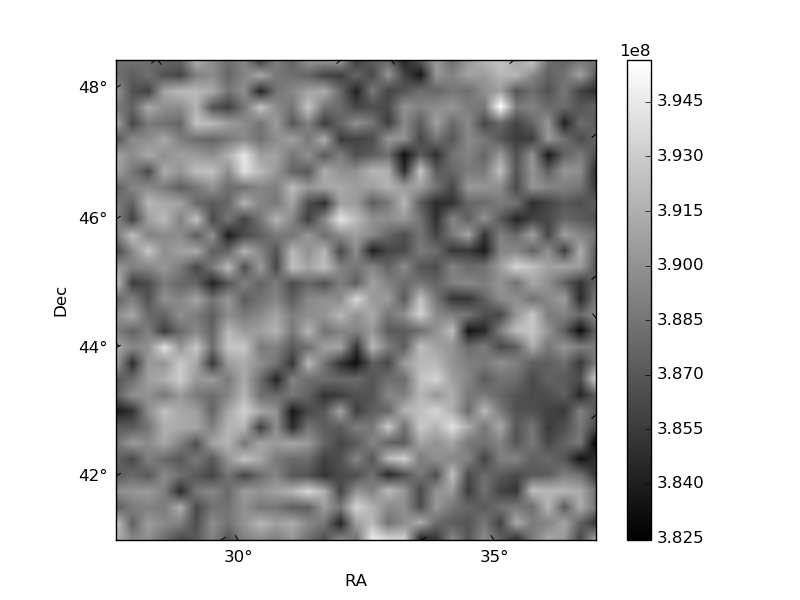
Quadrant B |
|---|---|---|---|
| Quadrant D | 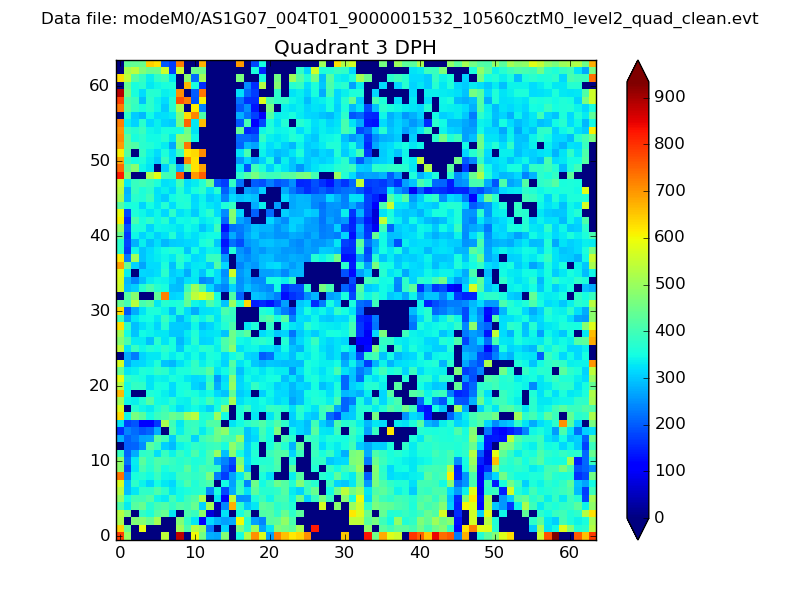 |
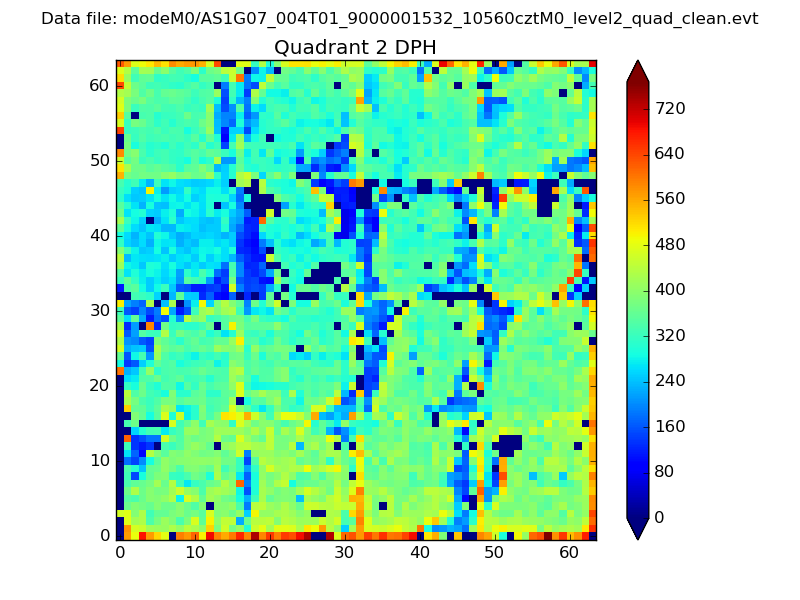 |
Quadrant C |
| Plot type | Count rate plots | Images |
|---|---|---|
| Comparison with Poisson distribution Blue bars denote a histogram of data divided into 1 sec bins. Red curve is a Poisson curve with rate = median count rate of data. |
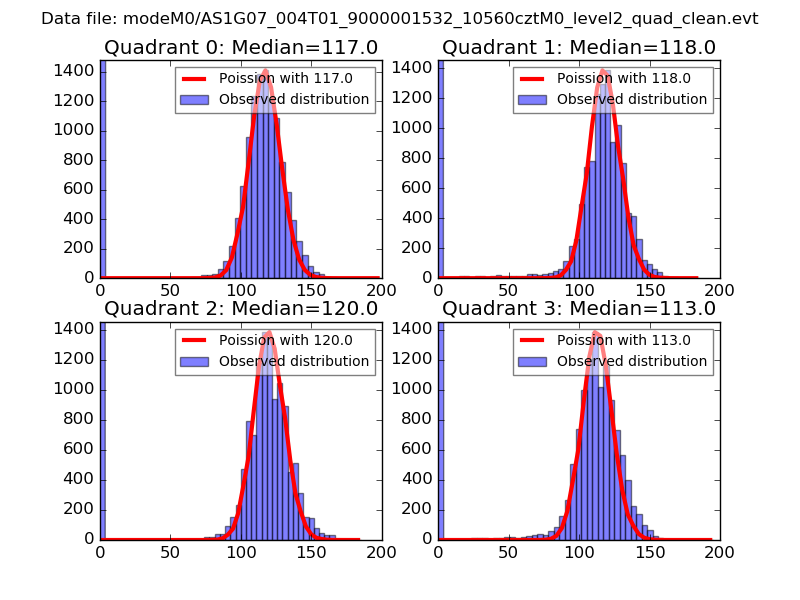 |
 |
| Quadrant-wise count rates Data is divided into 100 sec bins |
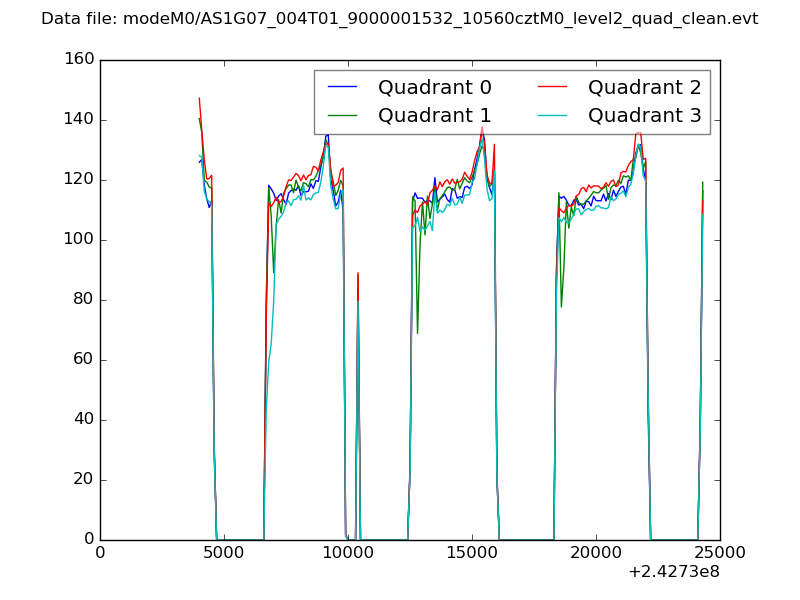 |
|
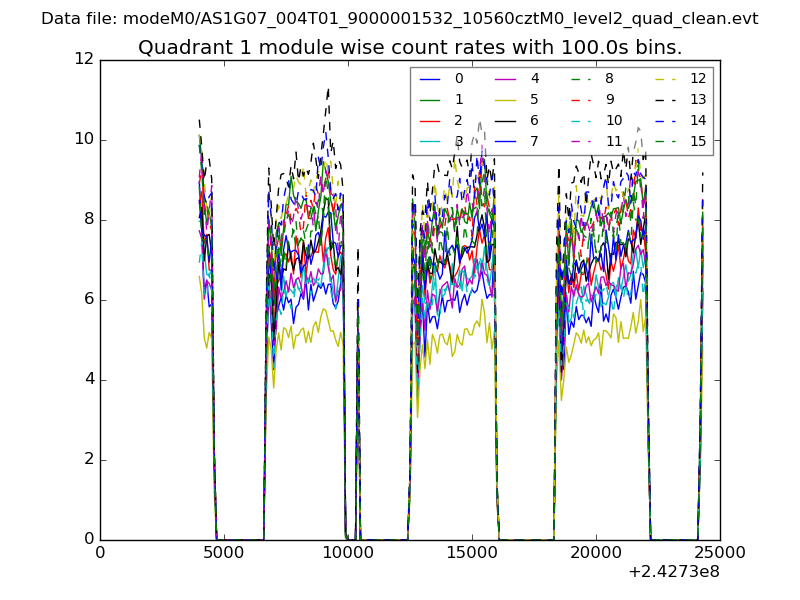
| Module-wise count rates for Quadrant A Data is divided into 100 sec bins |
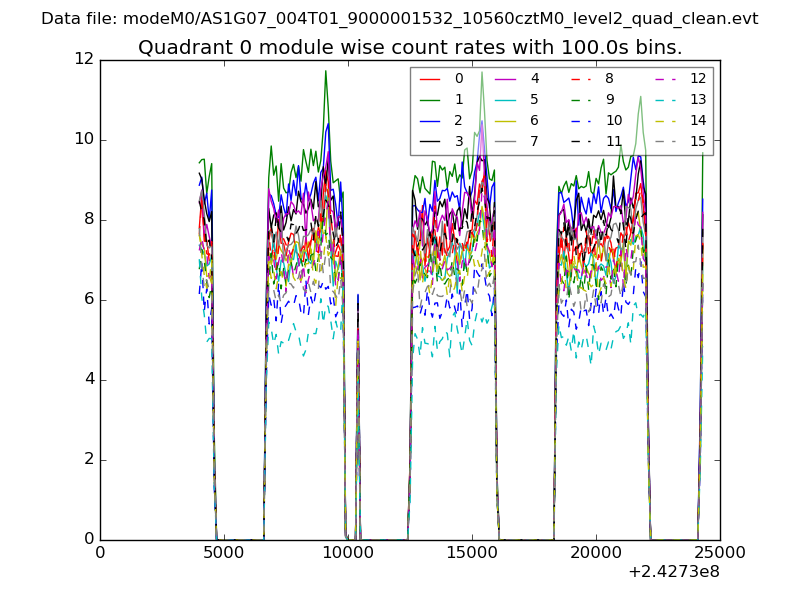 |
 |
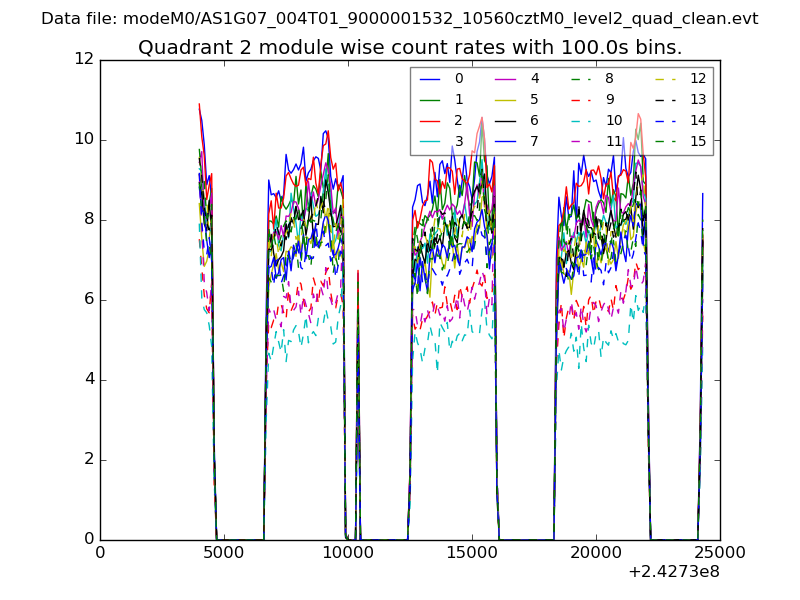
| Module-wise count rates for Quadrant B Data is divided into 100 sec bins |
 |
 |
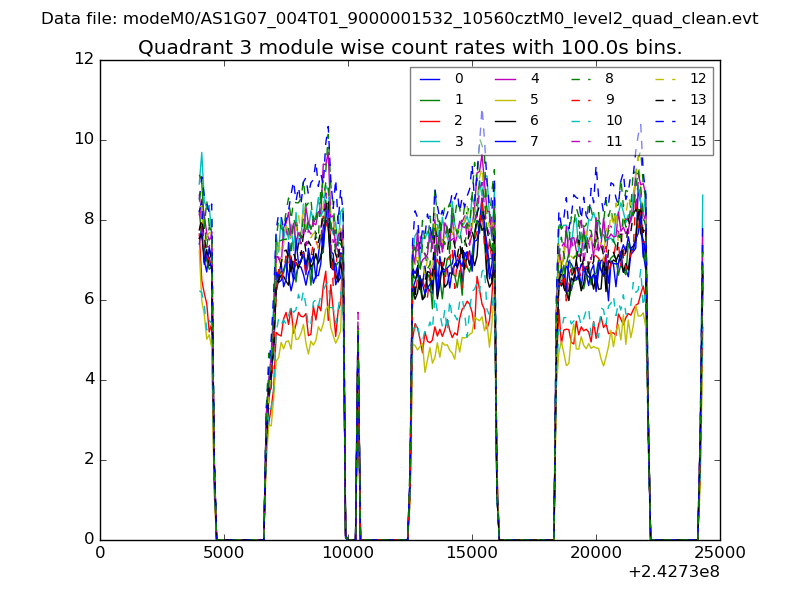
| Module-wise count rates for Quadrant C Data is divided into 100 sec bins |
 |
 |
| Module-wise count rates for Quadrant D Data is divided into 100 sec bins |
 |
 |
| Parameter | Plot |
|---|---|
| CZT HV Monitor | 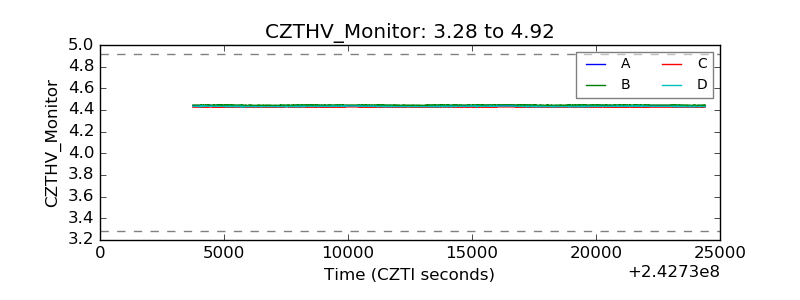 |
| D_VDD | 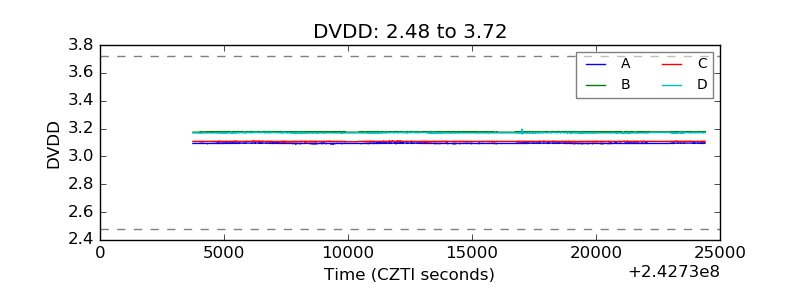 |
| Temperature 1 | 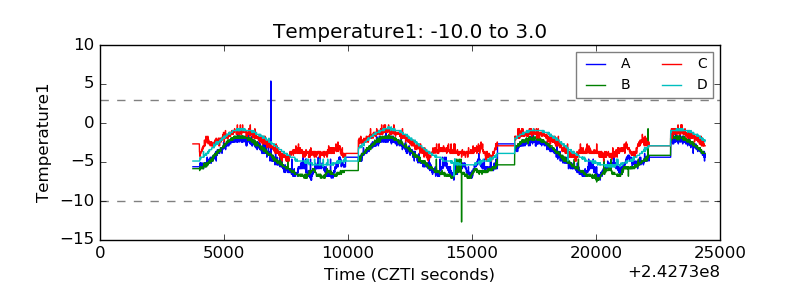 |
| Veto HV Monitor | 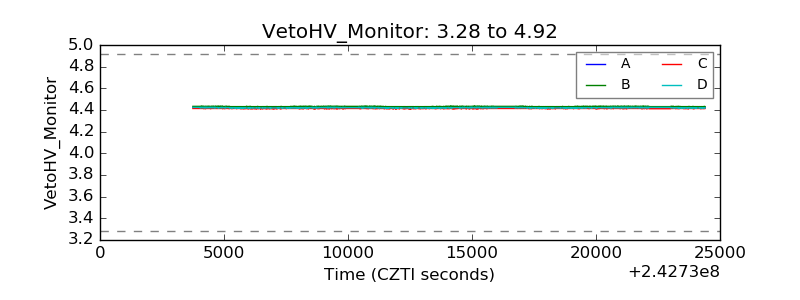 |
| Veto LLD | 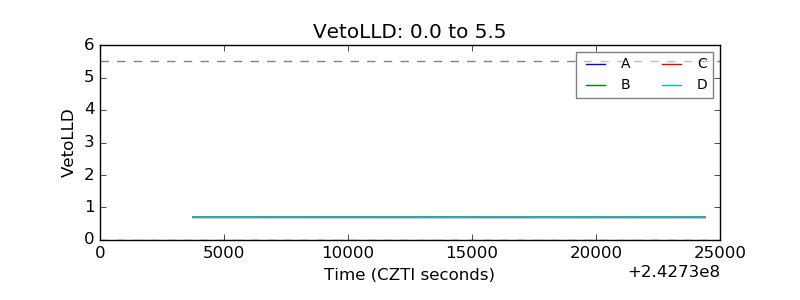 |
| Alpha Counter | 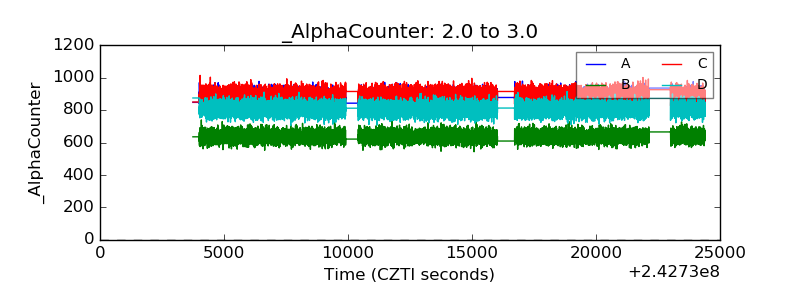 |
| _CPM_Rate | 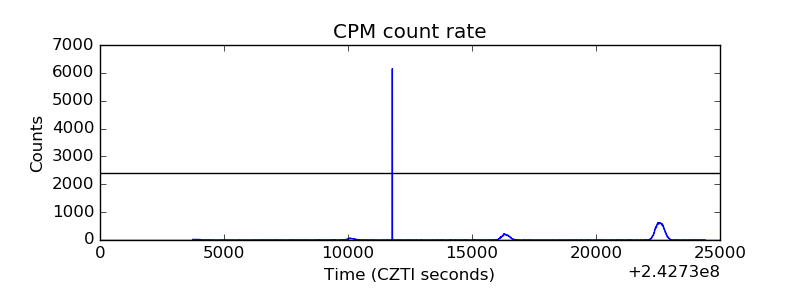 |
| CZT Counter | 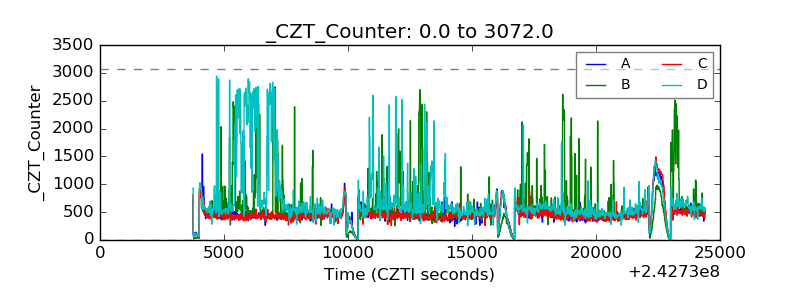 |
| +2.5 Volts monitor |  |
| +5 Volts monitor |  |
| _ROLL_ROT | 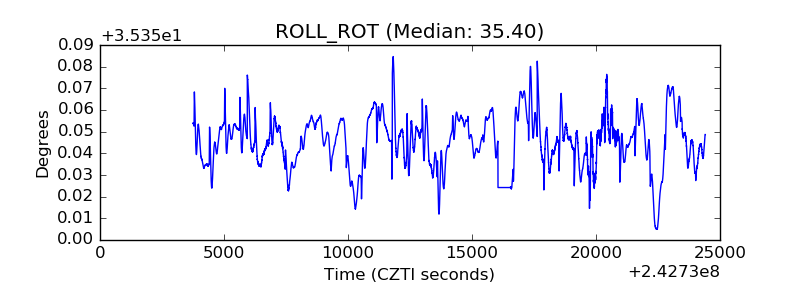 |
| _Roll_DEC | 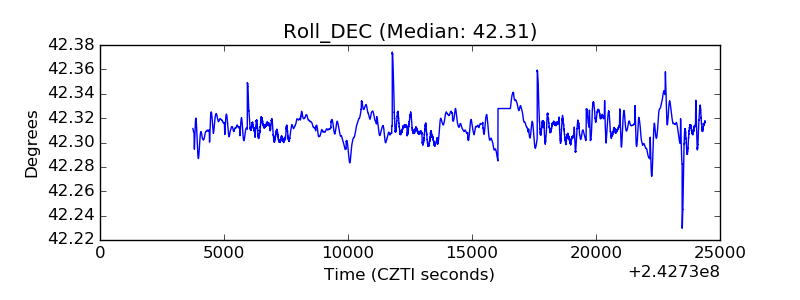 |
| _Roll_RA | 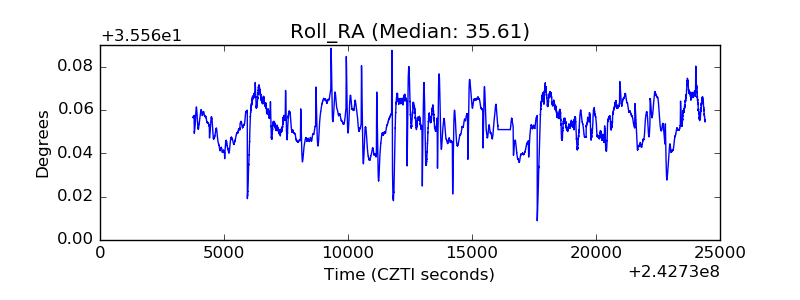 |
| Veto Counter | 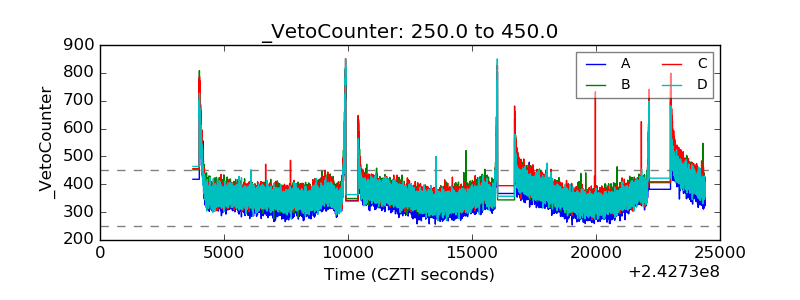 |