| Param | Original file | Final file |
|---|---|---|
| Filename | modeM0/AS1G07_004T01_9000001532_10561cztM0_level2.evt | modeM0/AS1G07_004T01_9000001532_10561cztM0_level2_quad_clean.evt |
| Size (bytes) | 553,458,240 | 90,731,520 |
| Size | 527.8 MB | 86.5 MB |
| Events in quadrant A | 3,511,110 | 567,021 |
| Events in quadrant B | 5,150,264 | 557,978 |
| Events in quadrant C | 3,311,975 | 580,448 |
| Events in quadrant D | 4,309,512 | 550,476 |
| Mode M0 | |||
|---|---|---|---|
| Quadrant | BADHDUFLAG | Total packets | Discarded packets |
| A | 0 | 15104 | 3 |
| B | 0 | 20156 | 2 |
| C | 0 | 14620 | 2 |
| D | 0 | 17497 | 2 |
| Mode SS | |||
|---|---|---|---|
| Quadrant | BADHDUFLAG | Total packets | Discarded packets |
| A | 0 | 142 | 0 |
| B | 0 | 142 | 0 |
| C | 0 | 142 | 0 |
| D | 0 | 142 | 0 |
| Mode M9 | |||
|---|---|---|---|
| Quadrant | BADHDUFLAG | Total packets | Discarded packets |
| A | 0 | 20 | 0 |
| B | 0 | 20 | 0 |
| C | 0 | 20 | 0 |
| D | 0 | 20 | 0 |
| Quadrant | Total seconds | Saturated seconds | Saturation percentage |
|---|---|---|---|
| A | 7069 | 81 | 1.145848% |
| B | 7069 | 660 | 9.336540% |
| C | 7069 | 72 | 1.018532% |
| D | 7069 | 87 | 1.230726% |
Noise dominated data is calculated using 1-second bins in cleaned event files. If a bin has >2000 counts, and if more than 50% of those come from <1% of pixels, then it is considered to be noise-dominated and hence unusable.
| Quadrant | # 1 sec bins | Bins with >0 counts | Bins with >2000 counts | High rate bins dominated by noise | Noise dominated (total time) | Noise dominated (detector-on time) | Marked lightcurve |
|---|---|---|---|---|---|---|---|
| A | 8969 | 7071 | 0 | 0 | 0.00% | 0.00% | 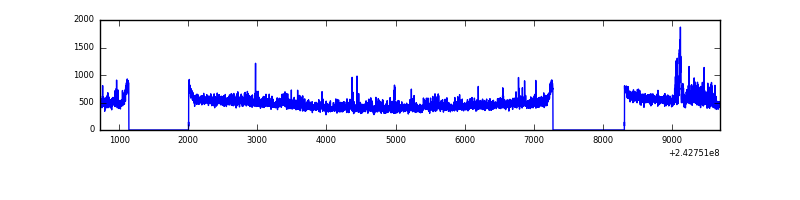 |
| B | 8969 | 7071 | 367 | 367 | 4.09% | 5.19% | 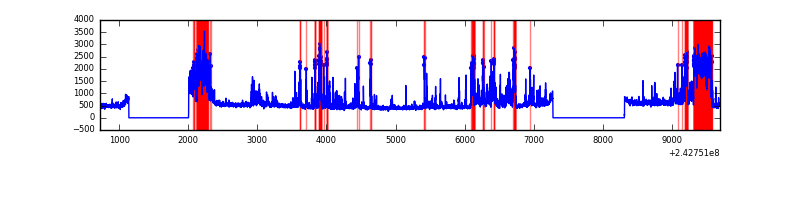 |
| C | 8969 | 7071 | 7 | 7 | 0.08% | 0.10% | 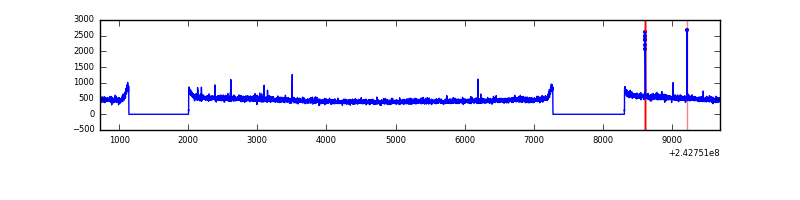 |
| D | 8969 | 7071 | 11 | 11 | 0.12% | 0.16% | 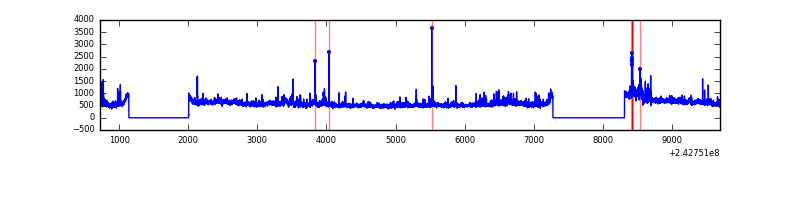 |
Top three noisy pixels from each quadrant. If the there are fewer than three noisy pixels in the level2.evt file, extra rows are filled as -1
| Pixel properties | Quadrant properties | ||||||
|---|---|---|---|---|---|---|---|
| Quadrant | DetID | PixID | Counts | Sigma | Mean | Median | Sigma |
| A | 13 | 251 | 108450 | 616.55 | 857 | 838 | 174.5 |
| A | 1 | 162 | 52628 | 296.72 | 857 | 838 | 174.5 |
| A | 1 | 178 | 16803 | 91.47 | 857 | 838 | 174.5 |
| B | 4 | 239 | 1699975 | 10638.38 | 839 | 819 | 159.7 |
| B | 11 | 51 | 62989 | 389.25 | 839 | 819 | 159.7 |
| B | 0 | 219 | 62500 | 386.18 | 839 | 819 | 159.7 |
| C | 14 | 234 | 24618 | 121.51 | 842 | 847 | 195.6 |
| C | 13 | 61 | 6295 | 27.85 | 842 | 847 | 195.6 |
| C | 14 | 67 | 3200 | 12.03 | 842 | 847 | 195.6 |
| D | 8 | 195 | 512068 | 2565.08 | 834 | 811 | 199.3 |
| D | 2 | 16 | 244766 | 1223.97 | 834 | 811 | 199.3 |
| D | 1 | 52 | 201034 | 1004.56 | 834 | 811 | 199.3 |
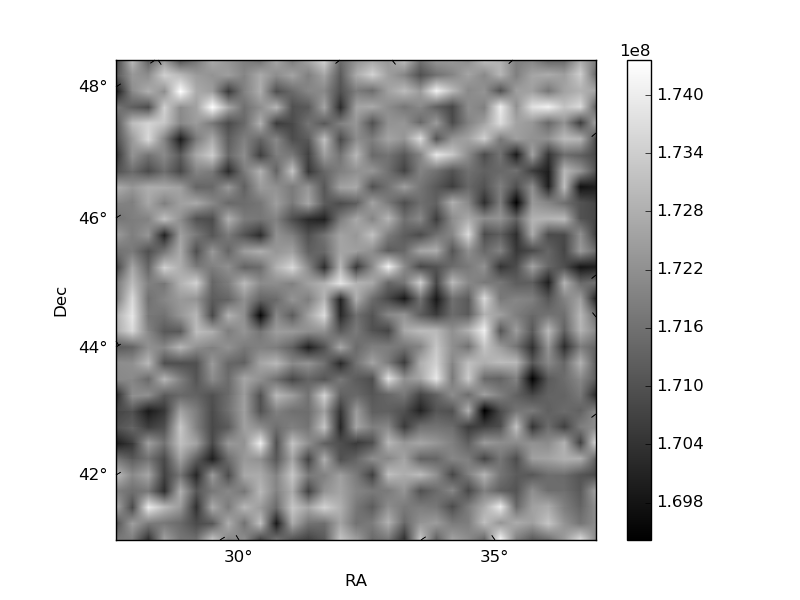
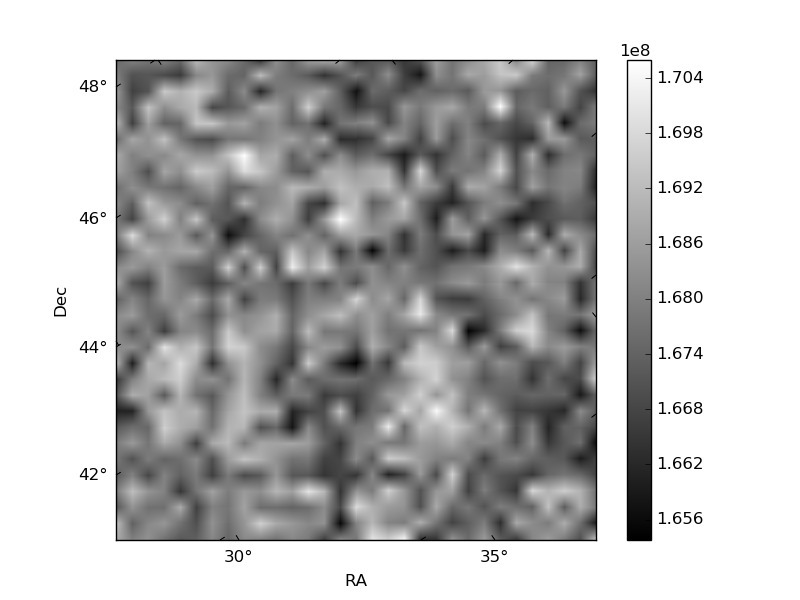
Histogram calculated using DETX and DETY for each event in the final _common_clean file
| Quadrant A |  |
 |
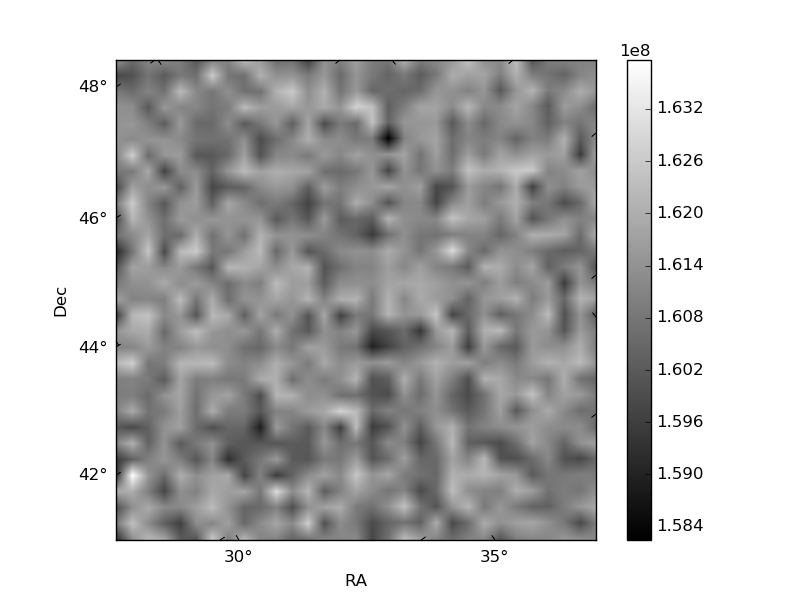
Quadrant B |
|---|---|---|---|
| Quadrant D |  |
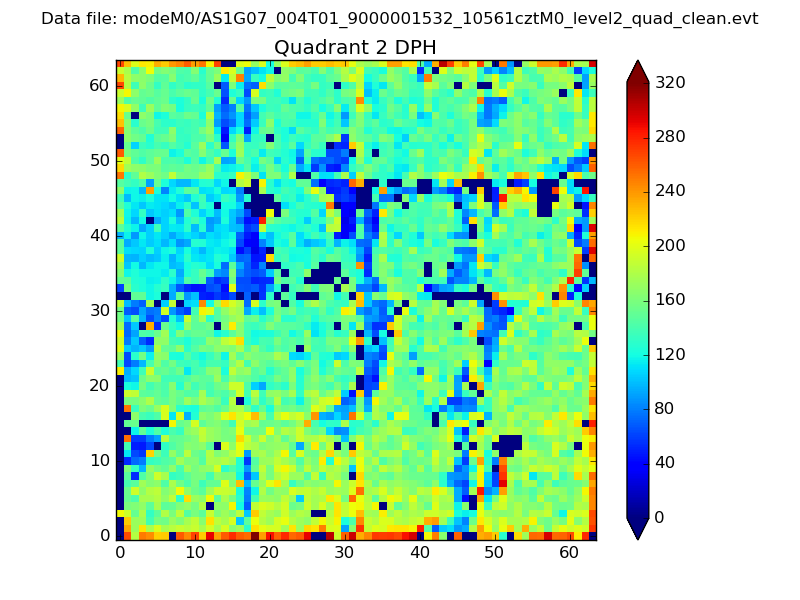 |
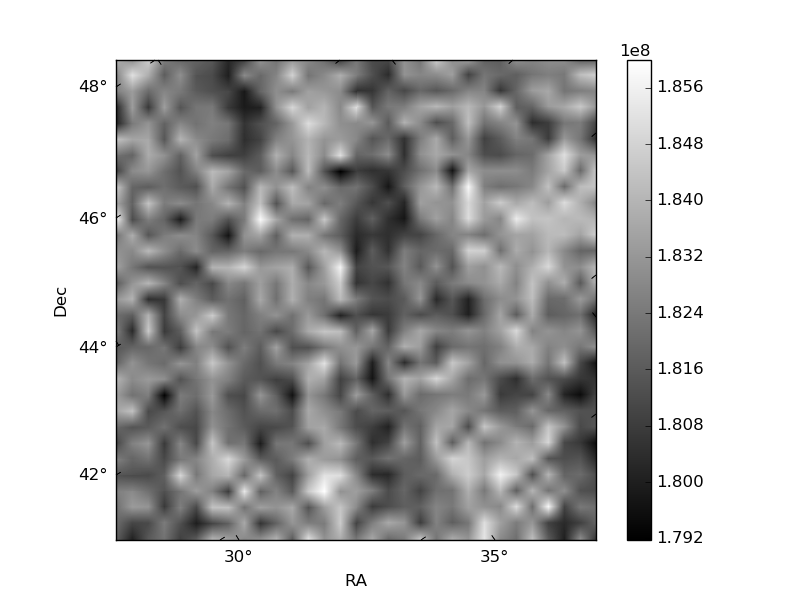
Quadrant C |
| Plot type | Count rate plots | Images |
|---|---|---|
| Comparison with Poisson distribution Blue bars denote a histogram of data divided into 1 sec bins. Red curve is a Poisson curve with rate = median count rate of data. |
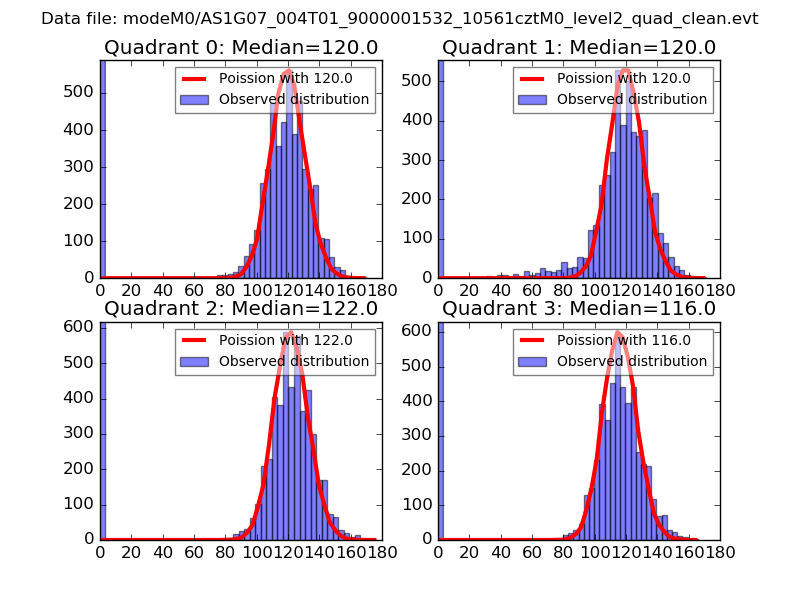 |
 |
| Quadrant-wise count rates Data is divided into 100 sec bins |
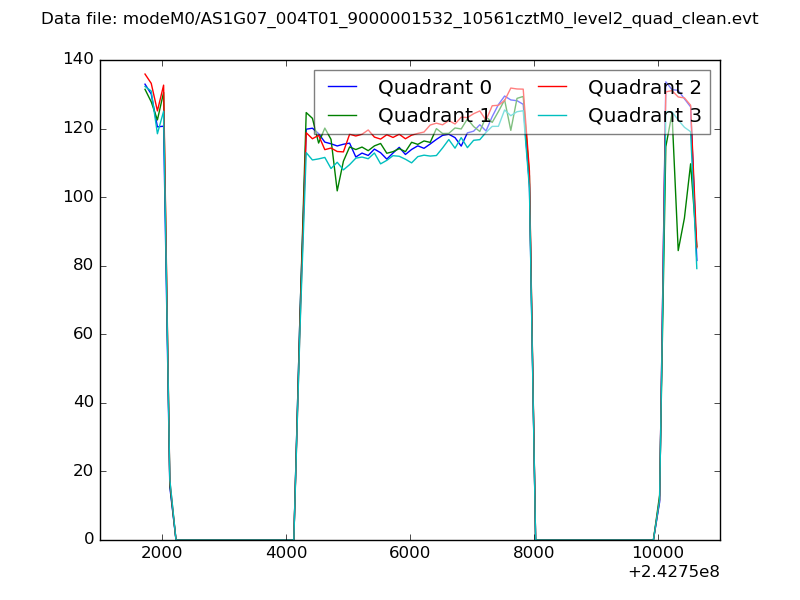 |
|
| Module-wise count rates for Quadrant A Data is divided into 100 sec bins |
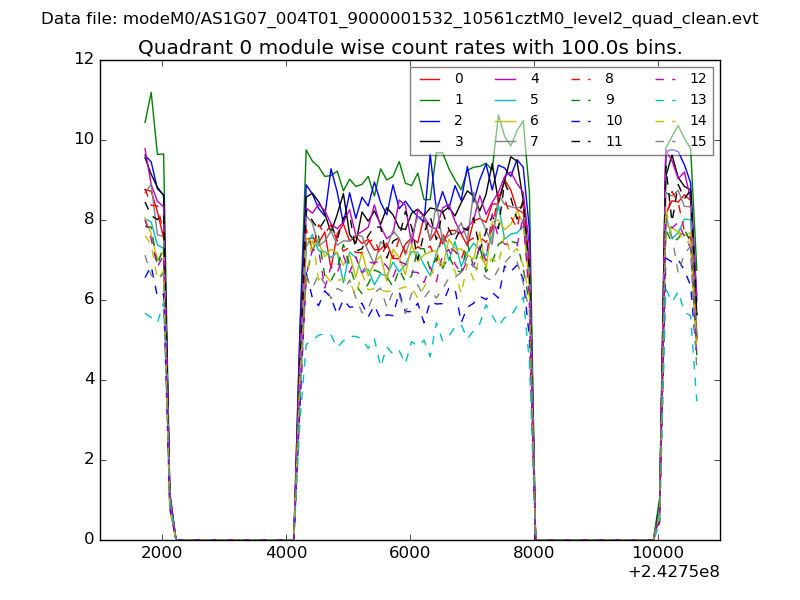 |
 |
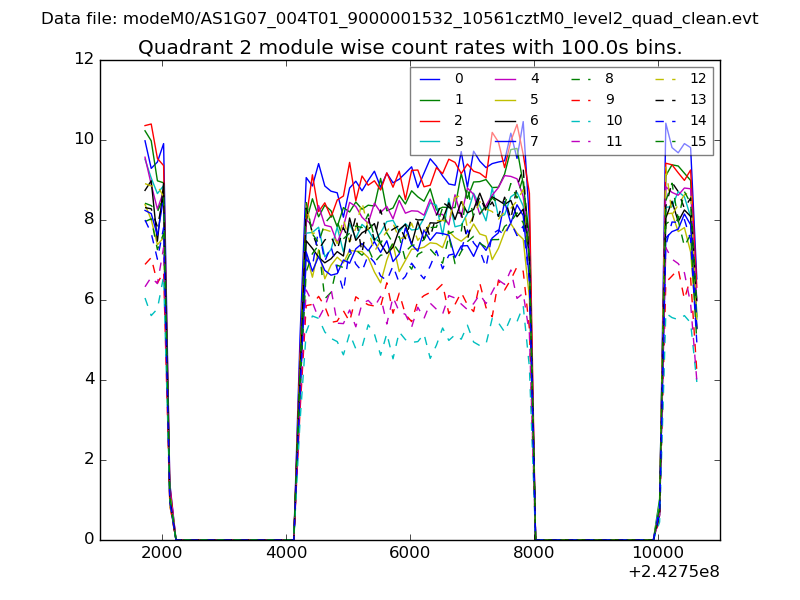
| Module-wise count rates for Quadrant B Data is divided into 100 sec bins |
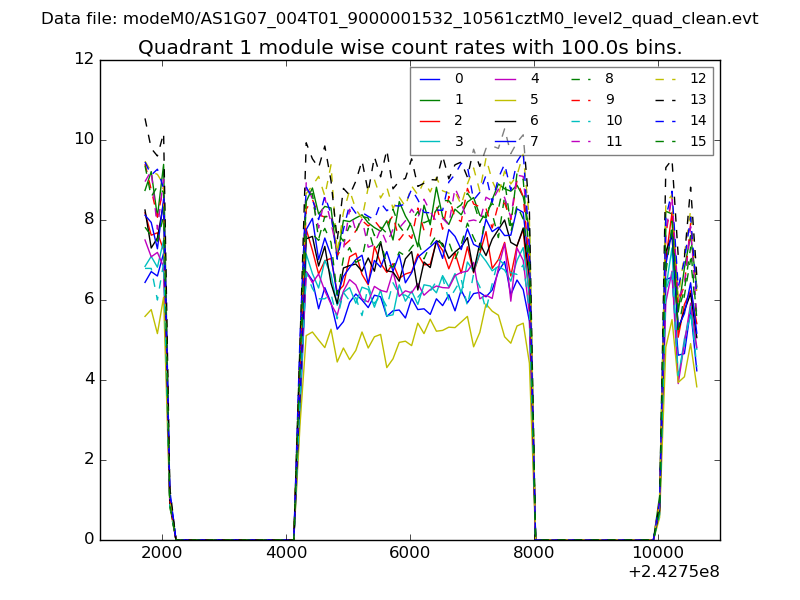 |
 |
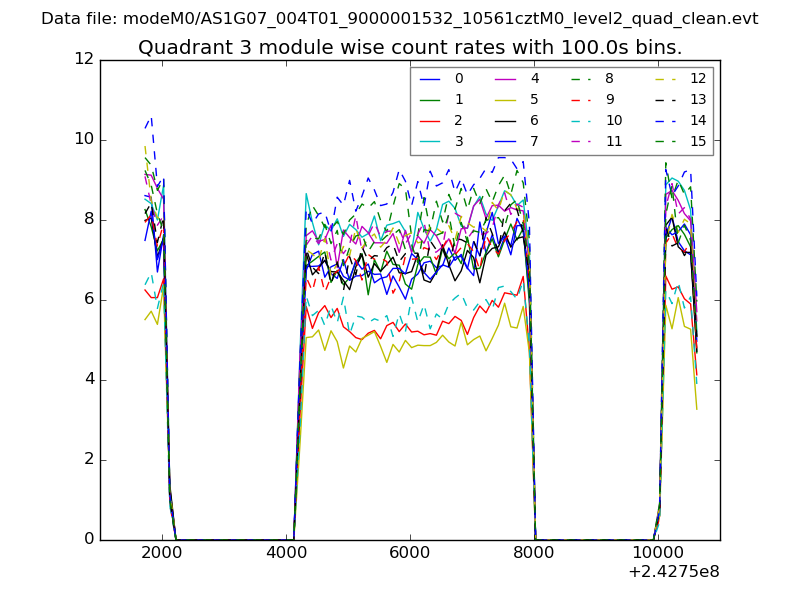
| Module-wise count rates for Quadrant C Data is divided into 100 sec bins |
 |
 |
| Module-wise count rates for Quadrant D Data is divided into 100 sec bins |
 |
 |
| Parameter | Plot |
|---|---|
| CZT HV Monitor | 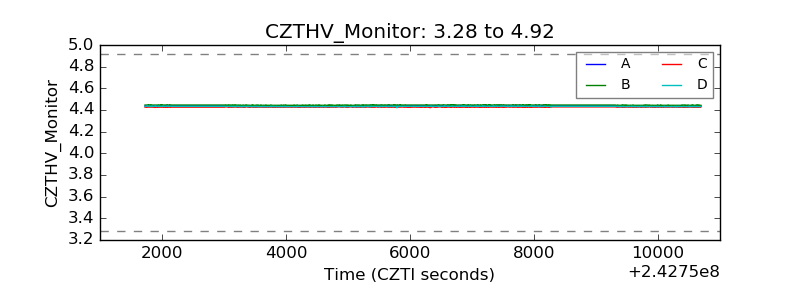 |
| D_VDD | 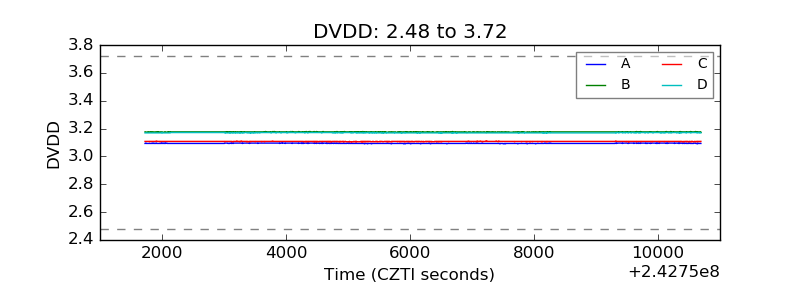 |
| Temperature 1 | 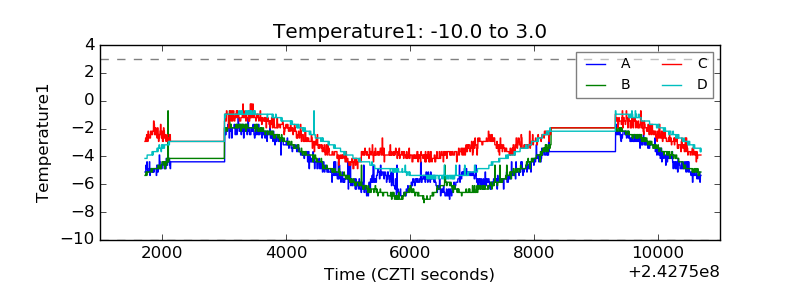 |
| Veto HV Monitor | 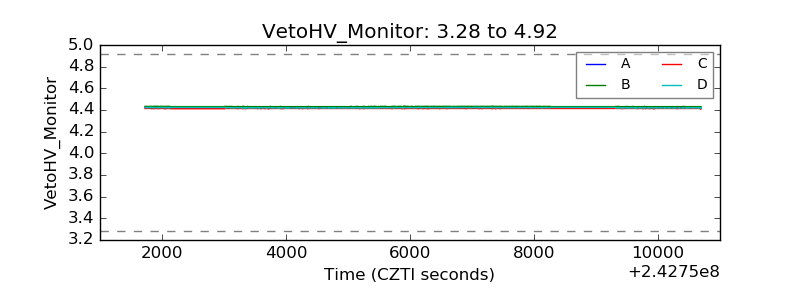 |
| Veto LLD |  |
| Alpha Counter | 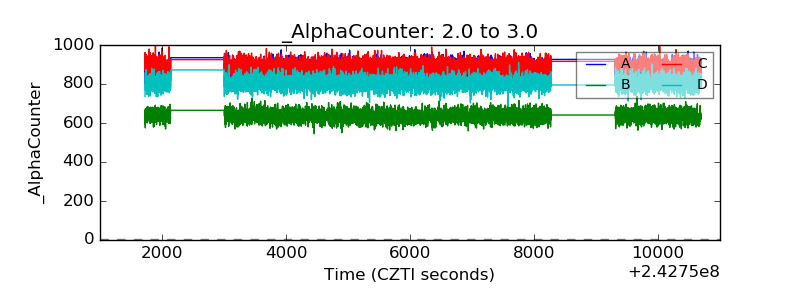 |
| _CPM_Rate | 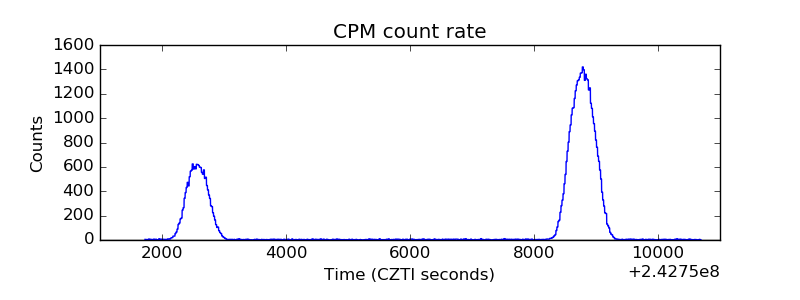 |
| CZT Counter | 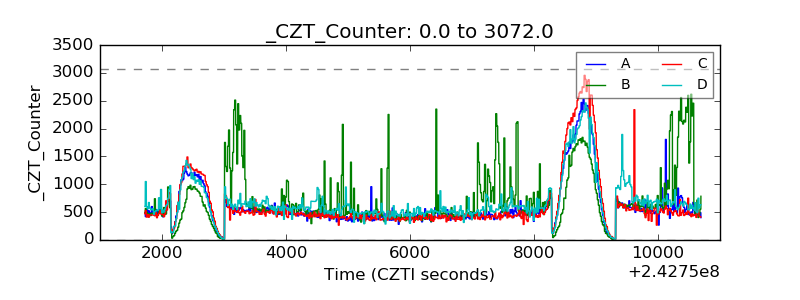 |
| +2.5 Volts monitor |  |
| +5 Volts monitor | 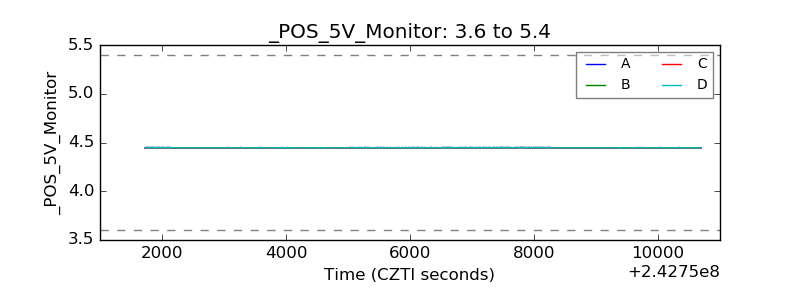 |
| _ROLL_ROT | 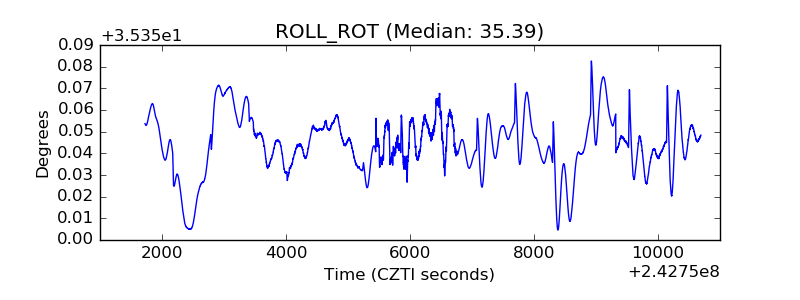 |
| _Roll_DEC | 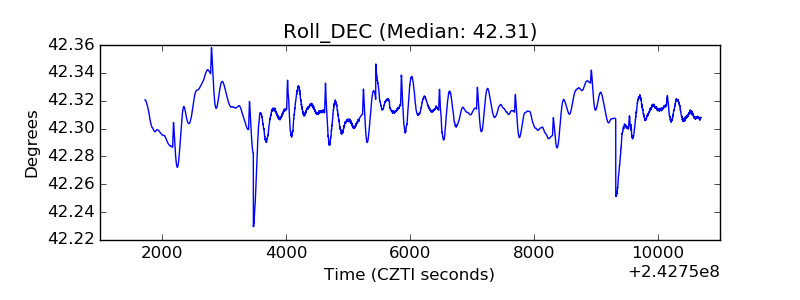 |
| _Roll_RA | 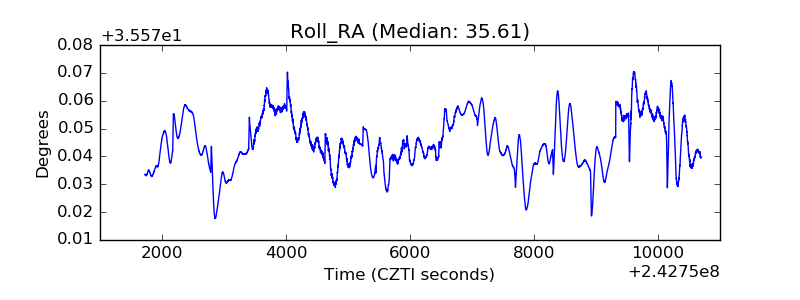 |
| Veto Counter | 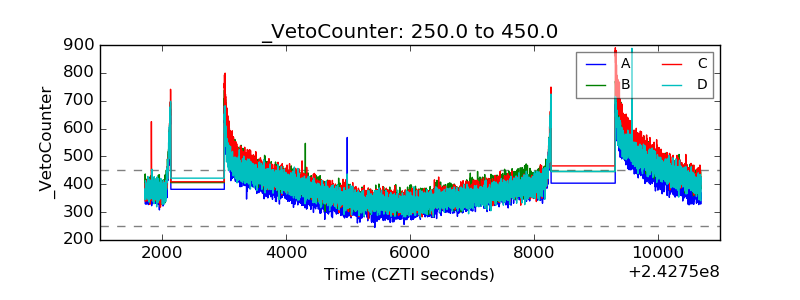 |