| Param | Original file | Final file |
|---|---|---|
| Filename | modeM0/AS1G07_004T01_9000001532_10564cztM0_level2.evt | modeM0/AS1G07_004T01_9000001532_10564cztM0_level2_quad_clean.evt |
| Size (bytes) | 475,490,880 | 101,494,080 |
| Size | 453.5 MB | 96.8 MB |
| Events in quadrant A | 2,998,610 | 651,844 |
| Events in quadrant B | 4,134,494 | 662,112 |
| Events in quadrant C | 2,998,643 | 685,032 |
| Events in quadrant D | 3,846,815 | 641,241 |
| Mode M0 | |||
|---|---|---|---|
| Quadrant | BADHDUFLAG | Total packets | Discarded packets |
| A | 0 | 13092 | 3 |
| B | 0 | 16513 | 2 |
| C | 0 | 13146 | 2 |
| D | 0 | 15507 | 2 |
| Mode SS | |||
|---|---|---|---|
| Quadrant | BADHDUFLAG | Total packets | Discarded packets |
| A | 0 | 128 | 0 |
| B | 0 | 128 | 0 |
| C | 0 | 128 | 0 |
| D | 0 | 128 | 0 |
| Mode M9 | |||
|---|---|---|---|
| Quadrant | BADHDUFLAG | Total packets | Discarded packets |
| A | 0 | 15 | 0 |
| B | 0 | 15 | 0 |
| C | 0 | 15 | 0 |
| D | 0 | 16 | 0 |
| Quadrant | Total seconds | Saturated seconds | Saturation percentage |
|---|---|---|---|
| A | 6203 | 49 | 0.789940% |
| B | 6203 | 368 | 5.932613% |
| C | 6203 | 51 | 0.822183% |
| D | 6203 | 94 | 1.515396% |
Noise dominated data is calculated using 1-second bins in cleaned event files. If a bin has >2000 counts, and if more than 50% of those come from <1% of pixels, then it is considered to be noise-dominated and hence unusable.
| Quadrant | # 1 sec bins | Bins with >0 counts | Bins with >2000 counts | High rate bins dominated by noise | Noise dominated (total time) | Noise dominated (detector-on time) | Marked lightcurve |
|---|---|---|---|---|---|---|---|
| A | 7433 | 6204 | 0 | 0 | 0.00% | 0.00% | 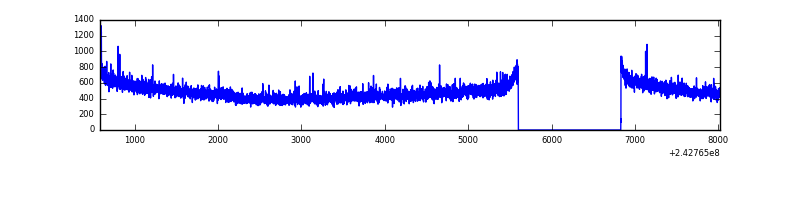 |
| B | 7433 | 6204 | 210 | 210 | 2.83% | 3.38% | 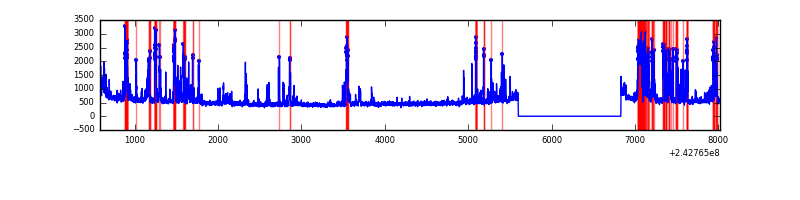 |
| C | 7433 | 6204 | 0 | 0 | 0.00% | 0.00% | 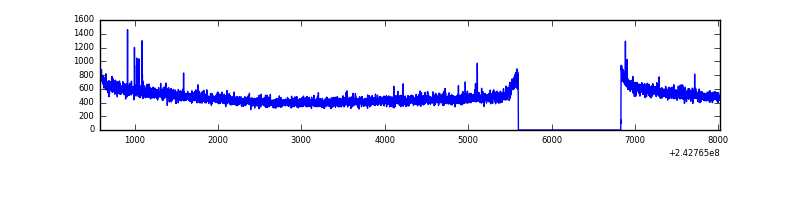 |
| D | 7433 | 6204 | 38 | 38 | 0.51% | 0.61% | 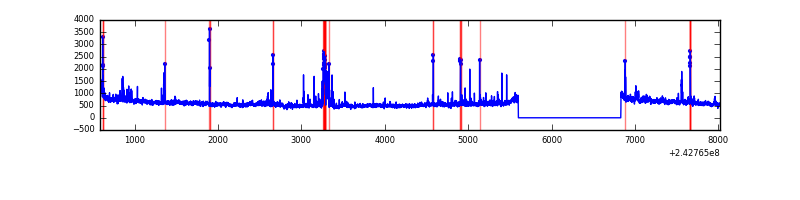 |
Top three noisy pixels from each quadrant. If the there are fewer than three noisy pixels in the level2.evt file, extra rows are filled as -1
| Pixel properties | Quadrant properties | ||||||
|---|---|---|---|---|---|---|---|
| Quadrant | DetID | PixID | Counts | Sigma | Mean | Median | Sigma |
| A | 1 | 162 | 22549 | 142.55 | 762 | 746 | 153.0 |
| A | 13 | 251 | 15432 | 96.02 | 762 | 746 | 153.0 |
| A | 13 | 253 | 9531 | 57.44 | 762 | 746 | 153.0 |
| B | 4 | 239 | 1040955 | 7316.8 | 759 | 741 | 142.2 |
| B | 0 | 219 | 62332 | 433.22 | 759 | 741 | 142.2 |
| B | 0 | 214 | 32146 | 220.9 | 759 | 741 | 142.2 |
| C | 14 | 234 | 14846 | 80.63 | 764 | 770 | 174.6 |
| C | 13 | 61 | 5628 | 27.83 | 764 | 770 | 174.6 |
| C | 4 | 175 | 2168 | 8.01 | 764 | 770 | 174.6 |
| D | 8 | 195 | 470628 | 2490.23 | 742 | 727 | 188.7 |
| D | 2 | 16 | 241502 | 1275.98 | 742 | 727 | 188.7 |
| D | 1 | 52 | 135815 | 715.9 | 742 | 727 | 188.7 |
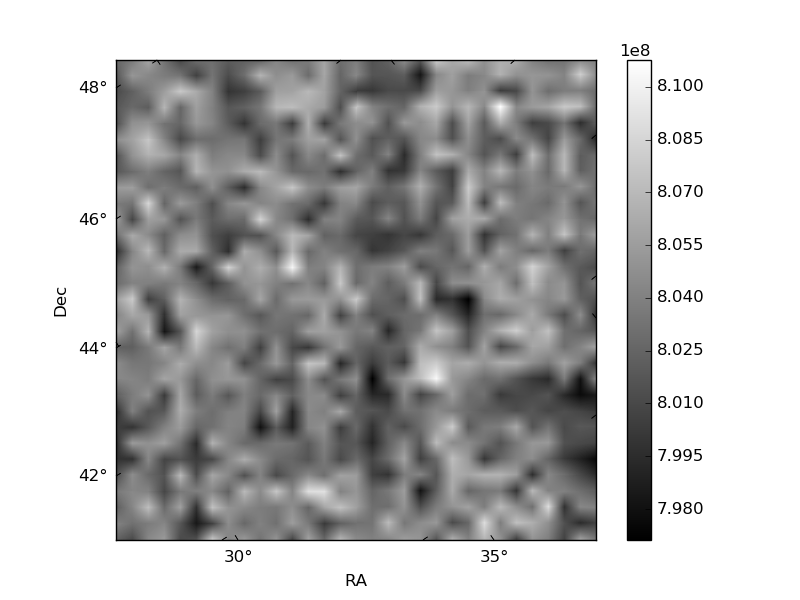
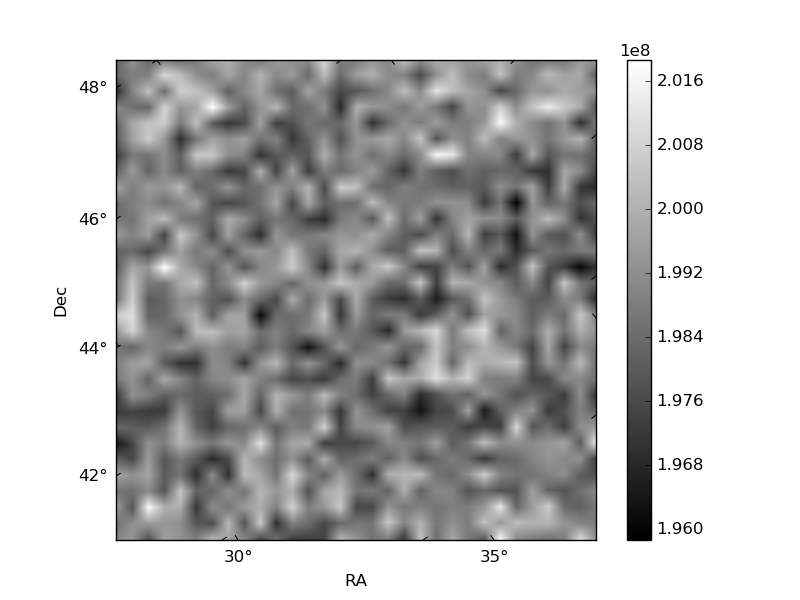
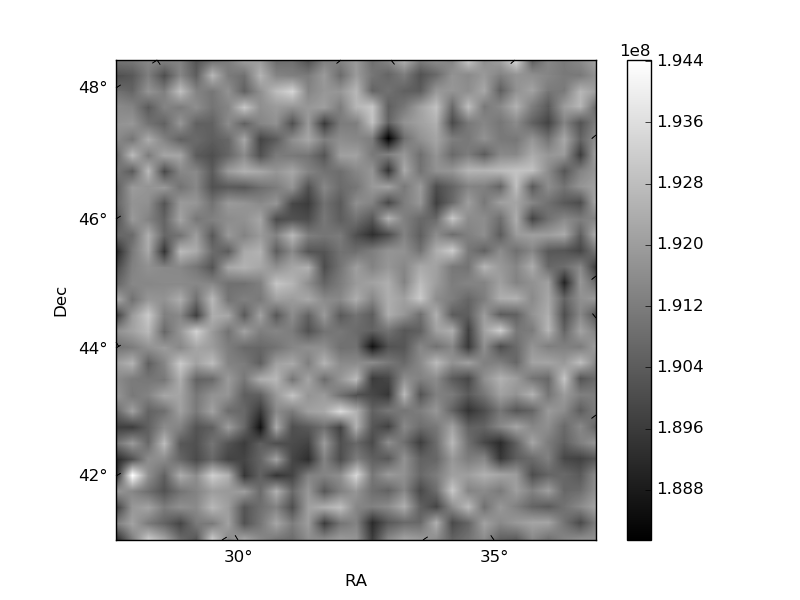
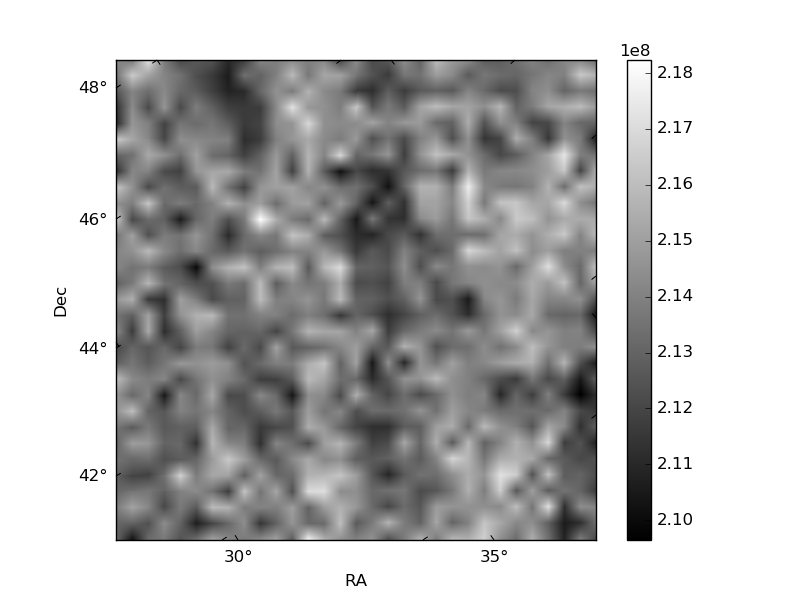
Histogram calculated using DETX and DETY for each event in the final _common_clean file
| Quadrant A | 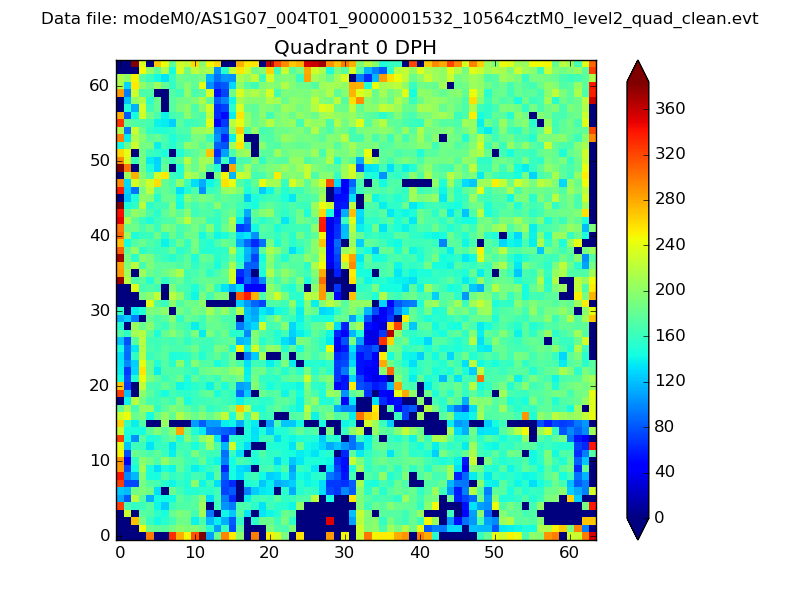 |
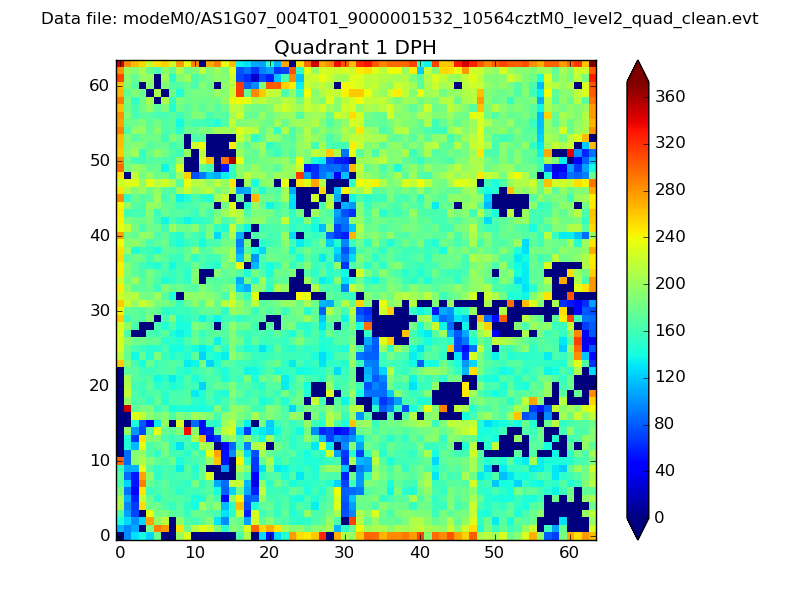 |
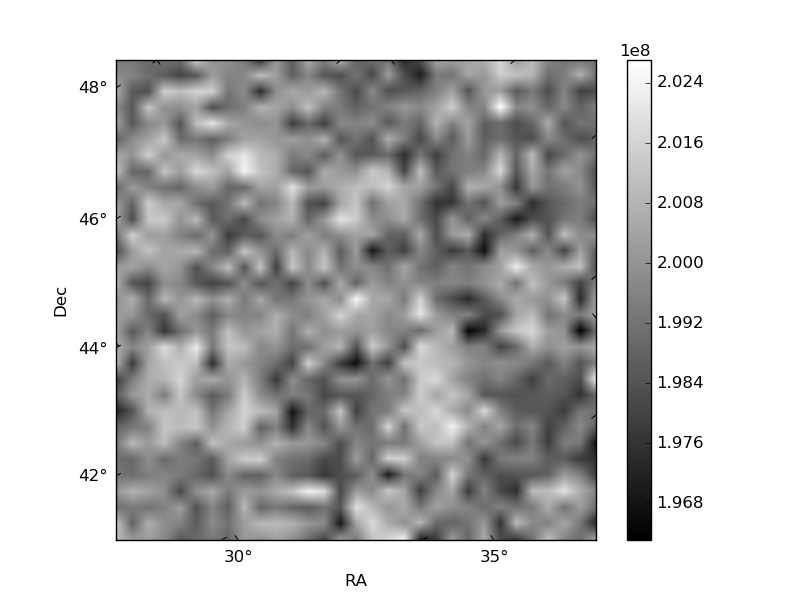
Quadrant B |
|---|---|---|---|
| Quadrant D | 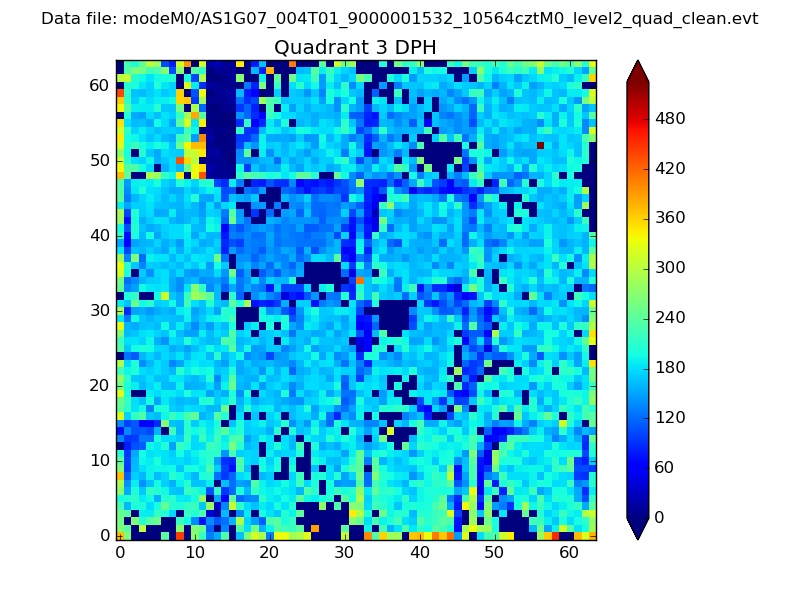 |
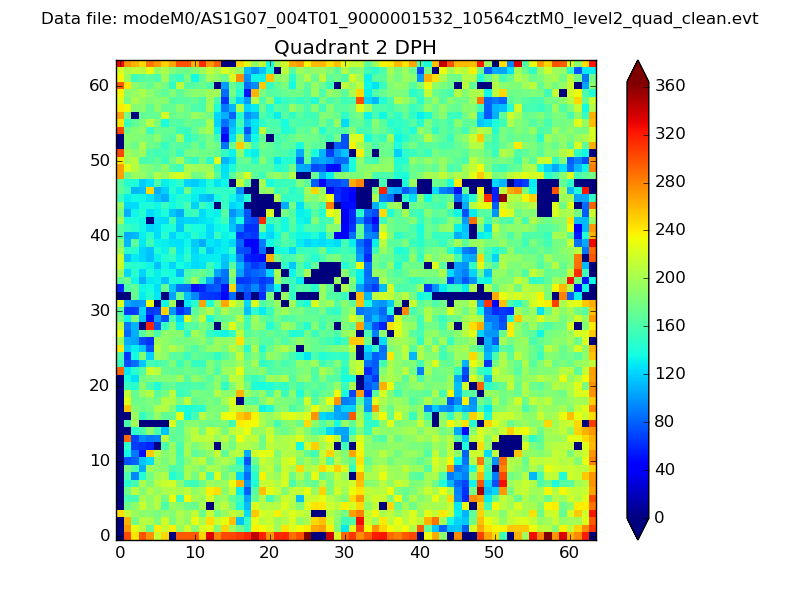 |
Quadrant C |
| Plot type | Count rate plots | Images |
|---|---|---|
| Comparison with Poisson distribution Blue bars denote a histogram of data divided into 1 sec bins. Red curve is a Poisson curve with rate = median count rate of data. |
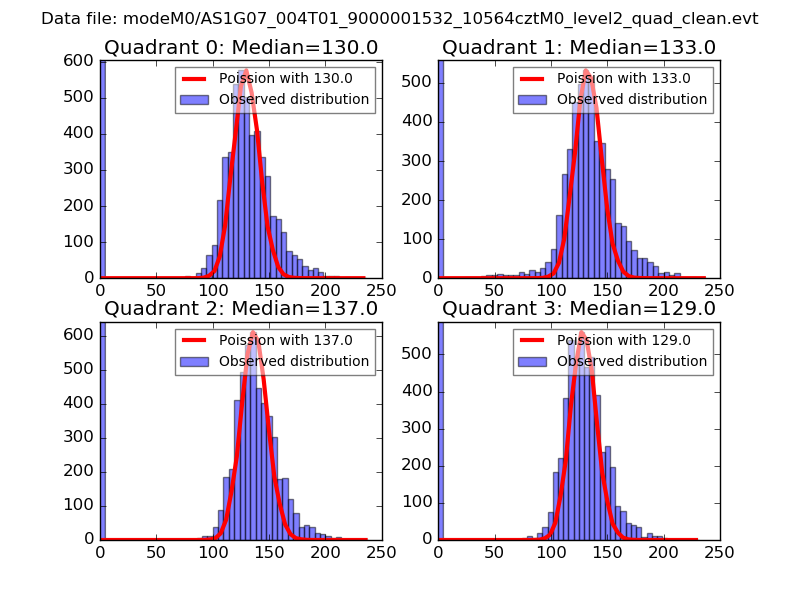 |
 |
| Quadrant-wise count rates Data is divided into 100 sec bins |
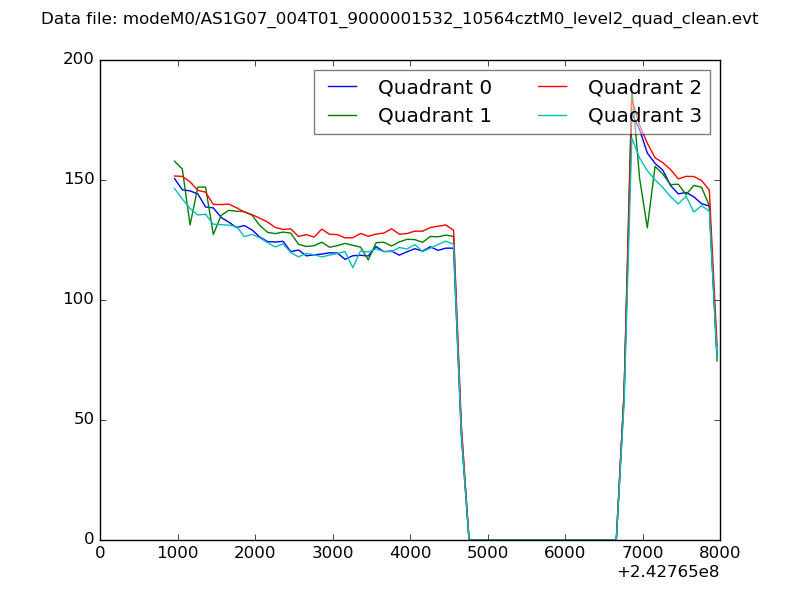 |
|
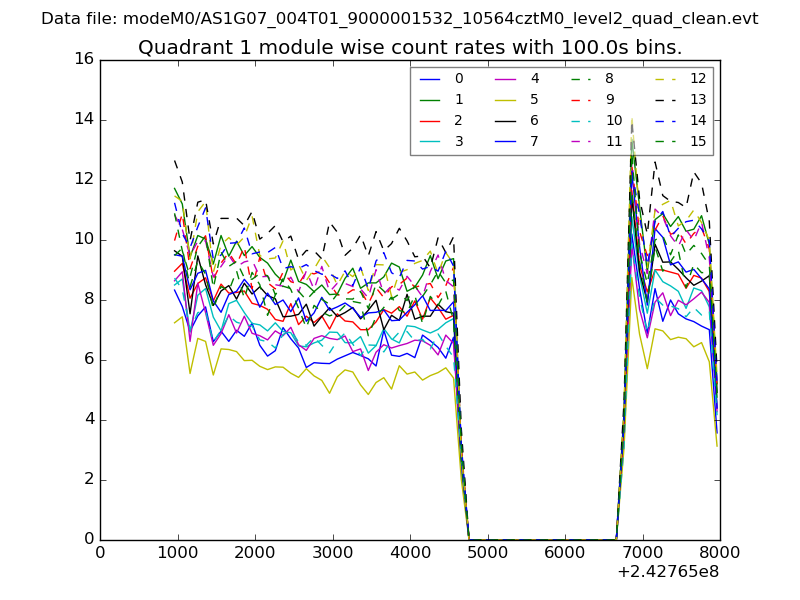
| Module-wise count rates for Quadrant A Data is divided into 100 sec bins |
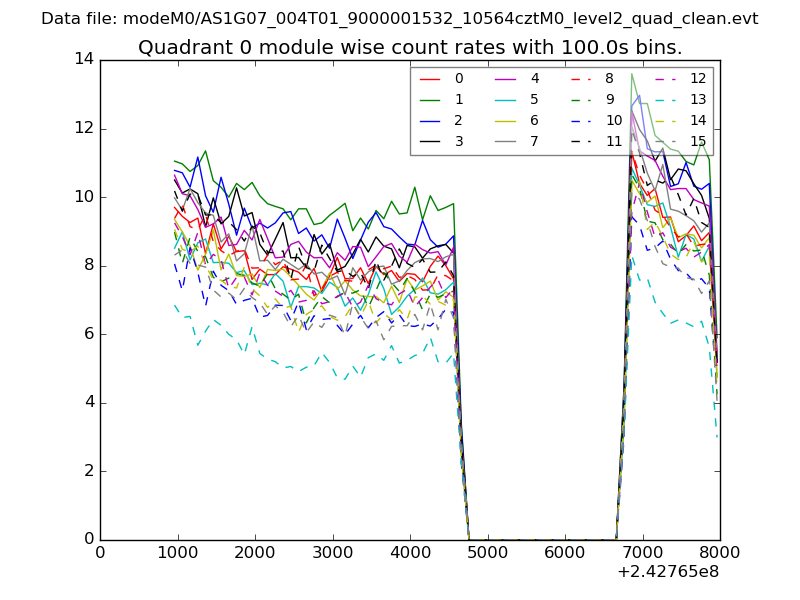 |
 |
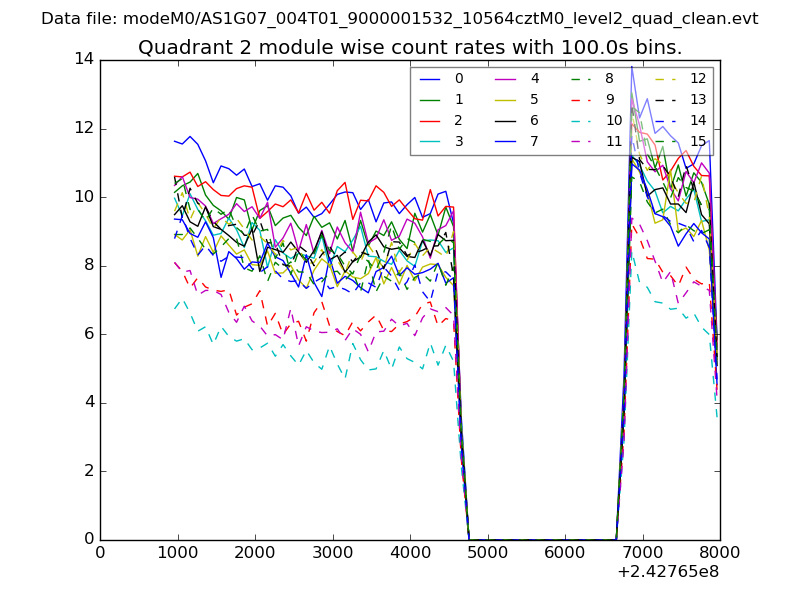
| Module-wise count rates for Quadrant B Data is divided into 100 sec bins |
 |
 |
| Module-wise count rates for Quadrant C Data is divided into 100 sec bins |
 |
 |
| Module-wise count rates for Quadrant D Data is divided into 100 sec bins |
 |
 |
| Parameter | Plot |
|---|---|
| CZT HV Monitor | 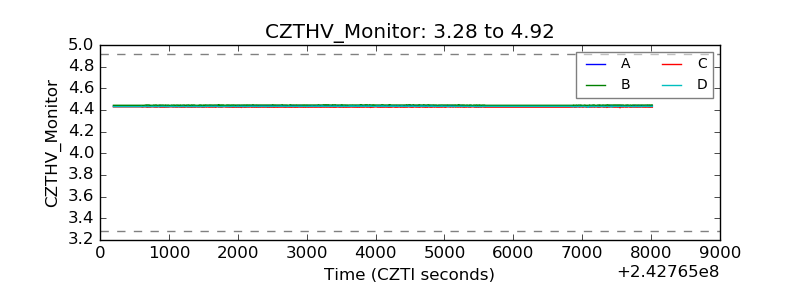 |
| D_VDD |  |
| Temperature 1 |  |
| Veto HV Monitor | 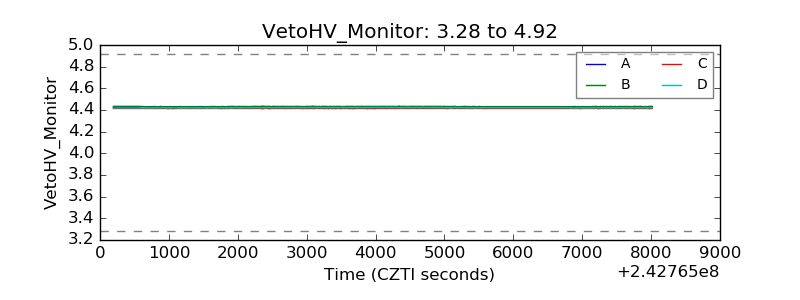 |
| Veto LLD | 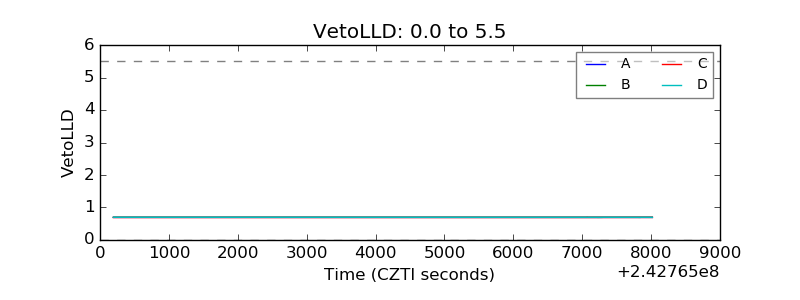 |
| Alpha Counter |  |
| _CPM_Rate | 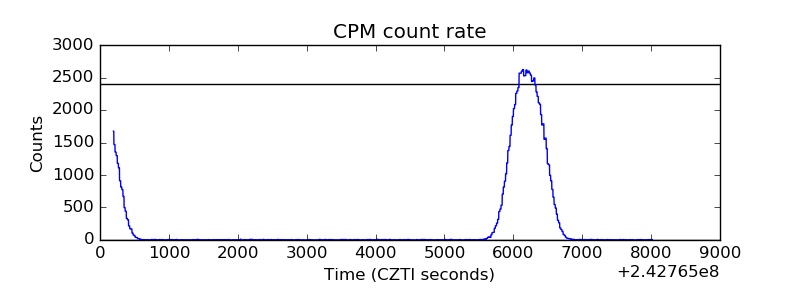 |
| CZT Counter | 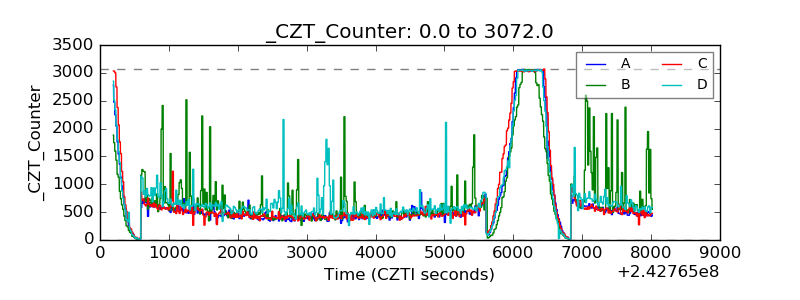 |
| +2.5 Volts monitor |  |
| +5 Volts monitor |  |
| _ROLL_ROT |  |
| _Roll_DEC |  |
| _Roll_RA | 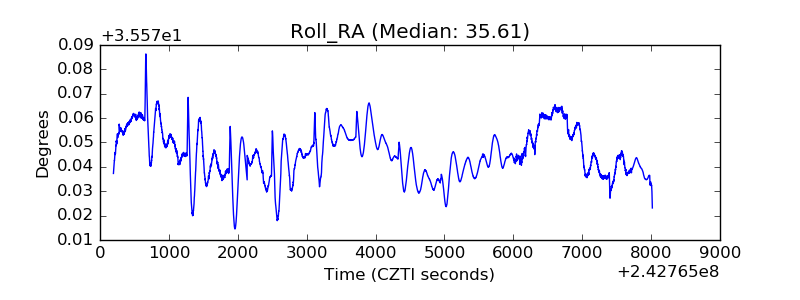 |
| Veto Counter |  |