| Param | Original file | Final file |
|---|---|---|
| Filename | modeM0/AS1G07_004T01_9000001532_10566cztM0_level2.evt | modeM0/AS1G07_004T01_9000001532_10566cztM0_level2_quad_clean.evt |
| Size (bytes) | 539,455,680 | 100,238,400 |
| Size | 514.5 MB | 95.6 MB |
| Events in quadrant A | 3,391,200 | 626,495 |
| Events in quadrant B | 4,126,119 | 654,120 |
| Events in quadrant C | 3,348,704 | 660,137 |
| Events in quadrant D | 4,994,568 | 605,083 |
| Mode M0 | |||
|---|---|---|---|
| Quadrant | BADHDUFLAG | Total packets | Discarded packets |
| A | 0 | 14747 | 5 |
| B | 0 | 16916 | 6 |
| C | 0 | 14615 | 2 |
| D | 0 | 19669 | 2 |
| Mode SS | |||
|---|---|---|---|
| Quadrant | BADHDUFLAG | Total packets | Discarded packets |
| A | 0 | 144 | 0 |
| B | 0 | 144 | 0 |
| C | 0 | 144 | 0 |
| D | 0 | 144 | 0 |
| Mode M9 | |||
|---|---|---|---|
| Quadrant | BADHDUFLAG | Total packets | Discarded packets |
| A | 0 | 26 | 0 |
| B | 0 | 26 | 0 |
| C | 0 | 26 | 0 |
| D | 0 | 26 | 0 |
| Quadrant | Total seconds | Saturated seconds | Saturation percentage |
|---|---|---|---|
| A | 7035 | 50 | 0.710732% |
| B | 7034 | 225 | 3.198749% |
| C | 7036 | 45 | 0.639568% |
| D | 7036 | 191 | 2.714611% |
Noise dominated data is calculated using 1-second bins in cleaned event files. If a bin has >2000 counts, and if more than 50% of those come from <1% of pixels, then it is considered to be noise-dominated and hence unusable.
| Quadrant | # 1 sec bins | Bins with >0 counts | Bins with >2000 counts | High rate bins dominated by noise | Noise dominated (total time) | Noise dominated (detector-on time) | Marked lightcurve |
|---|---|---|---|---|---|---|---|
| A | 9666 | 7039 | 0 | 0 | 0.00% | 0.00% | 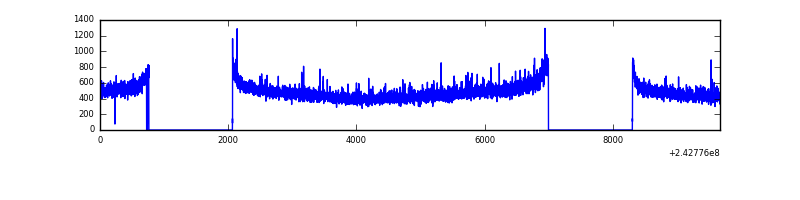 |
| B | 9666 | 7039 | 97 | 97 | 1.00% | 1.38% | 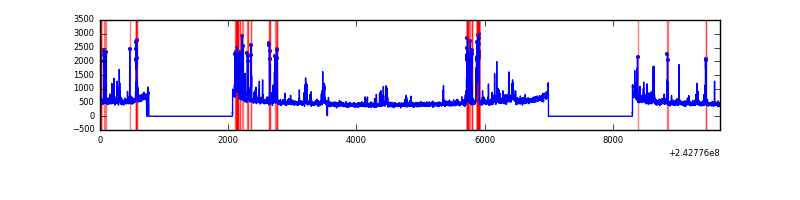 |
| C | 9666 | 7039 | 0 | 0 | 0.00% | 0.00% | 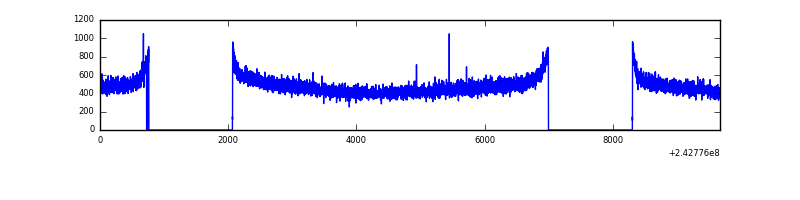 |
| D | 9666 | 7039 | 107 | 107 | 1.11% | 1.52% | 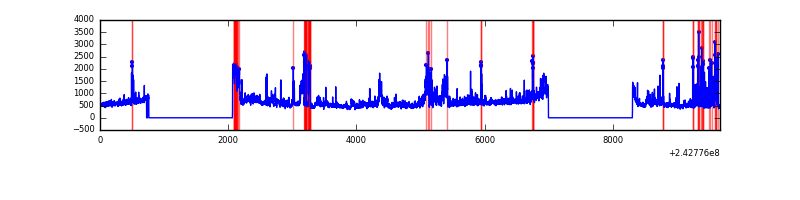 |
Top three noisy pixels from each quadrant. If the there are fewer than three noisy pixels in the level2.evt file, extra rows are filled as -1
| Pixel properties | Quadrant properties | ||||||
|---|---|---|---|---|---|---|---|
| Quadrant | DetID | PixID | Counts | Sigma | Mean | Median | Sigma |
| A | 1 | 162 | 33278 | 186.99 | 862 | 845 | 173.4 |
| A | 13 | 251 | 11228 | 59.86 | 862 | 845 | 173.4 |
| A | 1 | 178 | 10126 | 53.51 | 862 | 845 | 173.4 |
| B | 4 | 239 | 637762 | 3939.7 | 869 | 849 | 161.7 |
| B | 0 | 214 | 68006 | 415.41 | 869 | 849 | 161.7 |
| B | 0 | 219 | 32600 | 196.4 | 869 | 849 | 161.7 |
| C | 13 | 61 | 6472 | 28.52 | 857 | 862 | 196.7 |
| C | 14 | 234 | 4076 | 16.34 | 857 | 862 | 196.7 |
| C | 4 | 175 | 3519 | 13.5 | 857 | 862 | 196.7 |
| D | 2 | 16 | 1281259 | 6481.1 | 834 | 809 | 197.6 |
| D | 8 | 195 | 306235 | 1545.94 | 834 | 809 | 197.6 |
| D | 12 | 233 | 183426 | 924.33 | 834 | 809 | 197.6 |
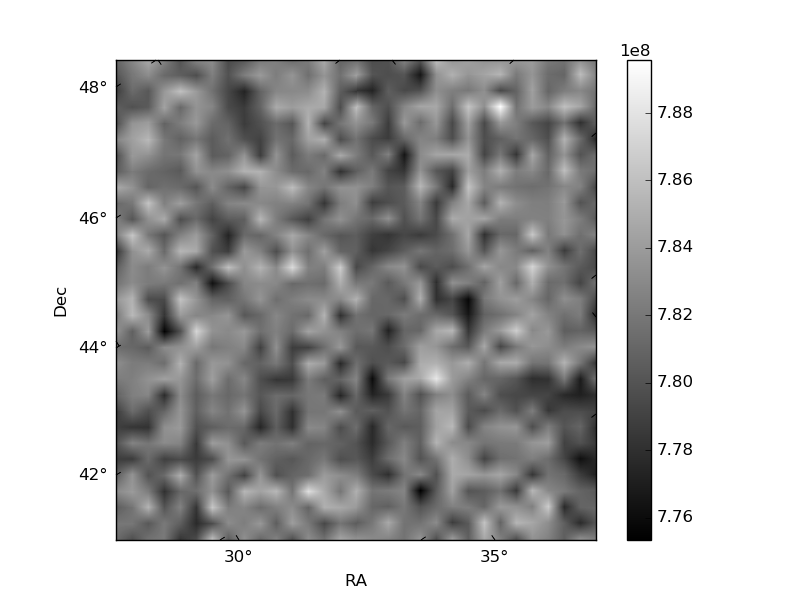
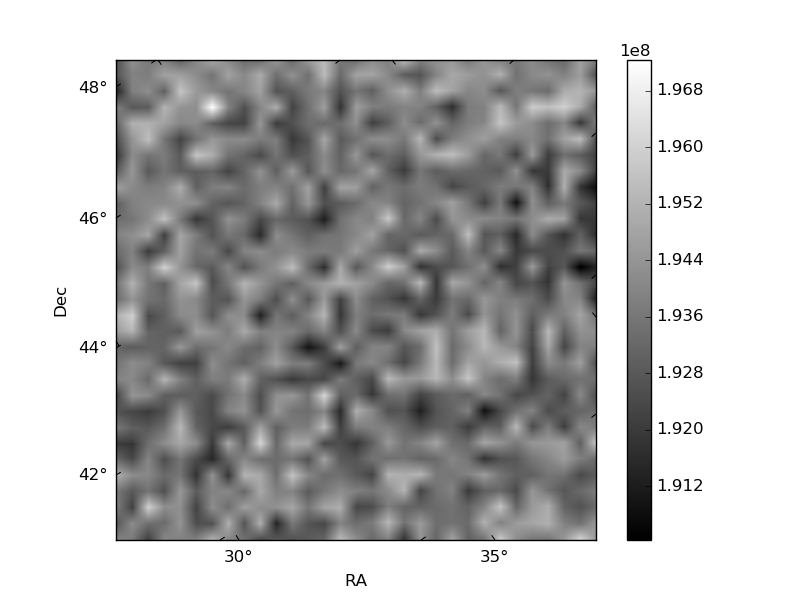
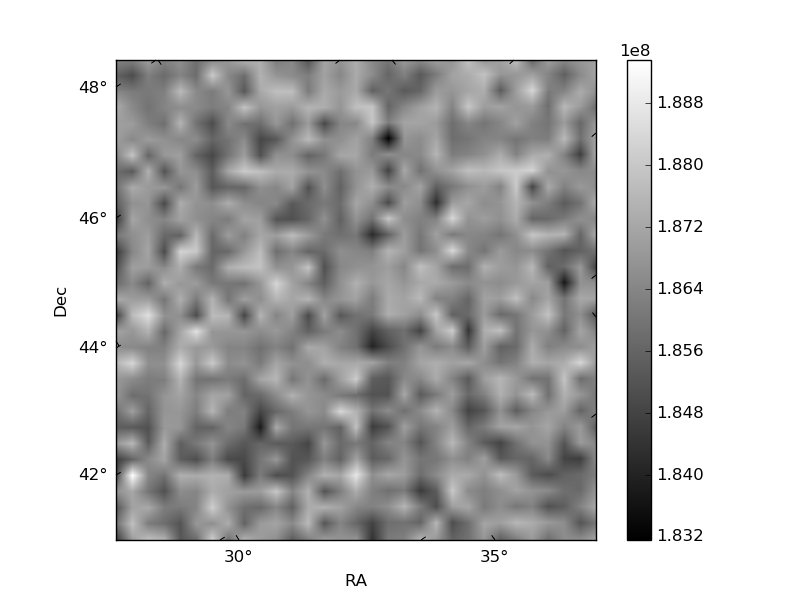
Histogram calculated using DETX and DETY for each event in the final _common_clean file
| Quadrant A | 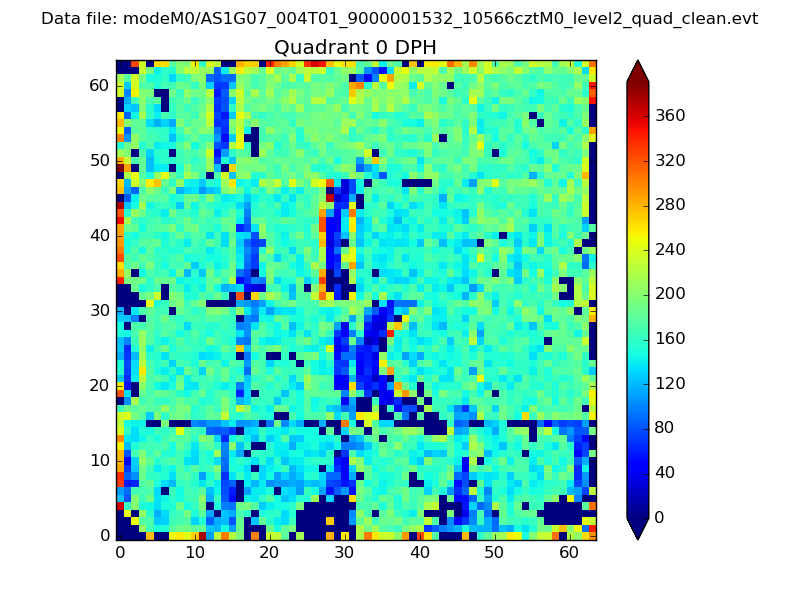 |
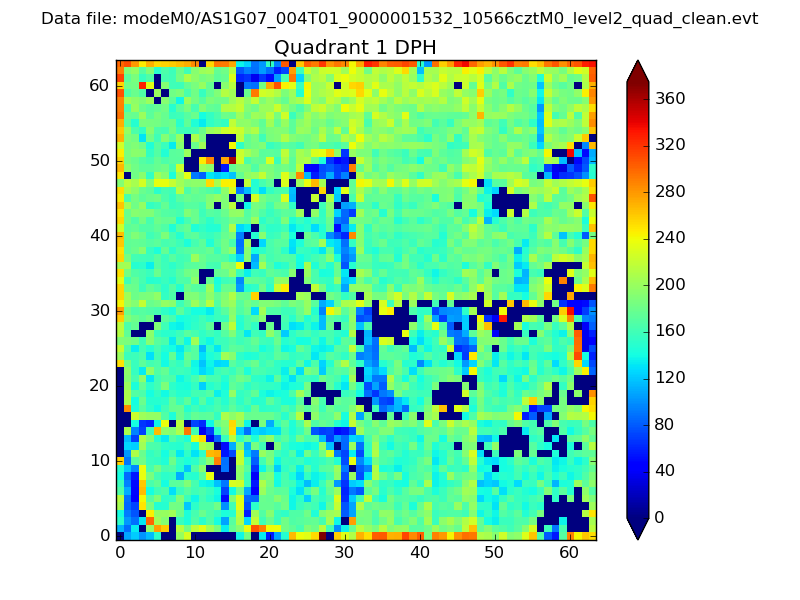 |
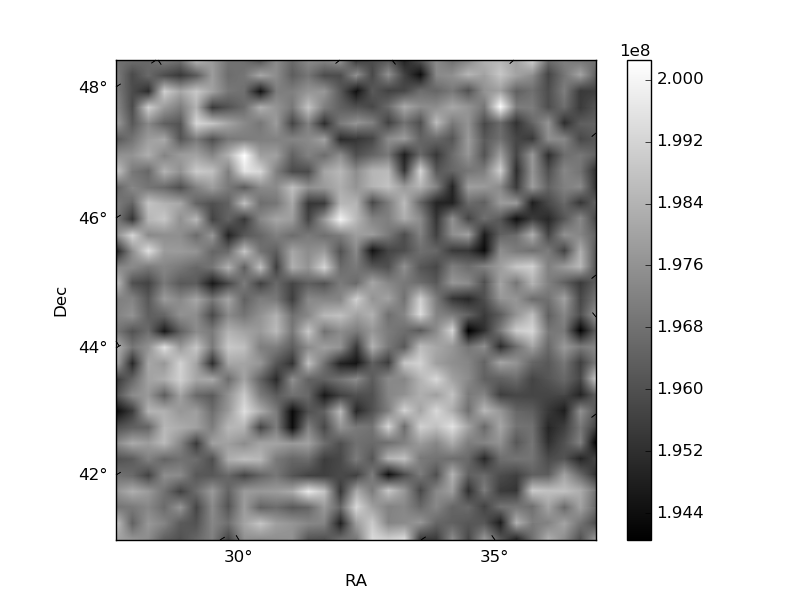
Quadrant B |
|---|---|---|---|
| Quadrant D | 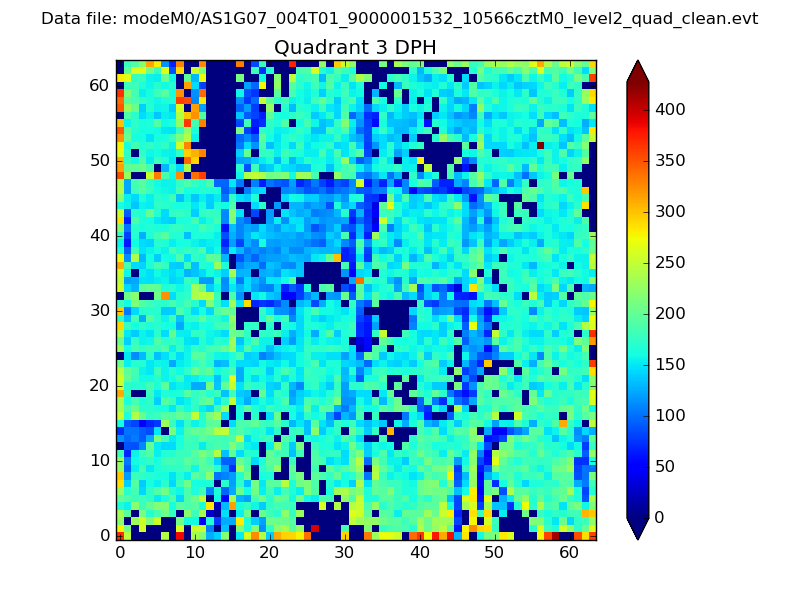 |
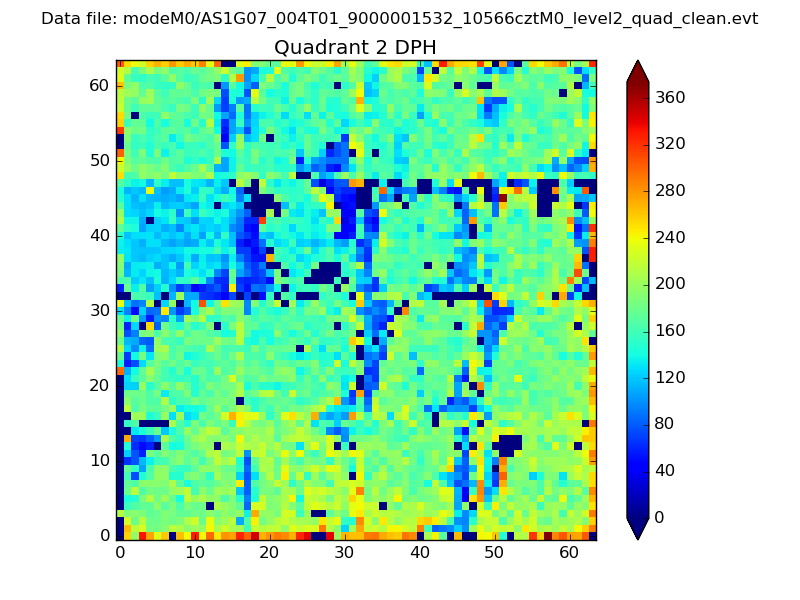 |
Quadrant C |
| Plot type | Count rate plots | Images |
|---|---|---|
| Comparison with Poisson distribution Blue bars denote a histogram of data divided into 1 sec bins. Red curve is a Poisson curve with rate = median count rate of data. |
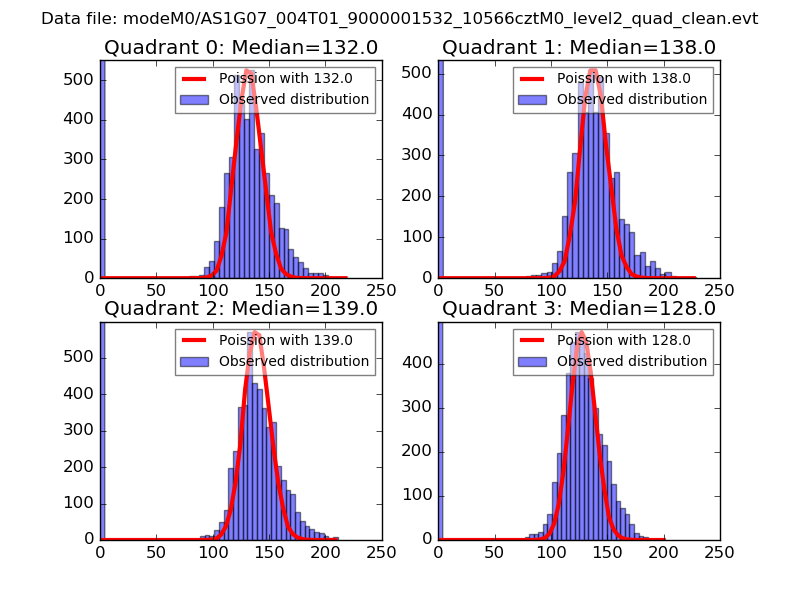 |
 |
| Quadrant-wise count rates Data is divided into 100 sec bins |
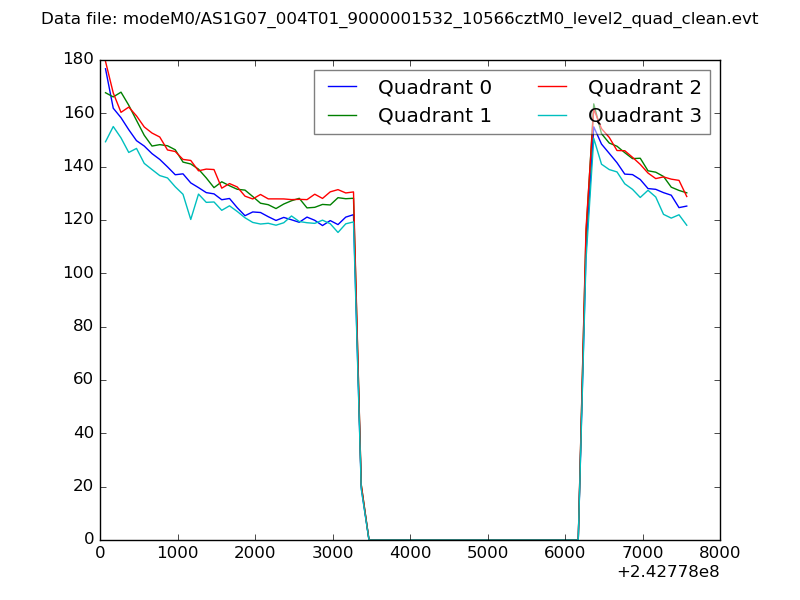 |
|
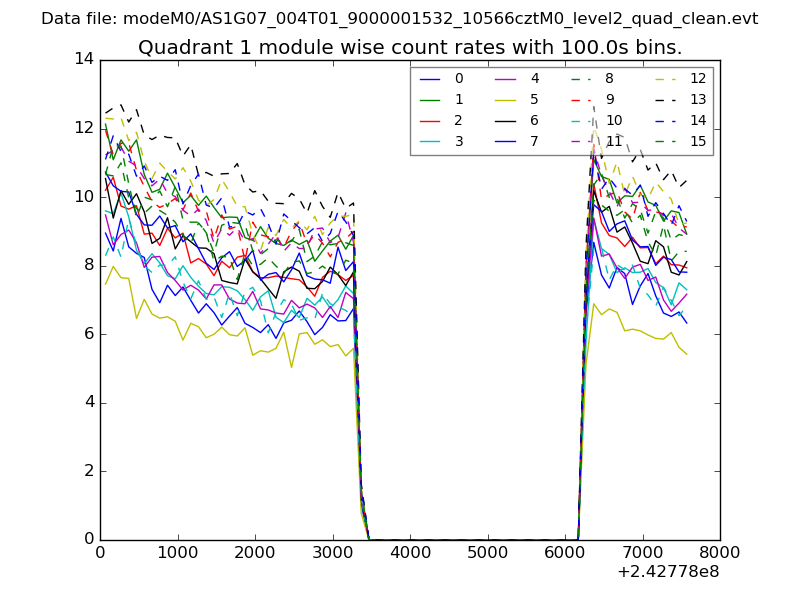
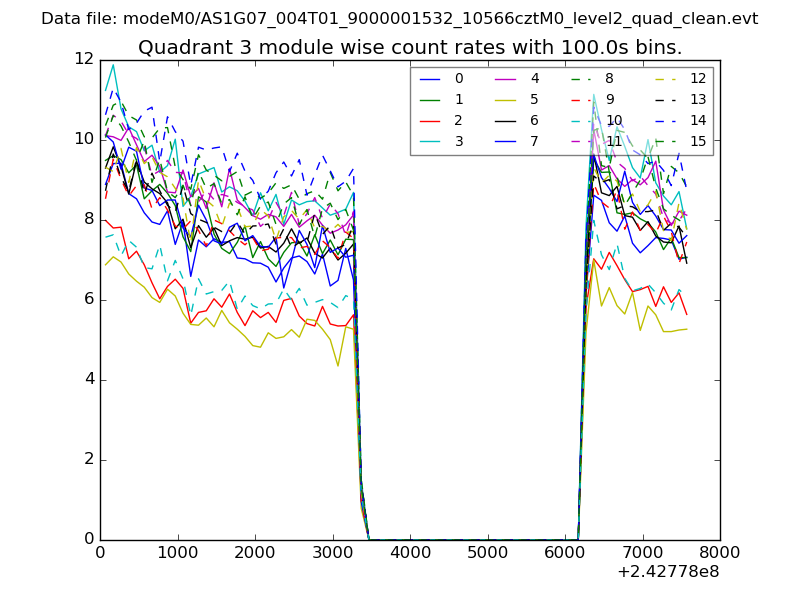
| Module-wise count rates for Quadrant A Data is divided into 100 sec bins |
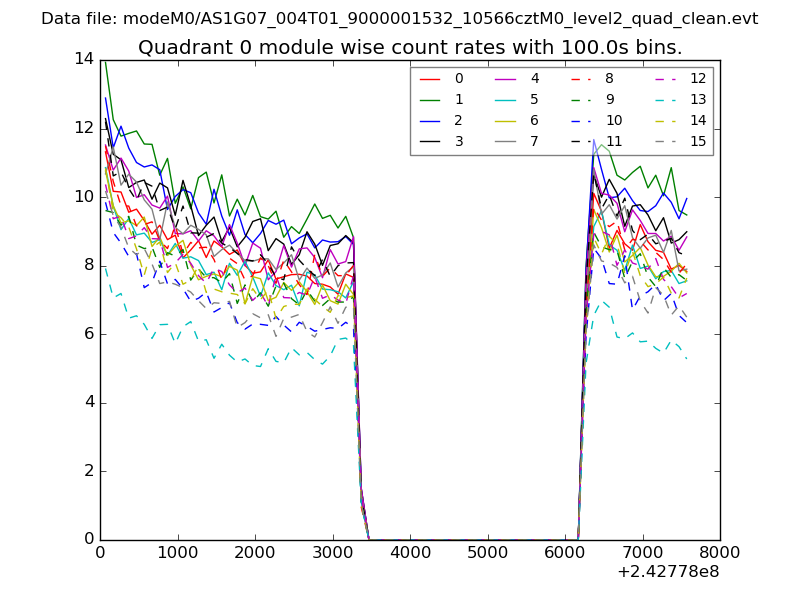 |
 |
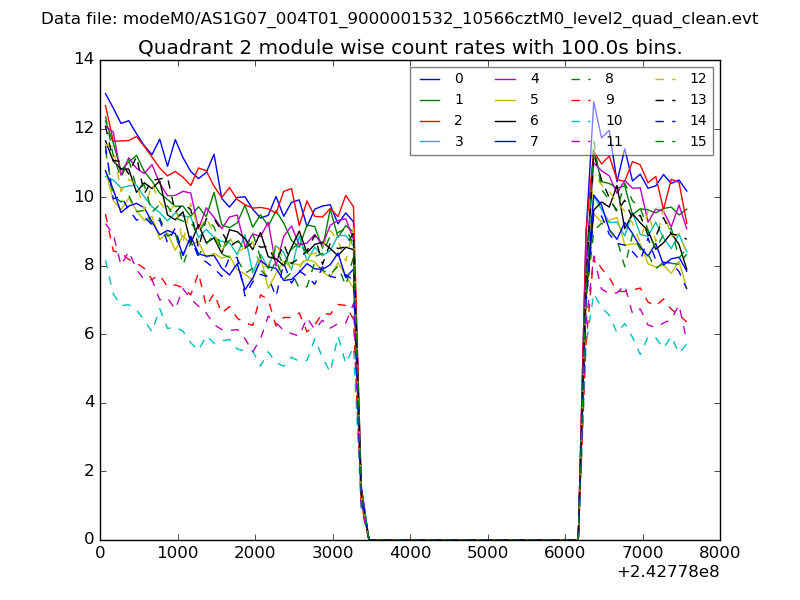
| Module-wise count rates for Quadrant B Data is divided into 100 sec bins |
 |
 |
| Module-wise count rates for Quadrant C Data is divided into 100 sec bins |
 |
 |
| Module-wise count rates for Quadrant D Data is divided into 100 sec bins |
 |
 |
| Parameter | Plot |
|---|---|
| CZT HV Monitor | 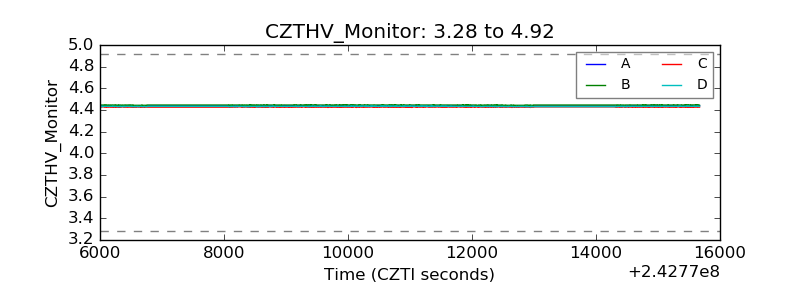 |
| D_VDD | 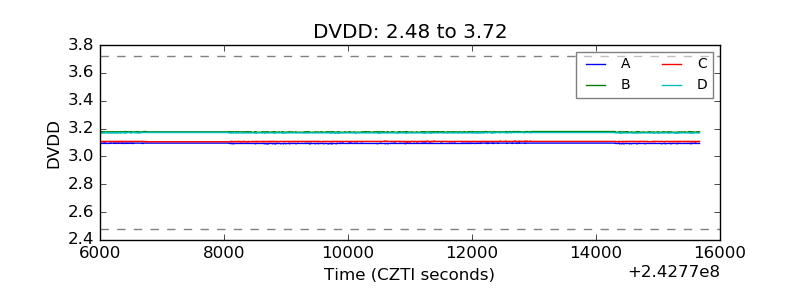 |
| Temperature 1 | 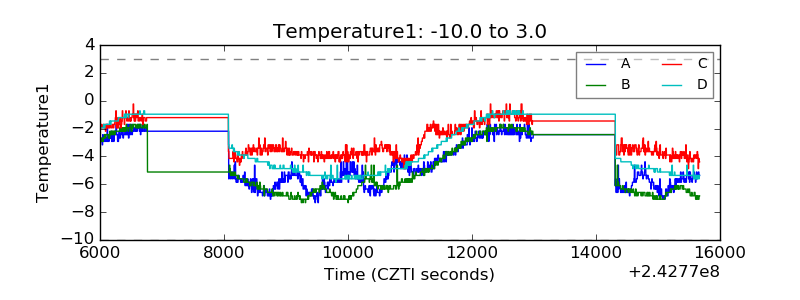 |
| Veto HV Monitor | 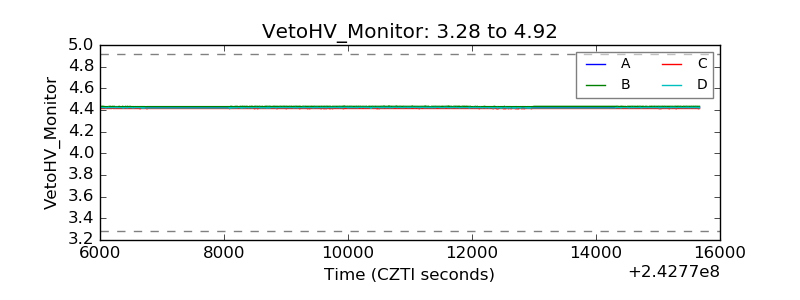 |
| Veto LLD | 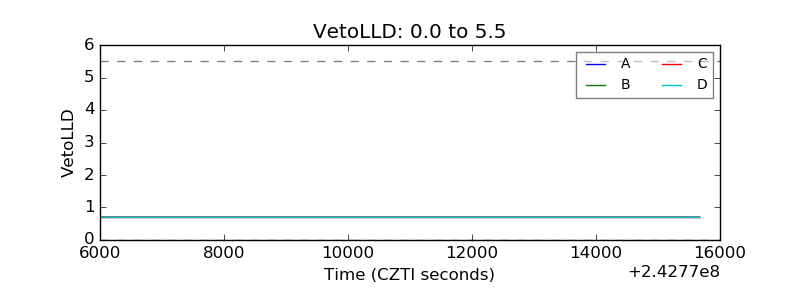 |
| Alpha Counter | 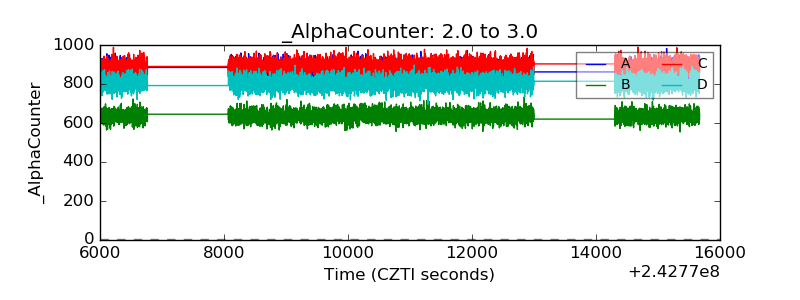 |
| _CPM_Rate | 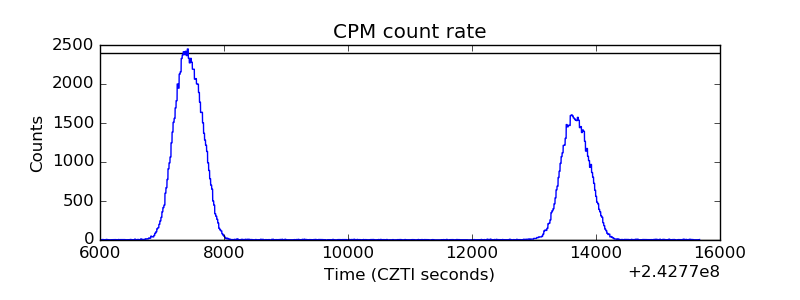 |
| CZT Counter | 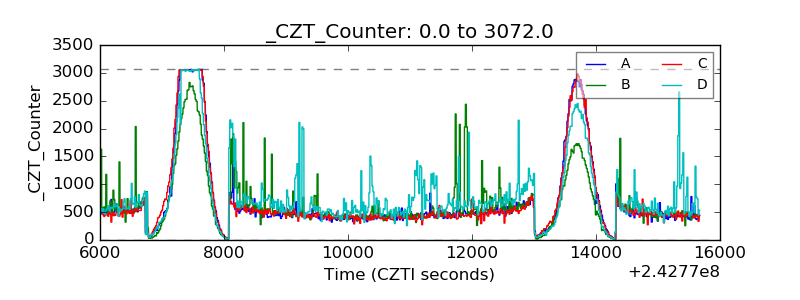 |
| +2.5 Volts monitor |  |
| +5 Volts monitor |  |
| _ROLL_ROT |  |
| _Roll_DEC | 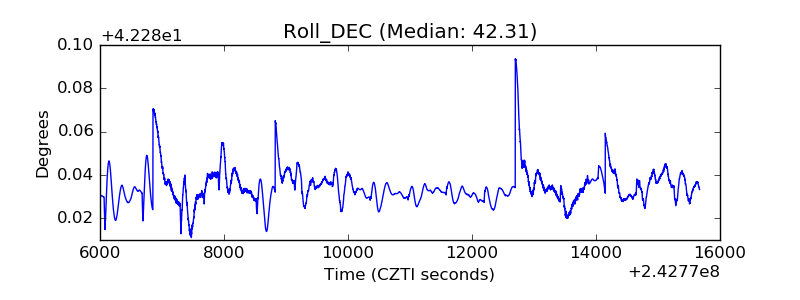 |
| _Roll_RA | 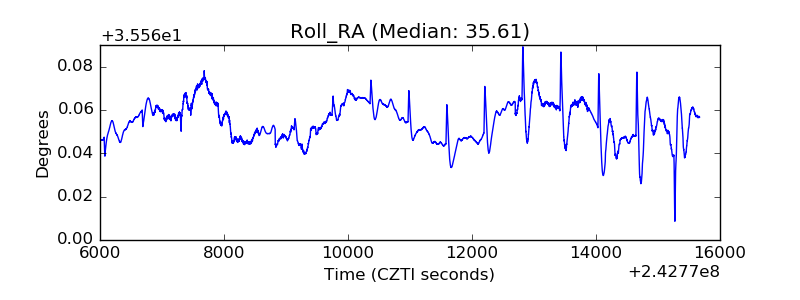 |
| Veto Counter | 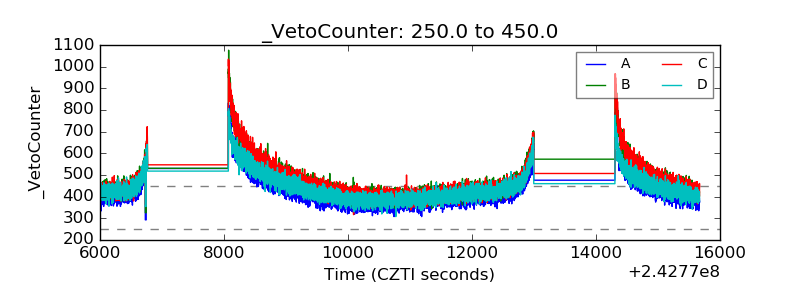 |