| Param | Original file | Final file |
|---|---|---|
| Filename | modeM0/AS1G07_004T01_9000001532_10568cztM0_level2.evt | modeM0/AS1G07_004T01_9000001532_10568cztM0_level2_quad_clean.evt |
| Size (bytes) | 722,672,640 | 122,791,680 |
| Size | 689.2 MB | 117.1 MB |
| Events in quadrant A | 4,652,292 | 735,625 |
| Events in quadrant B | 5,851,222 | 759,723 |
| Events in quadrant C | 4,594,860 | 779,940 |
| Events in quadrant D | 6,087,671 | 727,528 |
| Mode M0 | |||
|---|---|---|---|
| Quadrant | BADHDUFLAG | Total packets | Discarded packets |
| A | 0 | 22022 | 957 |
| B | 0 | 25834 | 1316 |
| C | 0 | 22067 | 852 |
| D | 0 | 26265 | 1072 |
| Mode SS | |||
|---|---|---|---|
| Quadrant | BADHDUFLAG | Total packets | Discarded packets |
| A | 0 | 220 | 10 |
| B | 0 | 220 | 4 |
| C | 0 | 220 | 12 |
| D | 0 | 220 | 12 |
| Mode M9 | |||
|---|---|---|---|
| Quadrant | BADHDUFLAG | Total packets | Discarded packets |
| A | 0 | 22 | 6 |
| B | 0 | 22 | 8 |
| C | 0 | 22 | 8 |
| D | 0 | 22 | 6 |
| Quadrant | Total seconds | Saturated seconds | Saturation percentage |
|---|---|---|---|
| A | 10308 | 29 | 0.281335% |
| B | 10325 | 355 | 3.438257% |
| C | 10355 | 17 | 0.164172% |
| D | 10332 | 91 | 0.880759% |
Noise dominated data is calculated using 1-second bins in cleaned event files. If a bin has >2000 counts, and if more than 50% of those come from <1% of pixels, then it is considered to be noise-dominated and hence unusable.
| Quadrant | # 1 sec bins | Bins with >0 counts | Bins with >2000 counts | High rate bins dominated by noise | Noise dominated (total time) | Noise dominated (detector-on time) | Marked lightcurve |
|---|---|---|---|---|---|---|---|
| A | 12999 | 10437 | 1 | 1 | 0.01% | 0.01% | 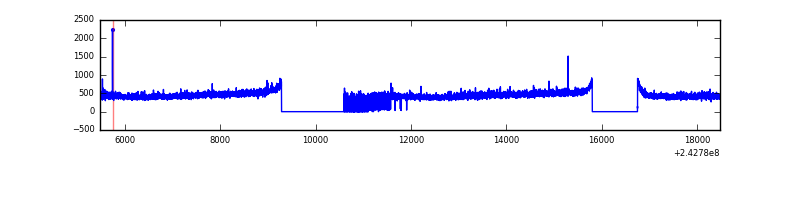 |
| B | 12999 | 10461 | 163 | 163 | 1.25% | 1.56% | 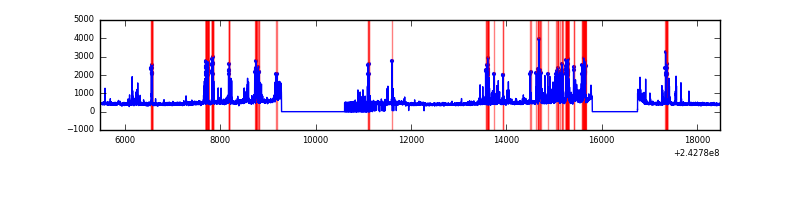 |
| C | 12999 | 10491 | 5 | 5 | 0.04% | 0.05% | 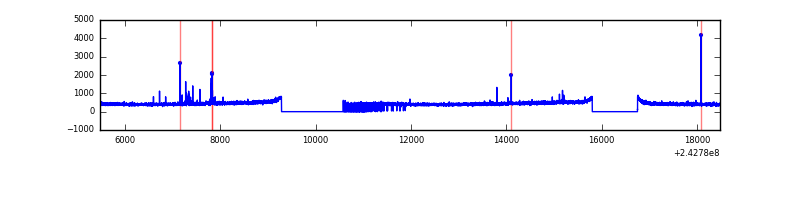 |
| D | 12999 | 10474 | 65 | 65 | 0.50% | 0.62% | 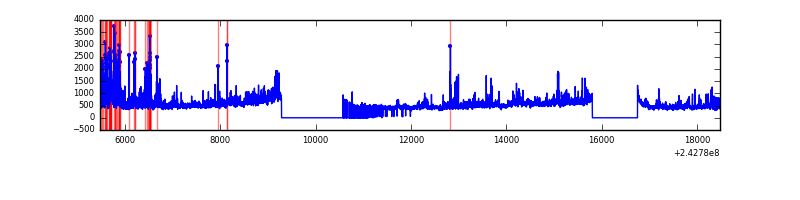 |
Top three noisy pixels from each quadrant. If the there are fewer than three noisy pixels in the level2.evt file, extra rows are filled as -1
| Pixel properties | Quadrant properties | ||||||
|---|---|---|---|---|---|---|---|
| Quadrant | DetID | PixID | Counts | Sigma | Mean | Median | Sigma |
| A | 1 | 162 | 38540 | 156.8 | 1184 | 1161 | 238.4 |
| A | 13 | 251 | 30493 | 123.05 | 1184 | 1161 | 238.4 |
| A | 0 | 226 | 10669 | 39.89 | 1184 | 1161 | 238.4 |
| B | 4 | 239 | 1117182 | 4927.64 | 1187 | 1159 | 226.5 |
| B | 0 | 214 | 41260 | 177.06 | 1187 | 1159 | 226.5 |
| B | 0 | 219 | 29501 | 125.14 | 1187 | 1159 | 226.5 |
| C | 14 | 234 | 55736 | 204.79 | 1163 | 1170 | 266.4 |
| C | 13 | 61 | 8776 | 28.55 | 1163 | 1170 | 266.4 |
| C | 4 | 175 | 4562 | 12.73 | 1163 | 1170 | 266.4 |
| D | 2 | 16 | 991024 | 3625.9 | 1144 | 1112 | 273.0 |
| D | 12 | 233 | 467350 | 1707.76 | 1144 | 1112 | 273.0 |
| D | 8 | 195 | 209577 | 763.57 | 1144 | 1112 | 273.0 |
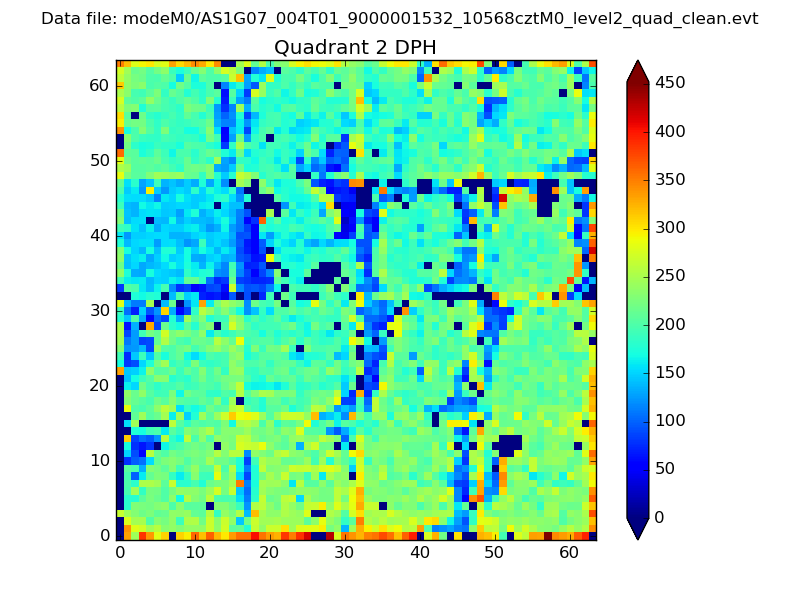
Histogram calculated using DETX and DETY for each event in the final _common_clean file
| Quadrant A | 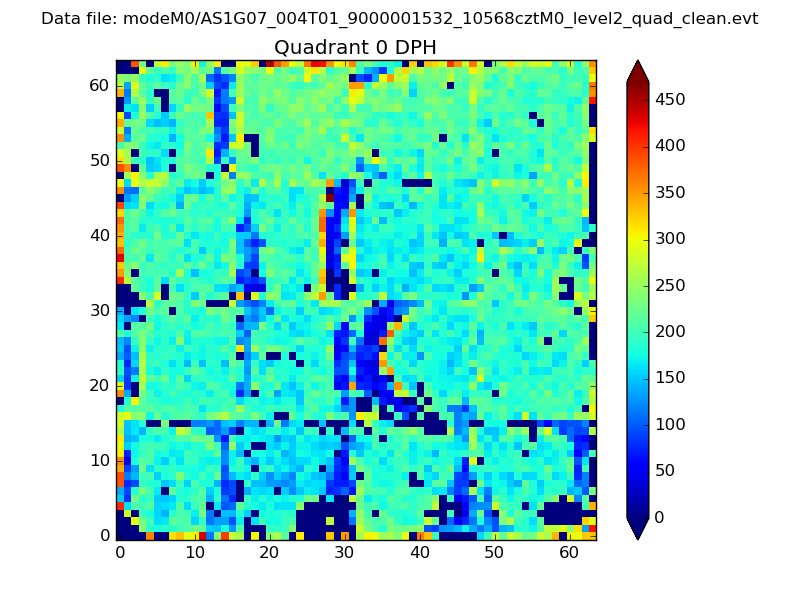 |
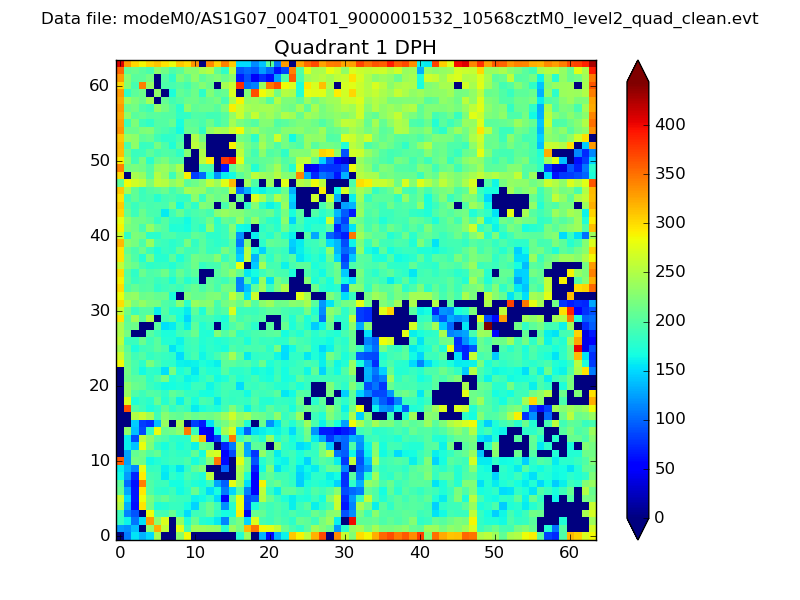 |
Quadrant B |
|---|---|---|---|
| Quadrant D | 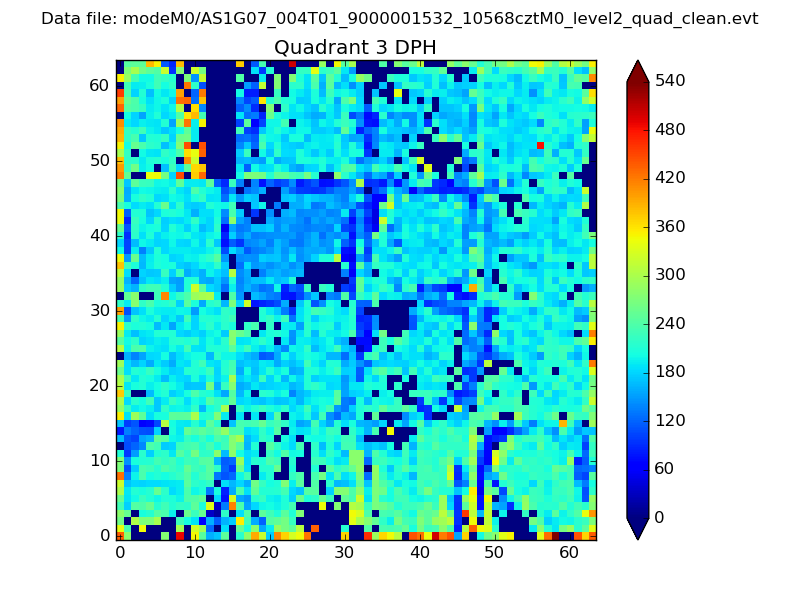 |
 |
Quadrant C |
| Plot type | Count rate plots | Images |
|---|---|---|
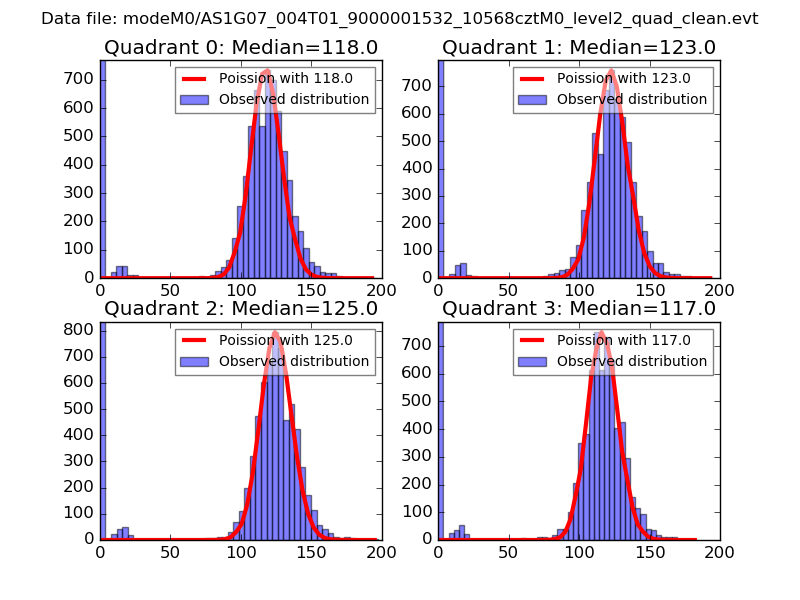
| Comparison with Poisson distribution Blue bars denote a histogram of data divided into 1 sec bins. Red curve is a Poisson curve with rate = median count rate of data. |
 |
 |
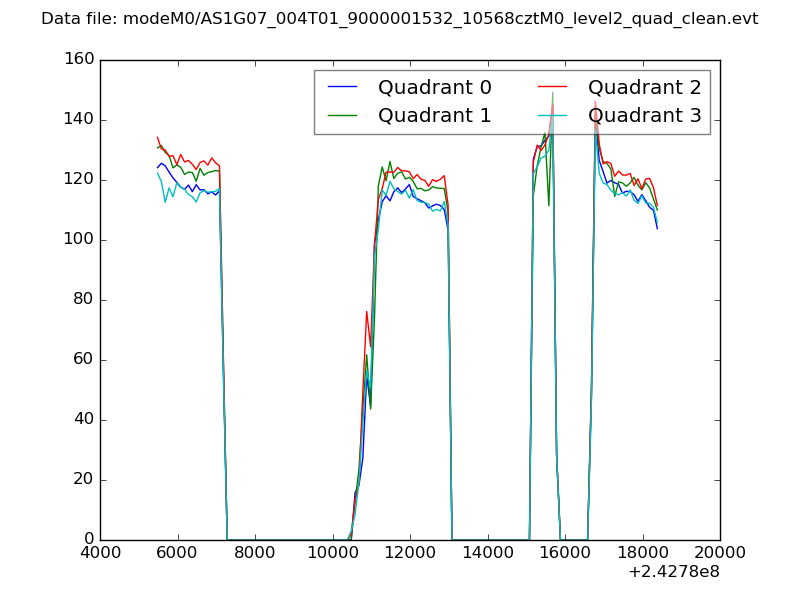
| Quadrant-wise count rates Data is divided into 100 sec bins |
 |
|
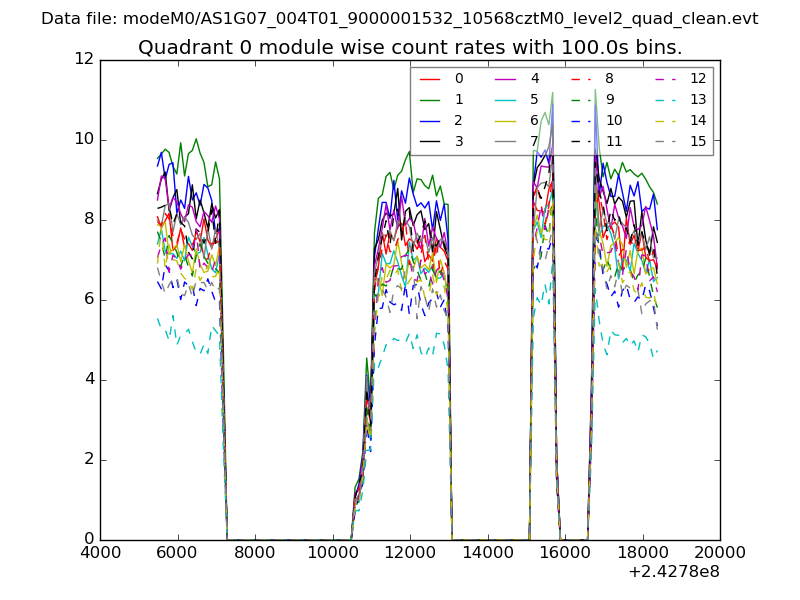
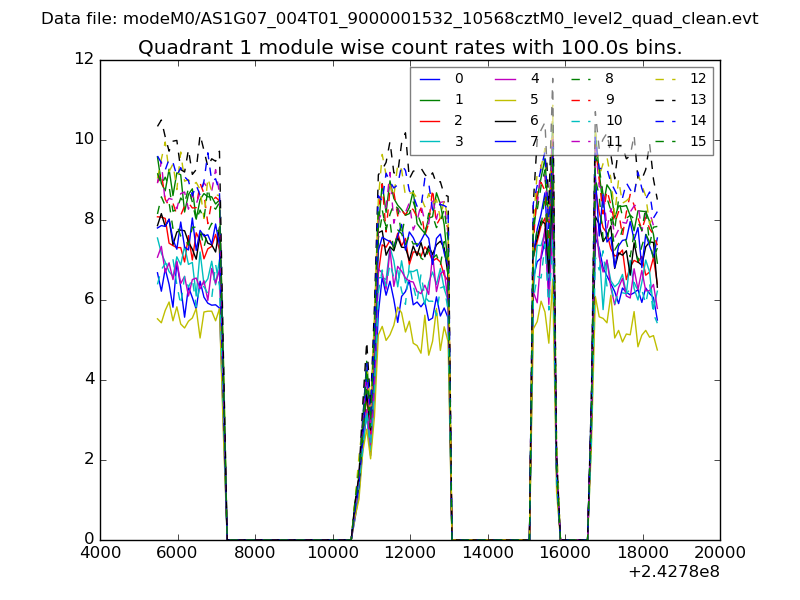
| Module-wise count rates for Quadrant A Data is divided into 100 sec bins |
 |
 |
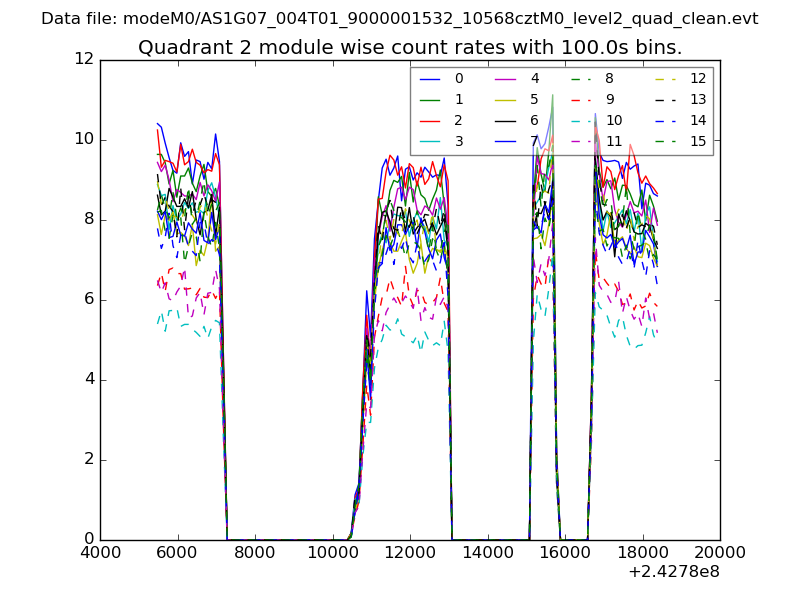
| Module-wise count rates for Quadrant B Data is divided into 100 sec bins |
 |
 |
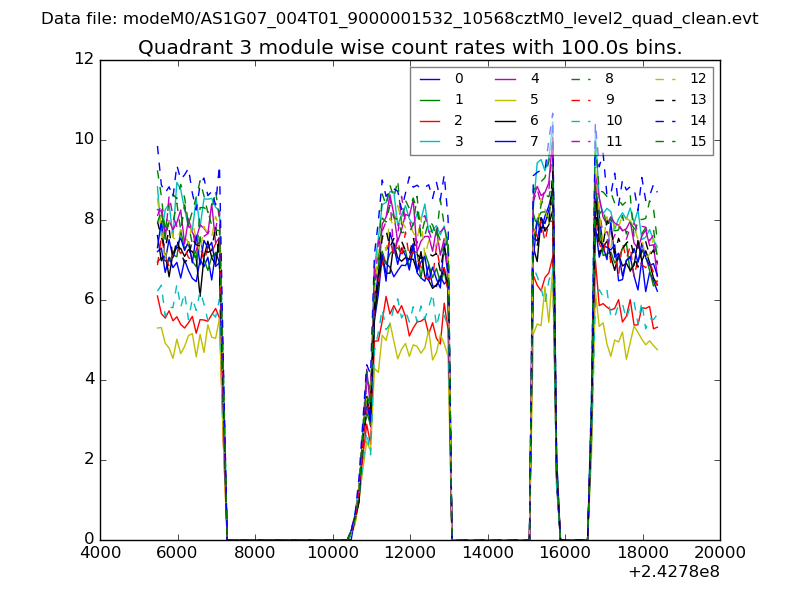
| Module-wise count rates for Quadrant C Data is divided into 100 sec bins |
 |
 |
| Module-wise count rates for Quadrant D Data is divided into 100 sec bins |
 |
 |
| Parameter | Plot |
|---|---|
| CZT HV Monitor | 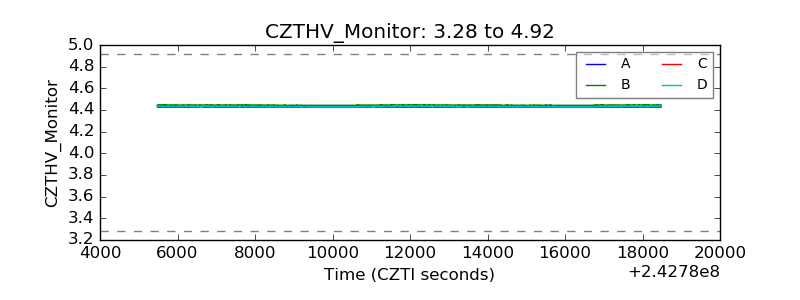 |
| D_VDD |  |
| Temperature 1 | 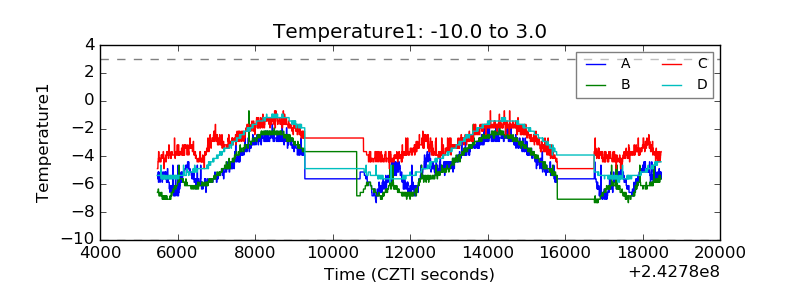 |
| Veto HV Monitor | 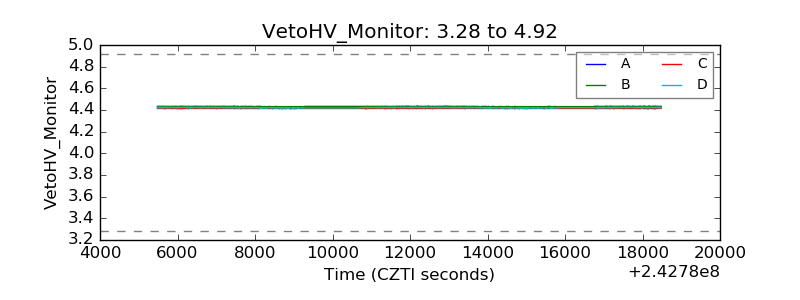 |
| Veto LLD | 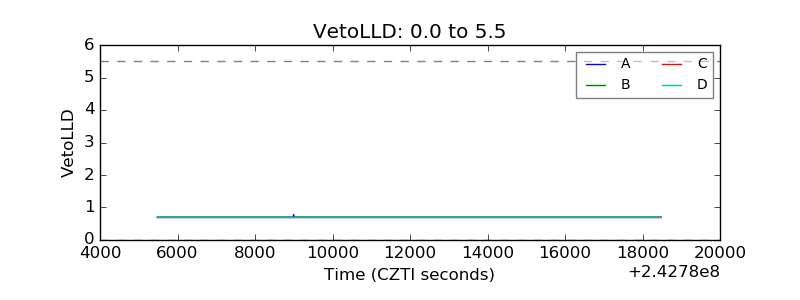 |
| Alpha Counter | 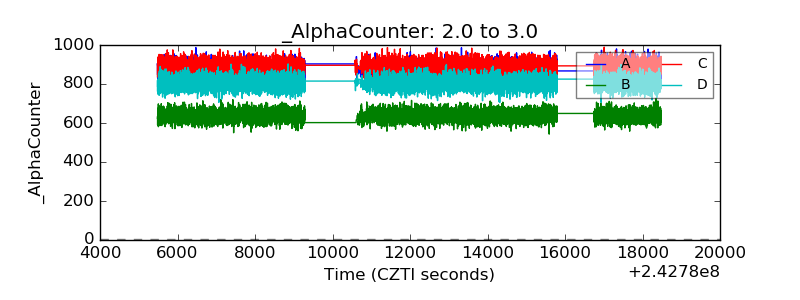 |
| _CPM_Rate | 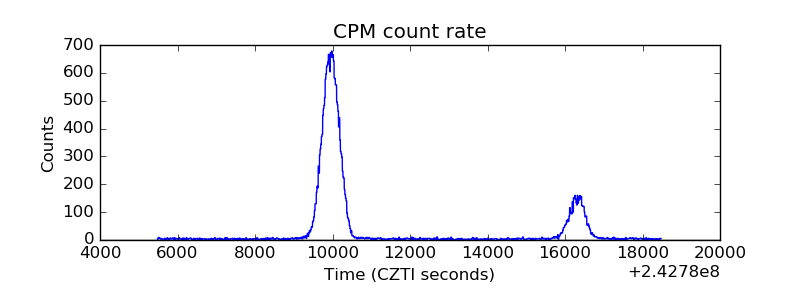 |
| CZT Counter | 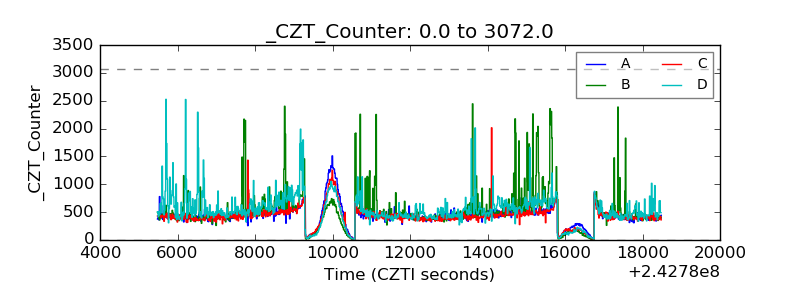 |
| +2.5 Volts monitor |  |
| +5 Volts monitor |  |
| _ROLL_ROT | 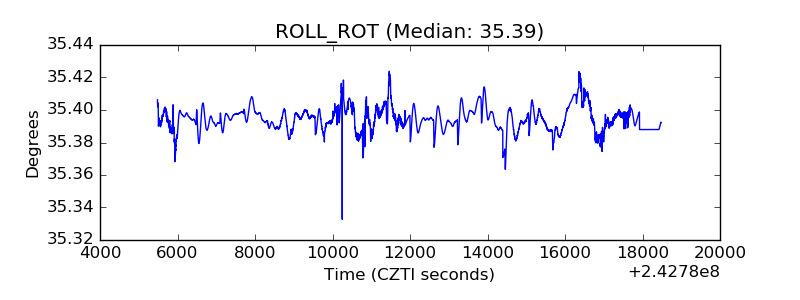 |
| _Roll_DEC | 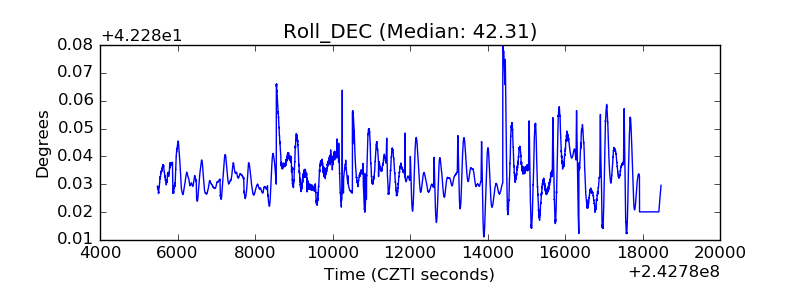 |
| _Roll_RA |  |
| Veto Counter | 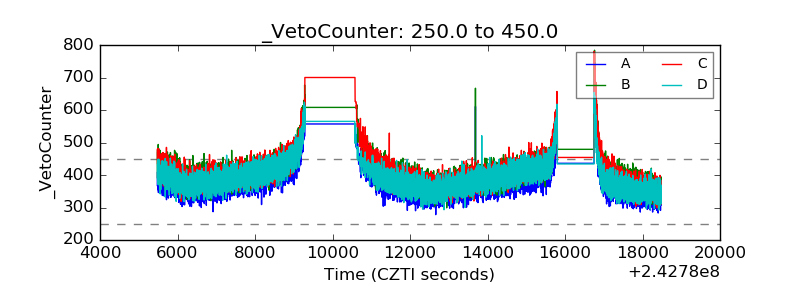 |