| Param | Original file | Final file |
|---|---|---|
| Filename | modeM0/AS1G07_004T01_9000001532_10570cztM0_level2.evt | modeM0/AS1G07_004T01_9000001532_10570cztM0_level2_quad_clean.evt |
| Size (bytes) | 863,663,040 | 151,611,840 |
| Size | 823.7 MB | 144.6 MB |
| Events in quadrant A | 5,574,144 | 924,601 |
| Events in quadrant B | 7,038,700 | 945,511 |
| Events in quadrant C | 5,494,918 | 965,322 |
| Events in quadrant D | 7,219,952 | 910,264 |
| Mode M0 | |||
|---|---|---|---|
| Quadrant | BADHDUFLAG | Total packets | Discarded packets |
| A | 0 | 26116 | 996 |
| B | 0 | 30431 | 1067 |
| C | 0 | 26225 | 1045 |
| D | 0 | 30910 | 1075 |
| Mode SS | |||
|---|---|---|---|
| Quadrant | BADHDUFLAG | Total packets | Discarded packets |
| A | 0 | 258 | 10 |
| B | 0 | 258 | 4 |
| C | 0 | 258 | 8 |
| D | 0 | 258 | 12 |
| Mode M9 | |||
|---|---|---|---|
| Quadrant | BADHDUFLAG | Total packets | Discarded packets |
| A | 0 | 5 | 0 |
| B | 0 | 5 | 0 |
| C | 0 | 5 | 0 |
| D | 0 | 5 | 0 |
| Quadrant | Total seconds | Saturated seconds | Saturation percentage |
|---|---|---|---|
| A | 12233 | 248 | 2.027303% |
| B | 12231 | 499 | 4.079797% |
| C | 12212 | 109 | 0.892565% |
| D | 12207 | 175 | 1.433604% |
Noise dominated data is calculated using 1-second bins in cleaned event files. If a bin has >2000 counts, and if more than 50% of those come from <1% of pixels, then it is considered to be noise-dominated and hence unusable.
| Quadrant | # 1 sec bins | Bins with >0 counts | Bins with >2000 counts | High rate bins dominated by noise | Noise dominated (total time) | Noise dominated (detector-on time) | Marked lightcurve |
|---|---|---|---|---|---|---|---|
| A | 13200 | 12572 | 0 | 0 | 0.00% | 0.00% |  |
| B | 13200 | 12546 | 126 | 126 | 0.95% | 1.00% |  |
| C | 13200 | 12568 | 5 | 5 | 0.04% | 0.04% |  |
| D | 13200 | 12560 | 16 | 16 | 0.12% | 0.13% |  |
Top three noisy pixels from each quadrant. If the there are fewer than three noisy pixels in the level2.evt file, extra rows are filled as -1
| Pixel properties | Quadrant properties | ||||||
|---|---|---|---|---|---|---|---|
| Quadrant | DetID | PixID | Counts | Sigma | Mean | Median | Sigma |
| A | 13 | 251 | 57352 | 193.2 | 1421 | 1388 | 289.7 |
| A | 1 | 162 | 25629 | 83.68 | 1421 | 1388 | 289.7 |
| A | 0 | 226 | 12827 | 39.49 | 1421 | 1388 | 289.7 |
| B | 4 | 239 | 1372873 | 5018.14 | 1417 | 1378 | 273.3 |
| B | 0 | 214 | 42178 | 149.28 | 1417 | 1378 | 273.3 |
| B | 11 | 51 | 36300 | 127.78 | 1417 | 1378 | 273.3 |
| C | 14 | 234 | 77353 | 235.53 | 1387 | 1389 | 322.5 |
| C | 13 | 61 | 10303 | 27.64 | 1387 | 1389 | 322.5 |
| C | 8 | 128 | 5005 | 11.21 | 1387 | 1389 | 322.5 |
| D | 2 | 16 | 1265601 | 3823.73 | 1377 | 1338 | 330.6 |
| D | 8 | 195 | 521177 | 1572.24 | 1377 | 1338 | 330.6 |
| D | 13 | 104 | 71662 | 212.69 | 1377 | 1338 | 330.6 |
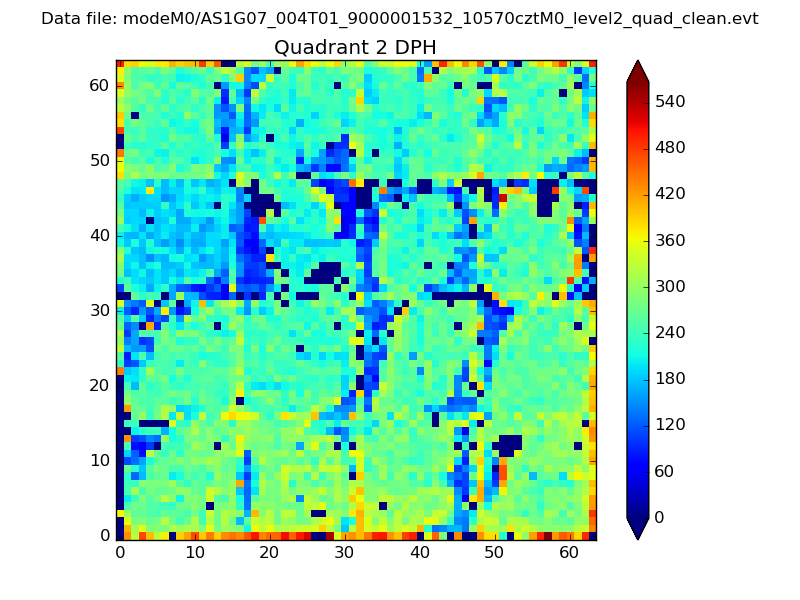
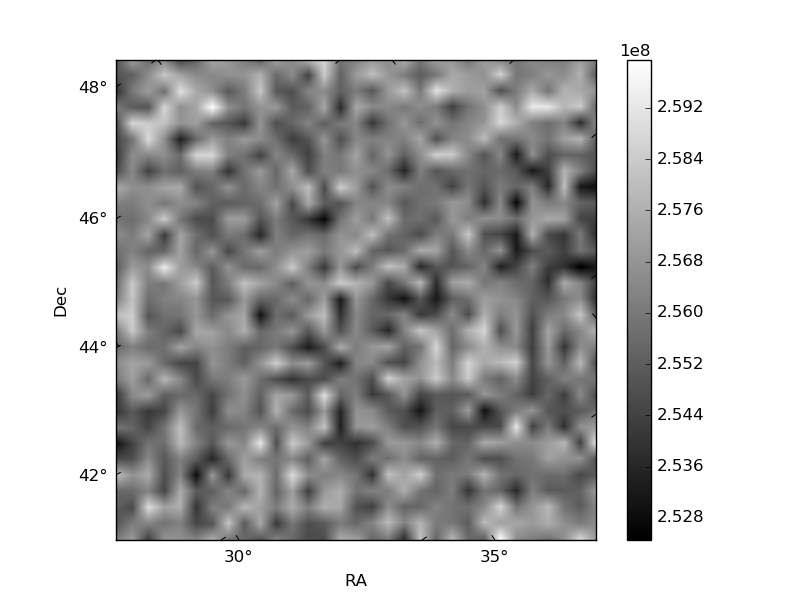
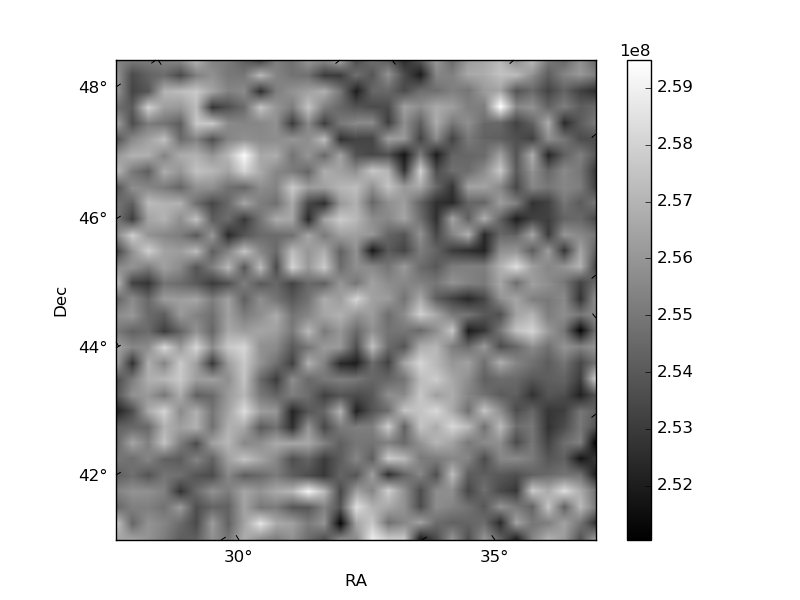
Histogram calculated using DETX and DETY for each event in the final _common_clean file
| Quadrant A | 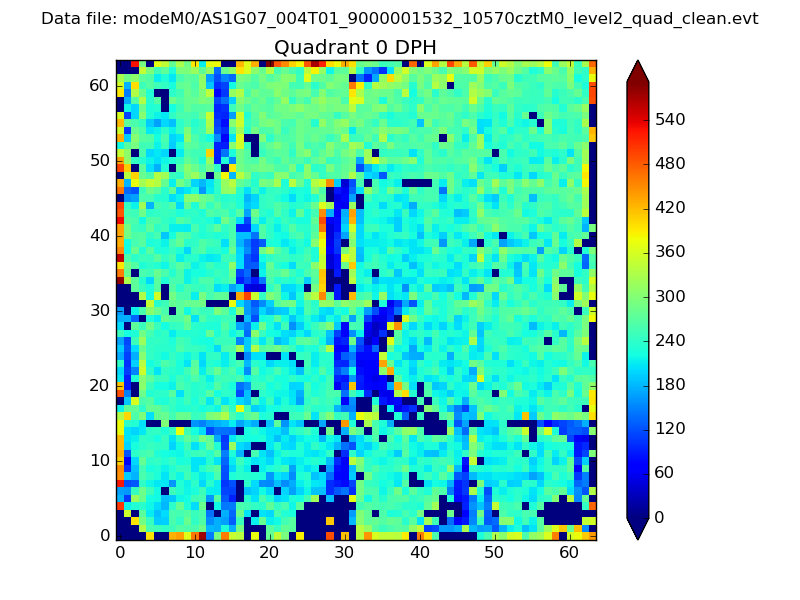 |
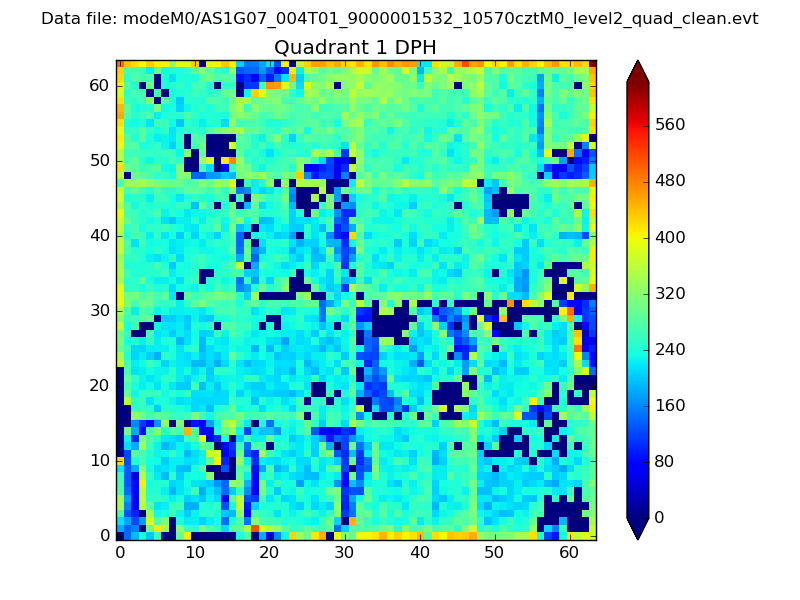 |
Quadrant B |
|---|---|---|---|
| Quadrant D | 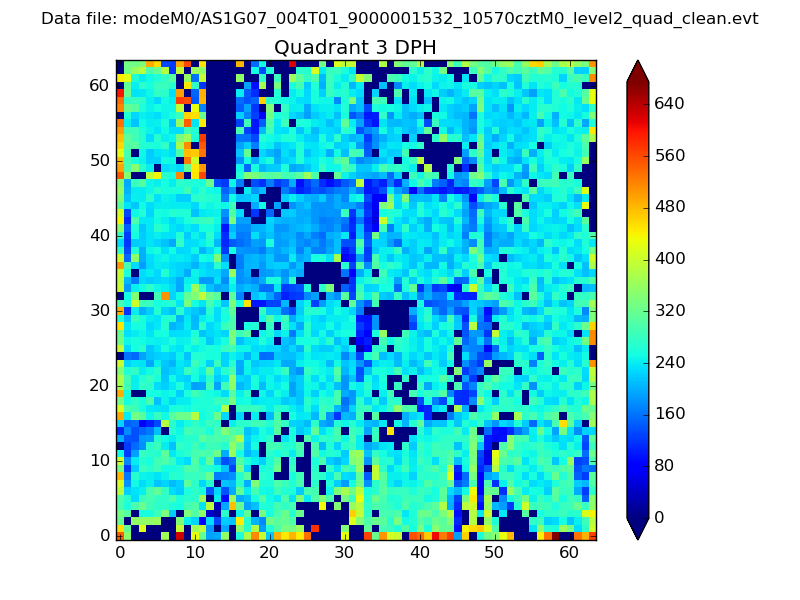 |
 |
Quadrant C |
| Plot type | Count rate plots | Images |
|---|---|---|
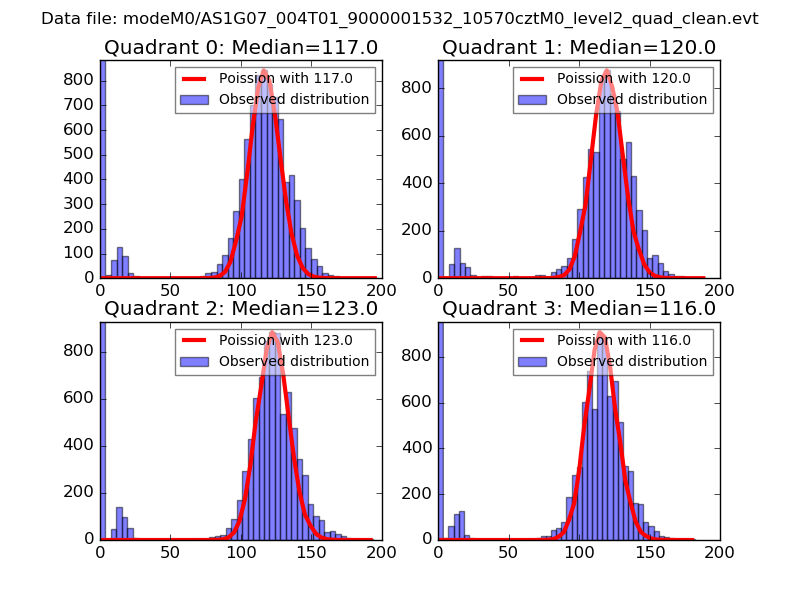
| Comparison with Poisson distribution Blue bars denote a histogram of data divided into 1 sec bins. Red curve is a Poisson curve with rate = median count rate of data. |
 |
 |
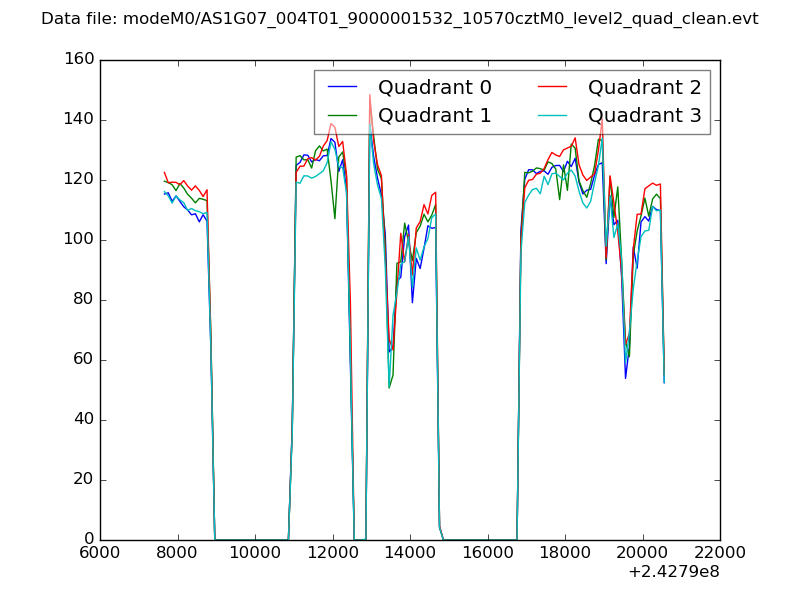
| Quadrant-wise count rates Data is divided into 100 sec bins |
 |
|
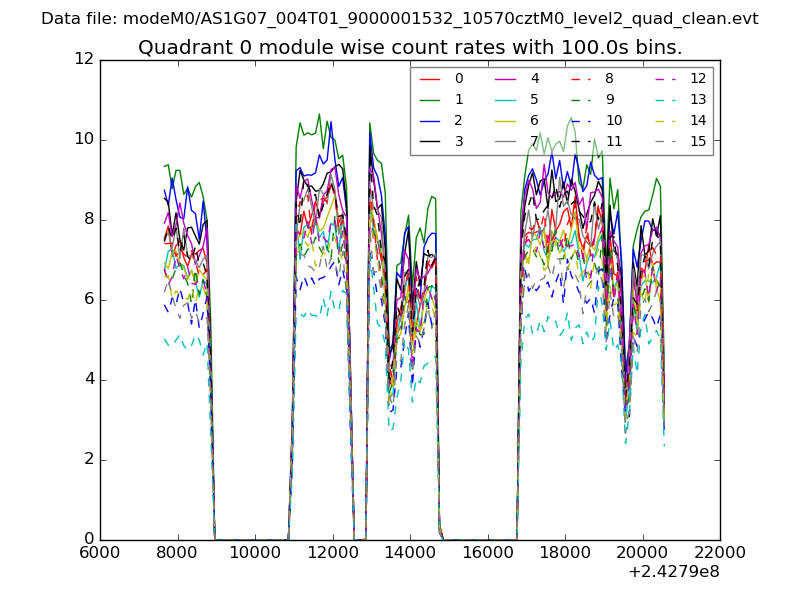
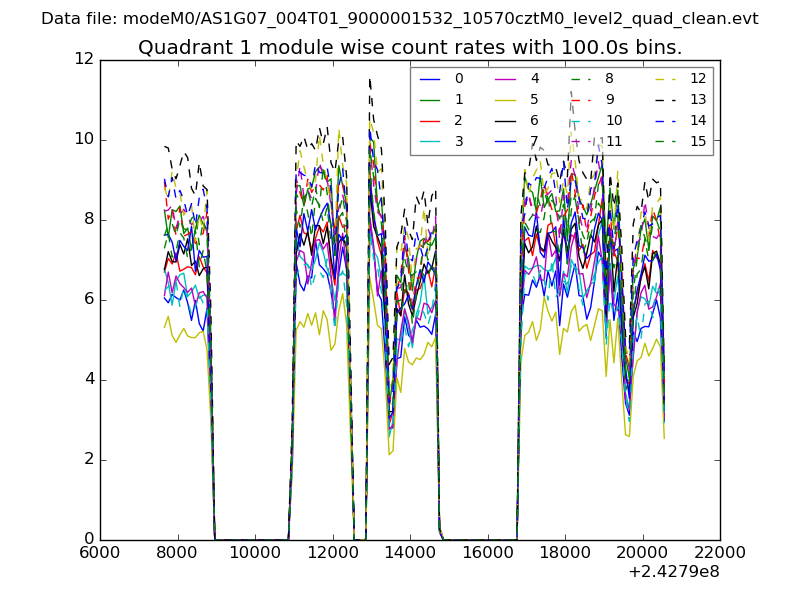
| Module-wise count rates for Quadrant A Data is divided into 100 sec bins |
 |
 |
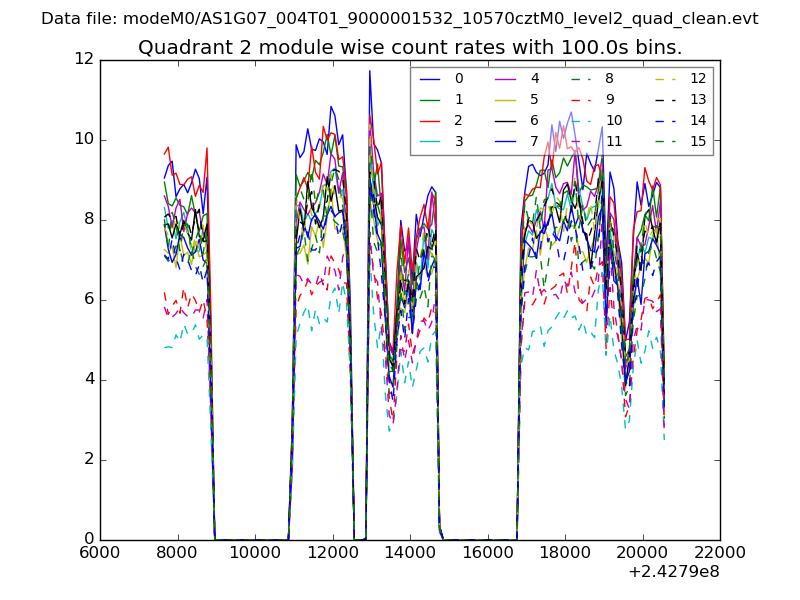
| Module-wise count rates for Quadrant B Data is divided into 100 sec bins |
 |
 |
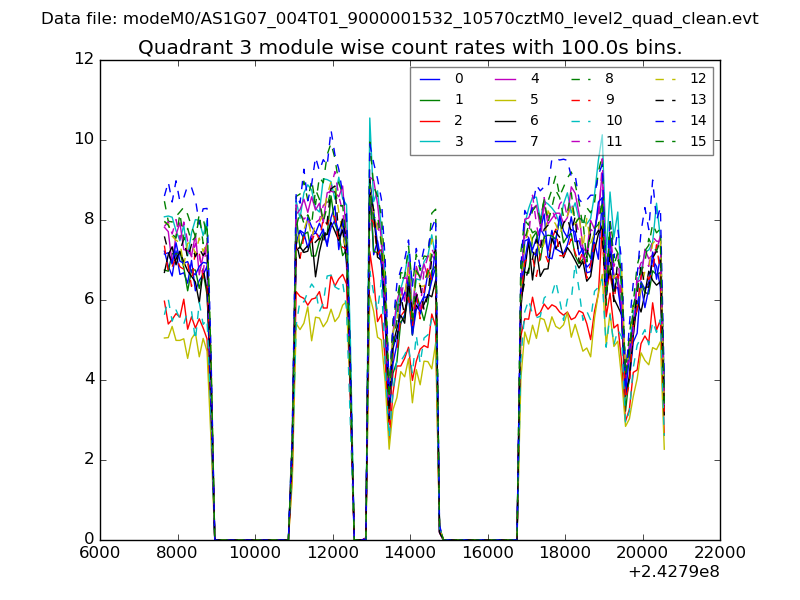
| Module-wise count rates for Quadrant C Data is divided into 100 sec bins |
 |
 |
| Module-wise count rates for Quadrant D Data is divided into 100 sec bins |
 |
 |
| Parameter | Plot |
|---|---|
| CZT HV Monitor | 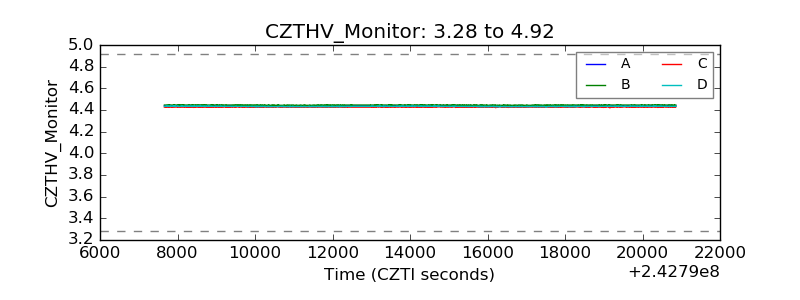 |
| D_VDD | 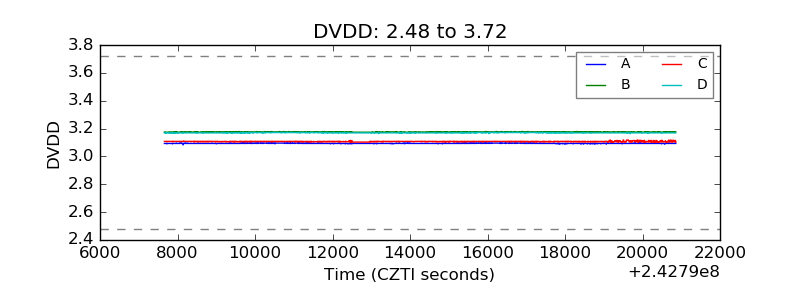 |
| Temperature 1 | 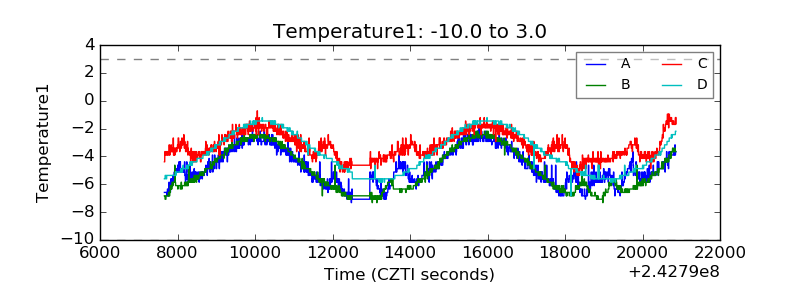 |
| Veto HV Monitor | 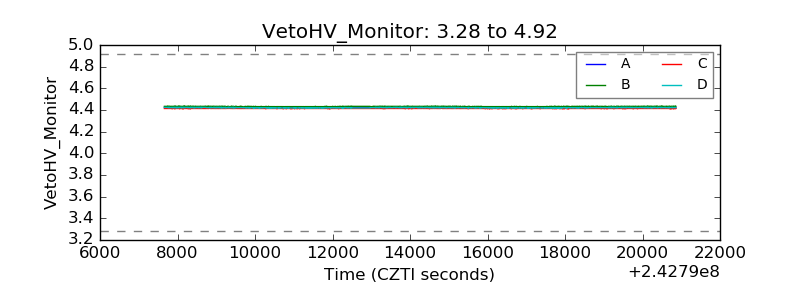 |
| Veto LLD | 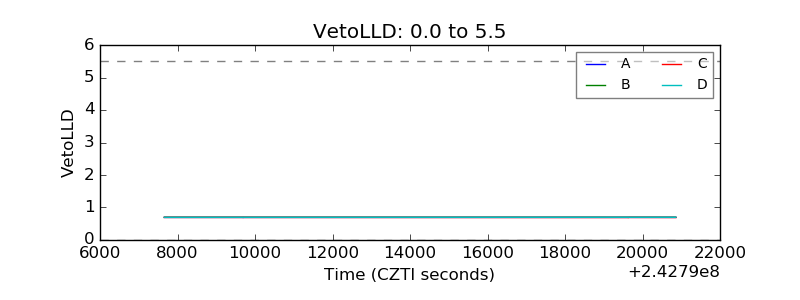 |
| Alpha Counter | 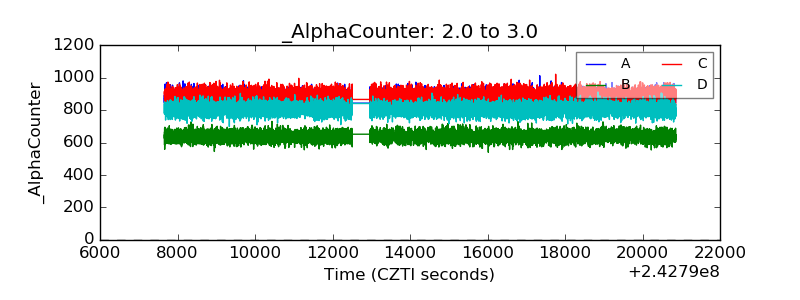 |
| _CPM_Rate | 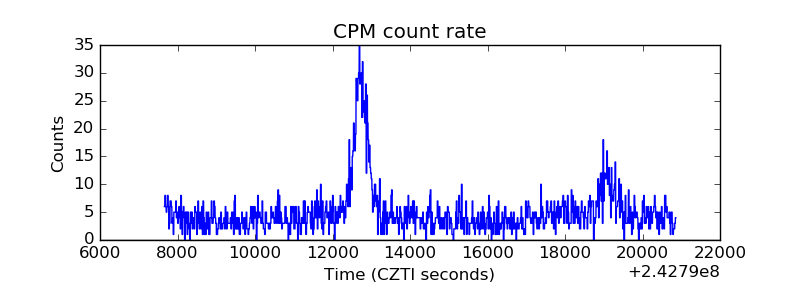 |
| CZT Counter | 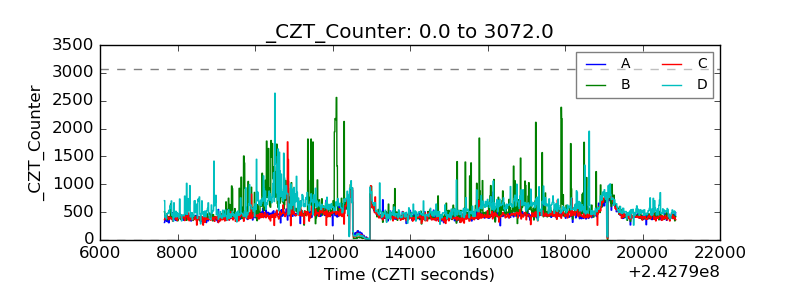 |
| +2.5 Volts monitor |  |
| +5 Volts monitor |  |
| _ROLL_ROT | 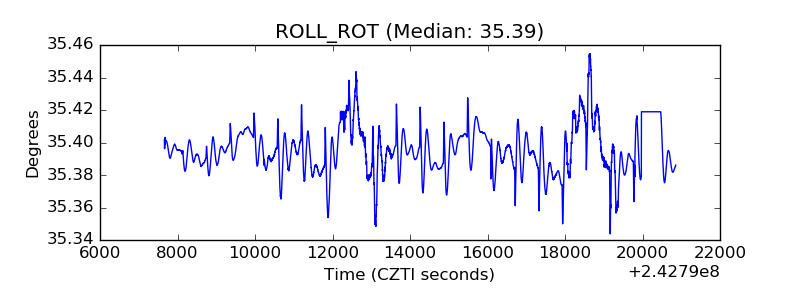 |
| _Roll_DEC | 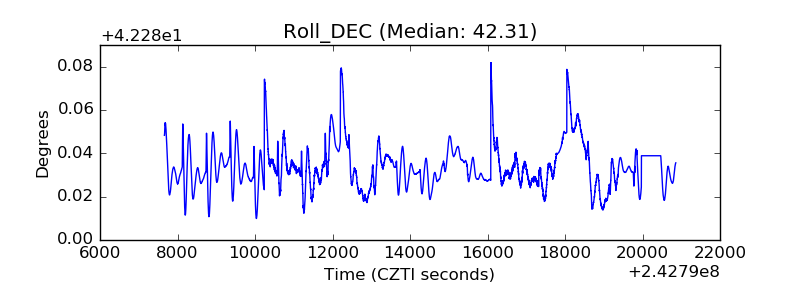 |
| _Roll_RA | 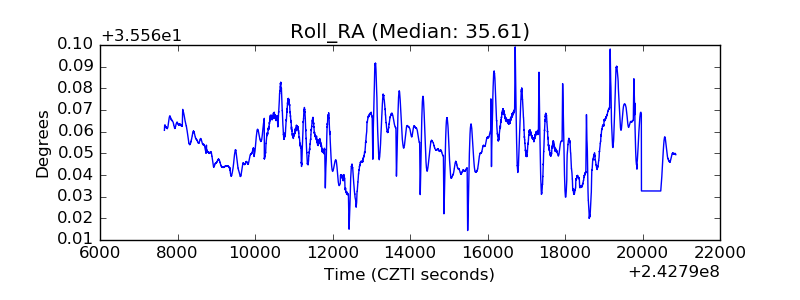 |
| Veto Counter | 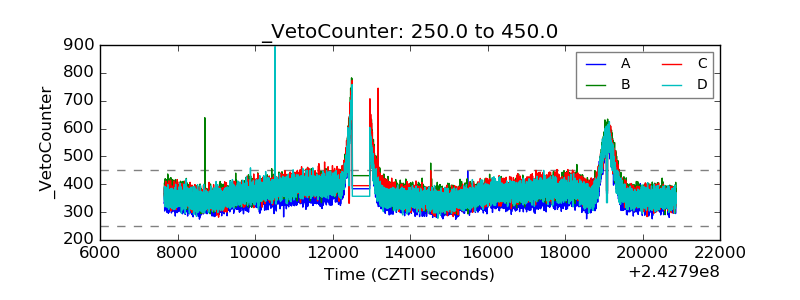 |