| Param | Original file | Final file |
|---|---|---|
| Filename | modeM0/AS1G07_004T01_9000001532_10571cztM0_level2.evt | modeM0/AS1G07_004T01_9000001532_10571cztM0_level2_quad_clean.evt |
| Size (bytes) | 616,092,480 | 104,400,000 |
| Size | 587.6 MB | 99.6 MB |
| Events in quadrant A | 3,850,687 | 638,919 |
| Events in quadrant B | 5,470,172 | 653,974 |
| Events in quadrant C | 3,785,731 | 668,987 |
| Events in quadrant D | 4,993,828 | 628,173 |
| Mode M0 | |||
|---|---|---|---|
| Quadrant | BADHDUFLAG | Total packets | Discarded packets |
| A | 0 | 17262 | 3 |
| B | 0 | 21857 | 2 |
| C | 0 | 17170 | 2 |
| D | 0 | 20248 | 2 |
| Mode SS | |||
|---|---|---|---|
| Quadrant | BADHDUFLAG | Total packets | Discarded packets |
| A | 0 | 168 | 0 |
| B | 0 | 168 | 0 |
| C | 0 | 168 | 0 |
| D | 0 | 168 | 0 |
| Mode M9 | |||
|---|---|---|---|
| Quadrant | BADHDUFLAG | Total packets | Discarded packets |
| A | 0 | 2 | 0 |
| B | 0 | 2 | 0 |
| C | 0 | 2 | 0 |
| D | 0 | 2 | 0 |
| Quadrant | Total seconds | Saturated seconds | Saturation percentage |
|---|---|---|---|
| A | 8221 | 371 | 4.512833% |
| B | 8221 | 857 | 10.424523% |
| C | 8221 | 223 | 2.712565% |
| D | 8221 | 282 | 3.430240% |
Noise dominated data is calculated using 1-second bins in cleaned event files. If a bin has >2000 counts, and if more than 50% of those come from <1% of pixels, then it is considered to be noise-dominated and hence unusable.
| Quadrant | # 1 sec bins | Bins with >0 counts | Bins with >2000 counts | High rate bins dominated by noise | Noise dominated (total time) | Noise dominated (detector-on time) | Marked lightcurve |
|---|---|---|---|---|---|---|---|
| A | 8311 | 8223 | 0 | 0 | 0.00% | 0.00% | 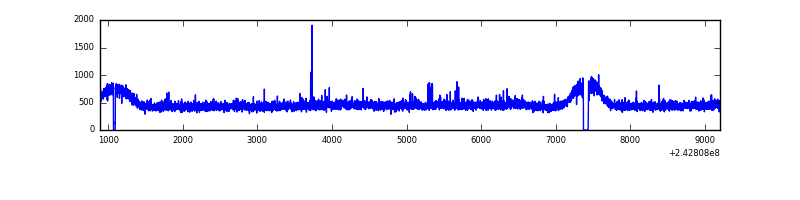 |
| B | 8311 | 8223 | 355 | 355 | 4.27% | 4.32% | 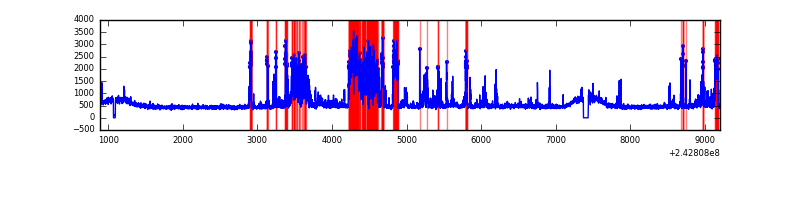 |
| C | 8311 | 8223 | 0 | 0 | 0.00% | 0.00% | 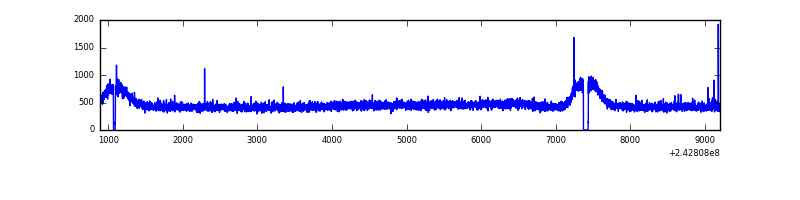 |
| D | 8311 | 8223 | 43 | 43 | 0.52% | 0.52% | 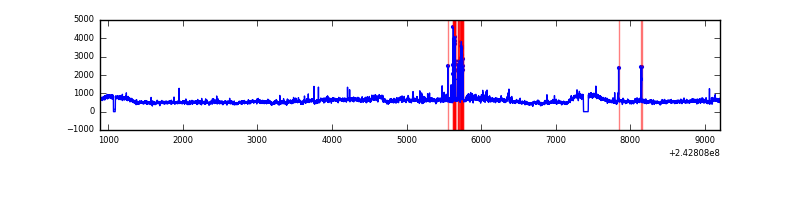 |
Top three noisy pixels from each quadrant. If the there are fewer than three noisy pixels in the level2.evt file, extra rows are filled as -1
| Pixel properties | Quadrant properties | ||||||
|---|---|---|---|---|---|---|---|
| Quadrant | DetID | PixID | Counts | Sigma | Mean | Median | Sigma |
| A | 13 | 251 | 52942 | 255.91 | 980 | 953 | 203.2 |
| A | 1 | 162 | 11840 | 53.59 | 980 | 953 | 203.2 |
| A | 15 | 174 | 10257 | 45.8 | 980 | 953 | 203.2 |
| B | 4 | 239 | 1612181 | 8650.46 | 963 | 937 | 186.3 |
| B | 11 | 51 | 30377 | 158.05 | 963 | 937 | 186.3 |
| B | 0 | 219 | 24597 | 127.02 | 963 | 937 | 186.3 |
| C | 8 | 128 | 12329 | 51.16 | 960 | 962 | 222.2 |
| C | 14 | 234 | 10539 | 43.11 | 960 | 962 | 222.2 |
| C | 4 | 175 | 8485 | 33.86 | 960 | 962 | 222.2 |
| D | 2 | 16 | 664475 | 2891.48 | 951 | 919 | 229.5 |
| D | 8 | 195 | 481878 | 2095.81 | 951 | 919 | 229.5 |
| D | 13 | 105 | 144919 | 627.49 | 951 | 919 | 229.5 |
Histogram calculated using DETX and DETY for each event in the final _common_clean file
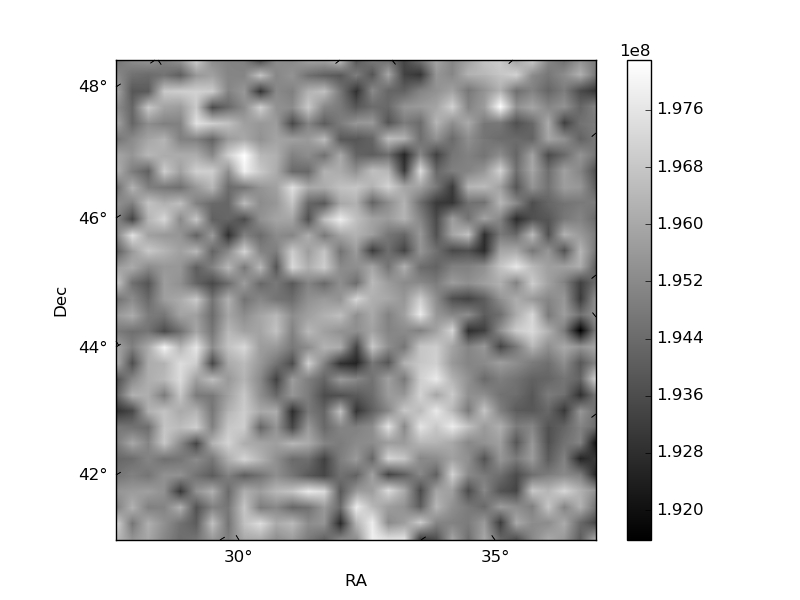
| Quadrant A | 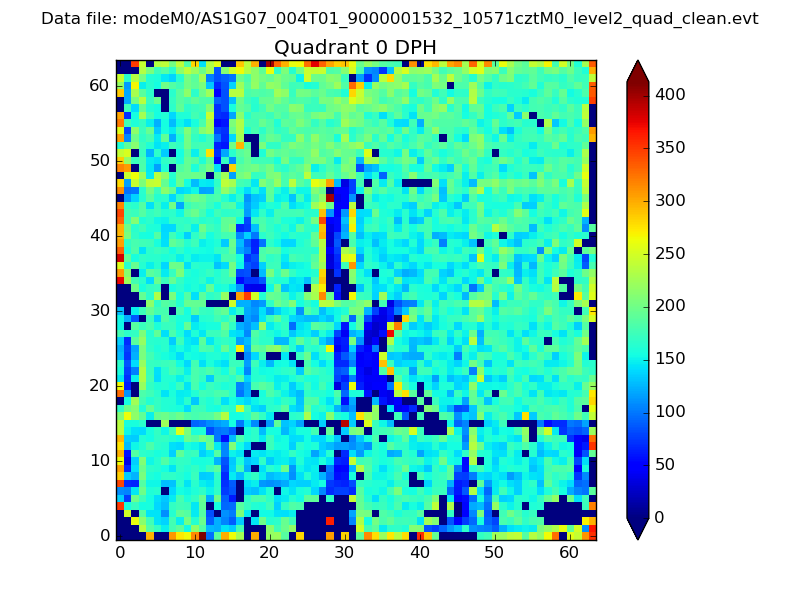 |
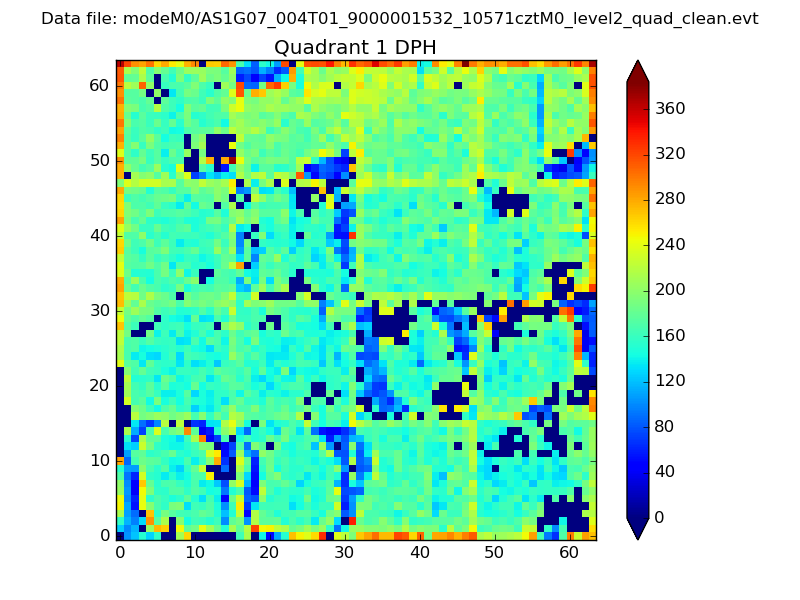 |
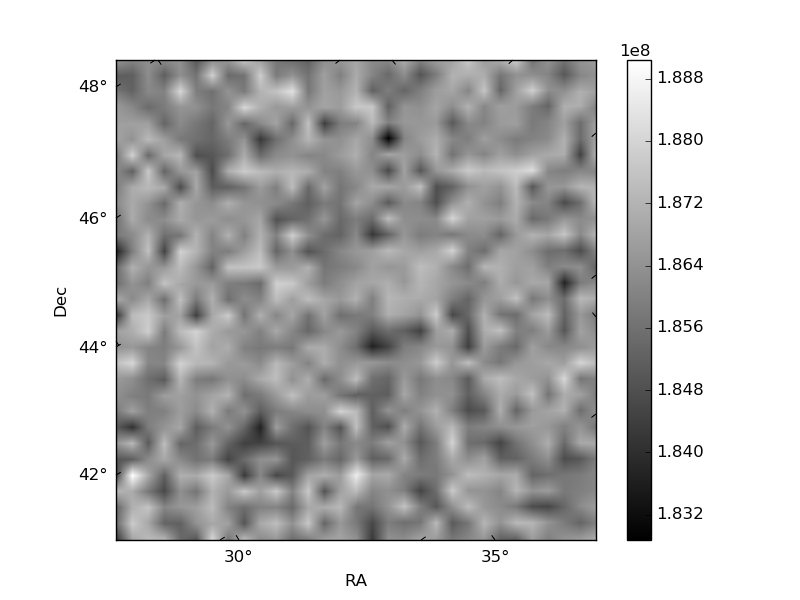
Quadrant B |
|---|---|---|---|
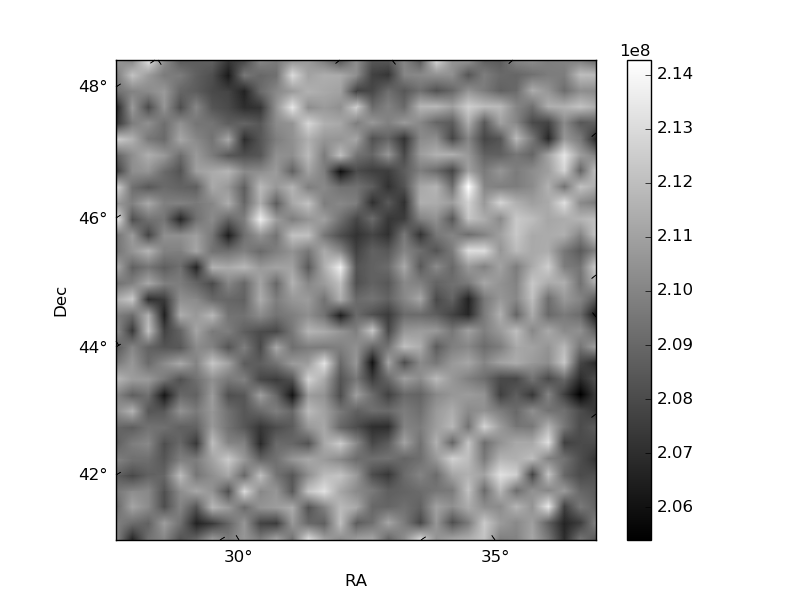
| Quadrant D | 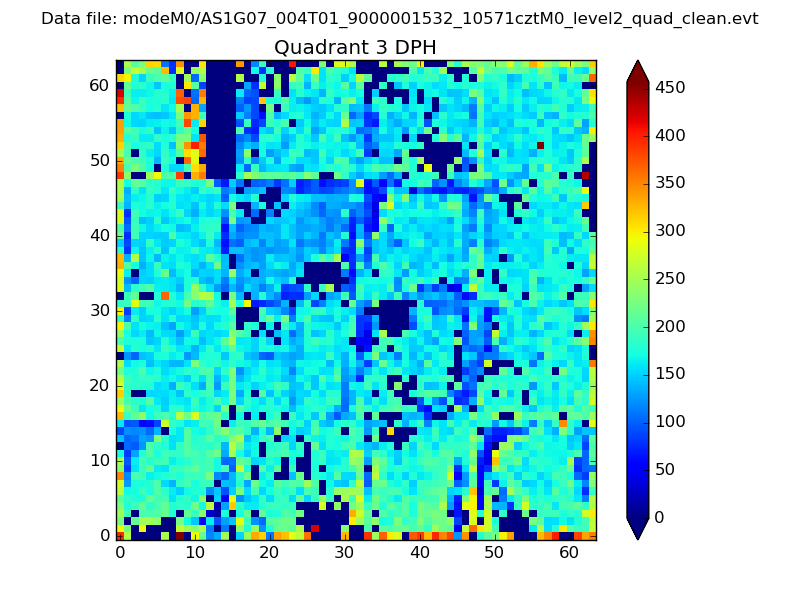 |
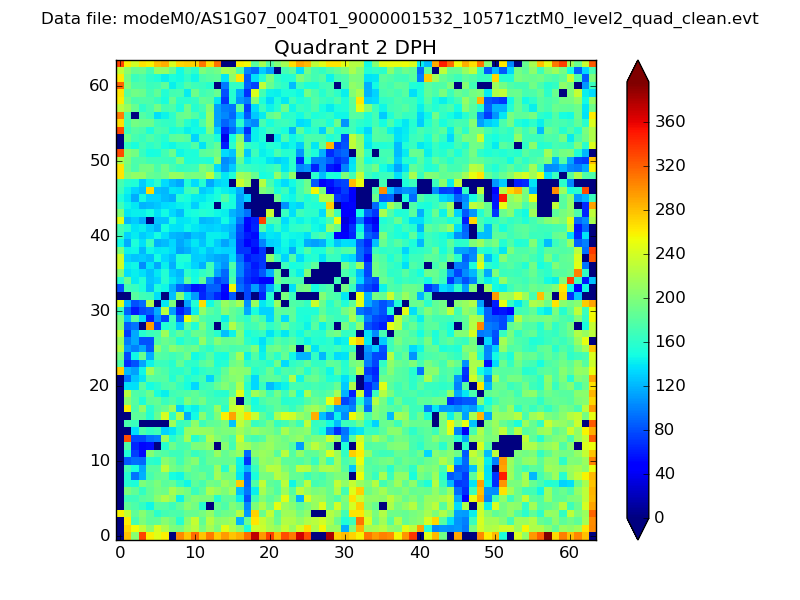 |
Quadrant C |
| Plot type | Count rate plots | Images |
|---|---|---|
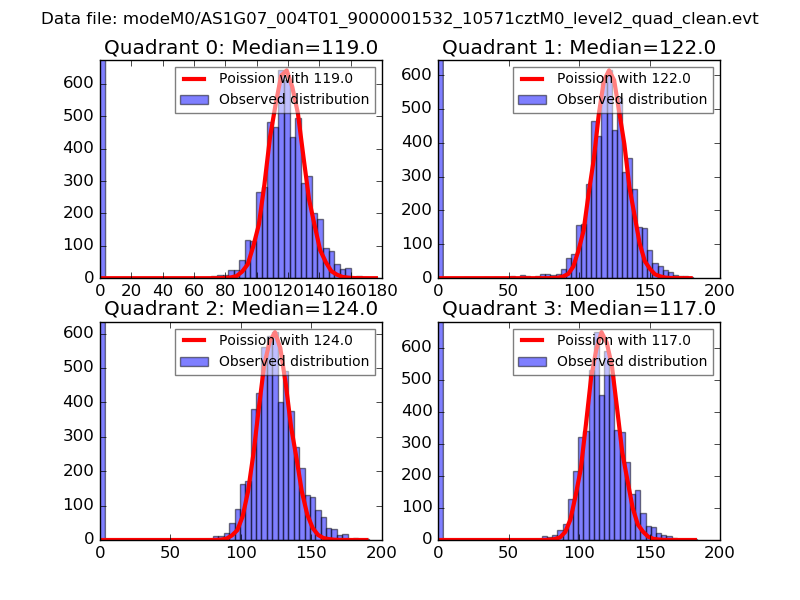
| Comparison with Poisson distribution Blue bars denote a histogram of data divided into 1 sec bins. Red curve is a Poisson curve with rate = median count rate of data. |
 |
 |
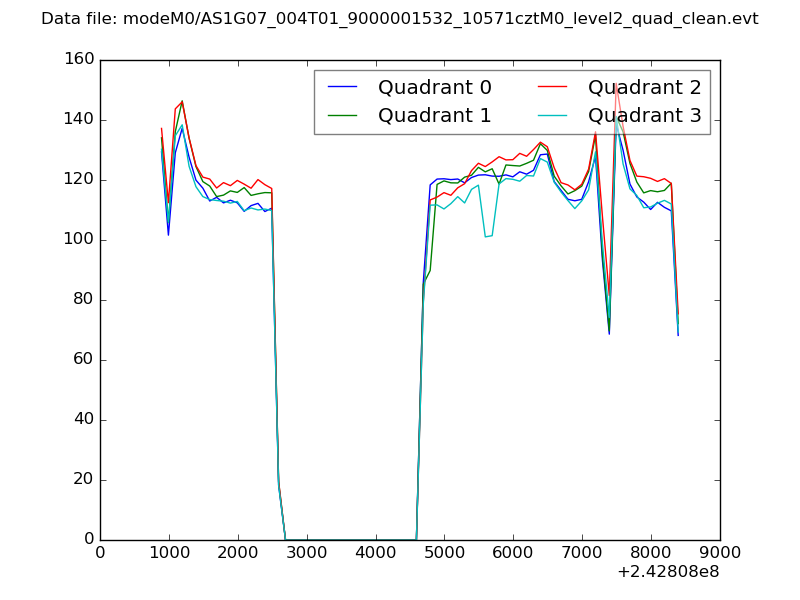
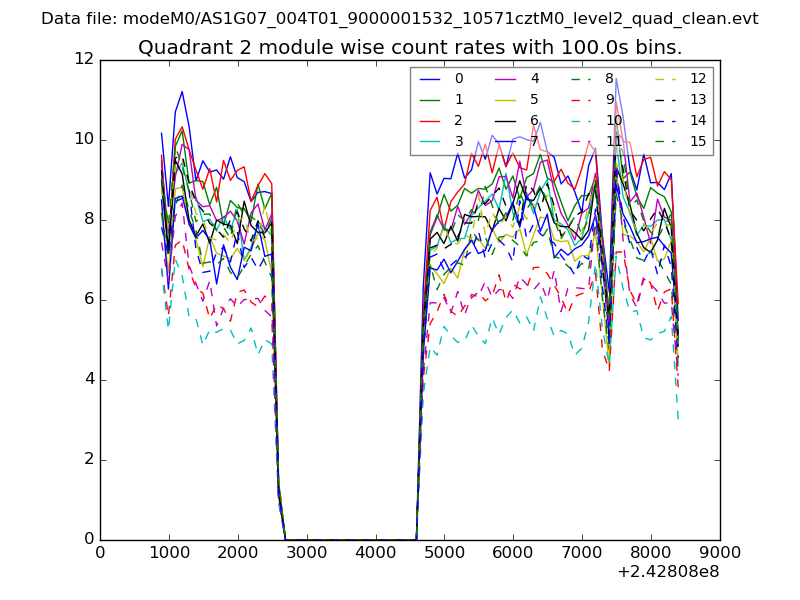
| Quadrant-wise count rates Data is divided into 100 sec bins |
 |
|
| Module-wise count rates for Quadrant A Data is divided into 100 sec bins |
 |
 |
| Module-wise count rates for Quadrant B Data is divided into 100 sec bins |
 |
 |
| Module-wise count rates for Quadrant C Data is divided into 100 sec bins |
 |
 |
| Module-wise count rates for Quadrant D Data is divided into 100 sec bins |
 |
 |
| Parameter | Plot |
|---|---|
| CZT HV Monitor | 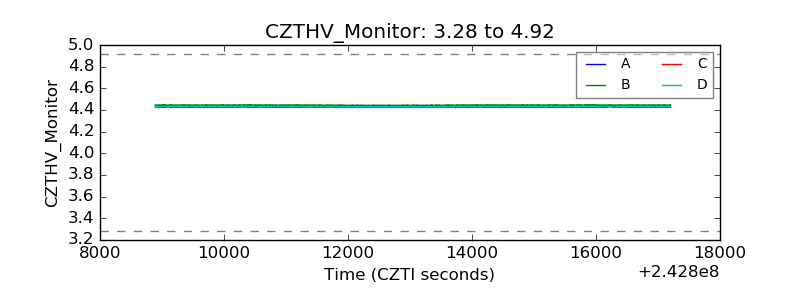 |
| D_VDD |  |
| Temperature 1 | 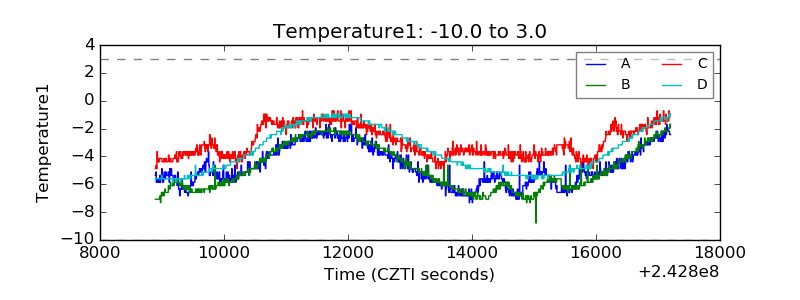 |
| Veto HV Monitor | 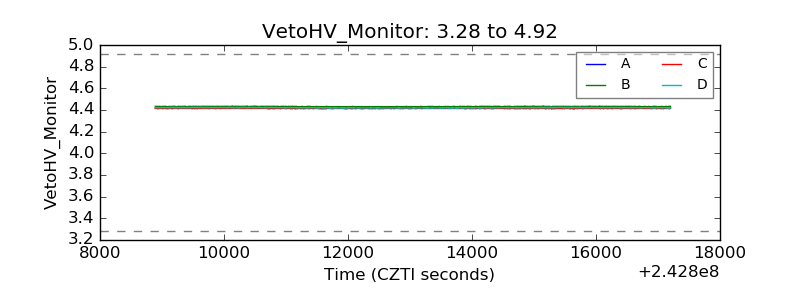 |
| Veto LLD |  |
| Alpha Counter | 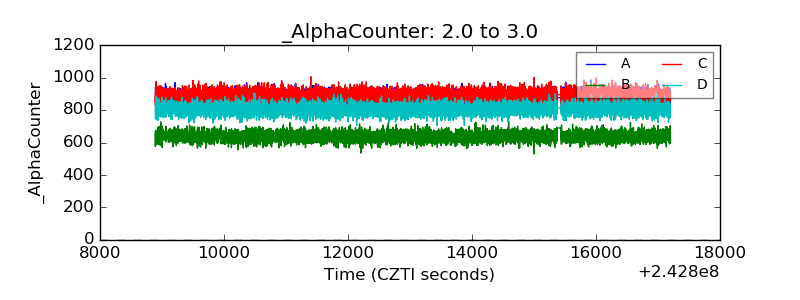 |
| _CPM_Rate | 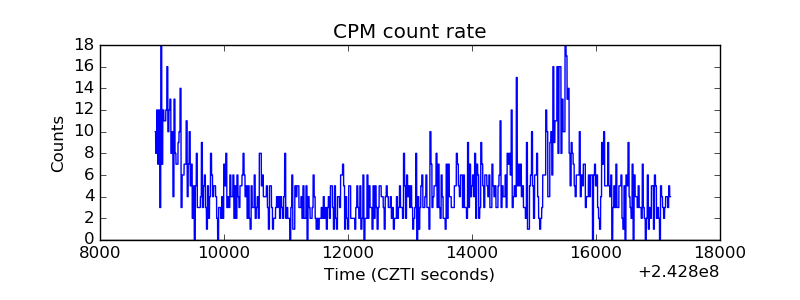 |
| CZT Counter | 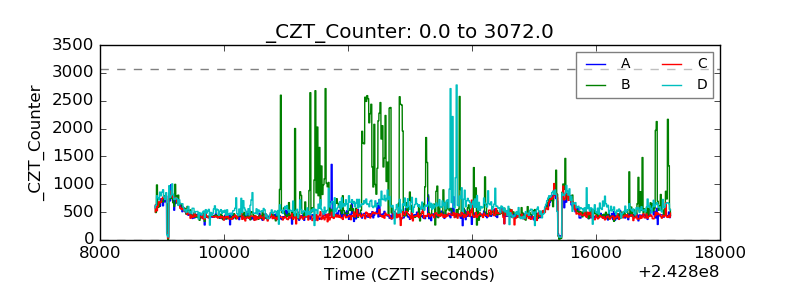 |
| +2.5 Volts monitor |  |
| +5 Volts monitor |  |
| _ROLL_ROT |  |
| _Roll_DEC | 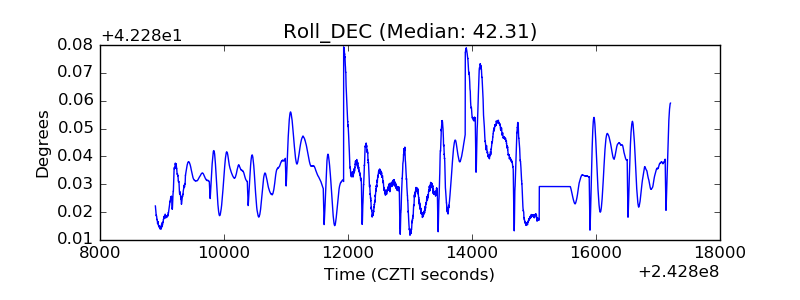 |
| _Roll_RA | 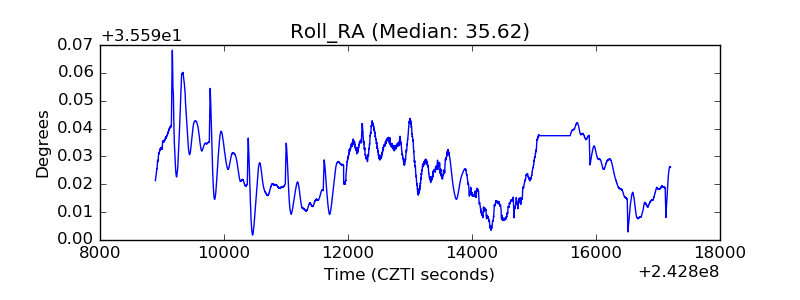 |
| Veto Counter | 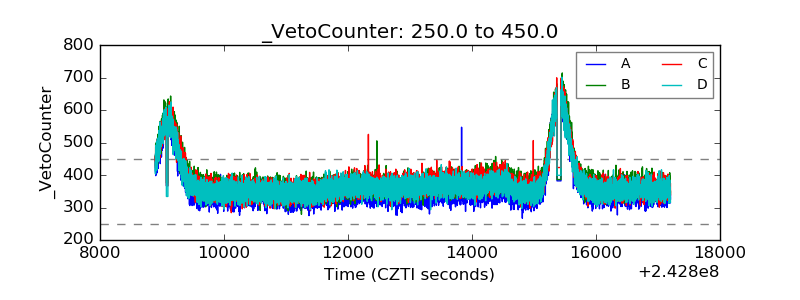 |