| Param | Original file | Final file |
|---|---|---|
| Filename | modeM0/AS1G07_004T01_9000001532_10574cztM0_level2.evt | modeM0/AS1G07_004T01_9000001532_10574cztM0_level2_quad_clean.evt |
| Size (bytes) | 1,164,375,360 | 176,221,440 |
| Size | 1.1 GB | 168.1 MB |
| Events in quadrant A | 7,055,616 | 1,073,178 |
| Events in quadrant B | 10,977,337 | 1,055,676 |
| Events in quadrant C | 6,794,149 | 1,103,434 |
| Events in quadrant D | 9,394,079 | 1,040,118 |
| Mode M0 | |||
|---|---|---|---|
| Quadrant | BADHDUFLAG | Total packets | Discarded packets |
| A | 0 | 31601 | 2 |
| B | 0 | 42874 | 2 |
| C | 0 | 31284 | 2 |
| D | 0 | 38208 | 2 |
| Mode SS | |||
|---|---|---|---|
| Quadrant | BADHDUFLAG | Total packets | Discarded packets |
| A | 0 | 314 | 0 |
| B | 0 | 314 | 0 |
| C | 0 | 314 | 0 |
| D | 0 | 314 | 0 |
| Mode M9 | |||
|---|---|---|---|
| Quadrant | BADHDUFLAG | Total packets | Discarded packets |
| A | 0 | 10 | 0 |
| B | 0 | 10 | 0 |
| C | 0 | 10 | 0 |
| D | 0 | 10 | 0 |
| Quadrant | Total seconds | Saturated seconds | Saturation percentage |
|---|---|---|---|
| A | 15415 | 146 | 0.947129% |
| B | 15415 | 1141 | 7.401881% |
| C | 15415 | 98 | 0.635744% |
| D | 15415 | 156 | 1.012001% |
Noise dominated data is calculated using 1-second bins in cleaned event files. If a bin has >2000 counts, and if more than 50% of those come from <1% of pixels, then it is considered to be noise-dominated and hence unusable.
| Quadrant | # 1 sec bins | Bins with >0 counts | Bins with >2000 counts | High rate bins dominated by noise | Noise dominated (total time) | Noise dominated (detector-on time) | Marked lightcurve |
|---|---|---|---|---|---|---|---|
| A | 16425 | 15417 | 15 | 15 | 0.09% | 0.10% | 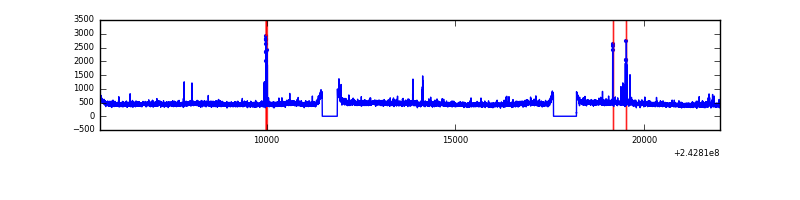 |
| B | 16425 | 15417 | 819 | 819 | 4.99% | 5.31% | 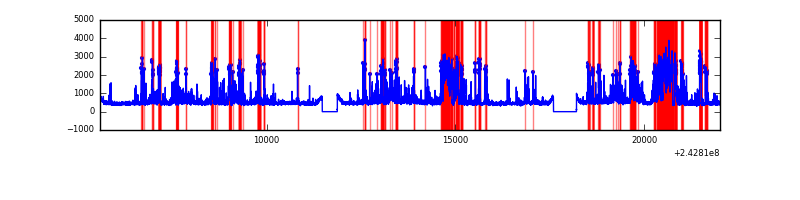 |
| C | 16425 | 15417 | 2 | 2 | 0.01% | 0.01% | 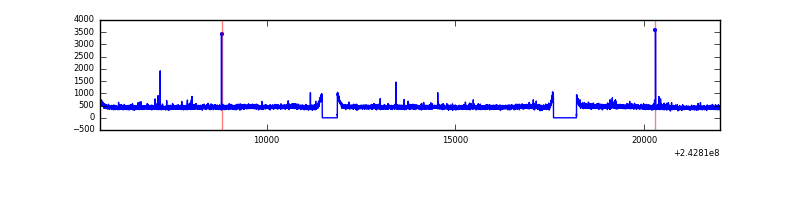 |
| D | 16425 | 15417 | 46 | 46 | 0.28% | 0.30% | 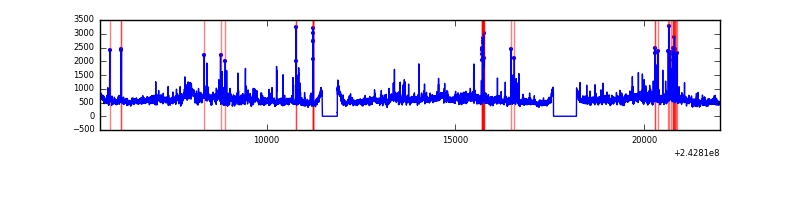 |
Top three noisy pixels from each quadrant. If the there are fewer than three noisy pixels in the level2.evt file, extra rows are filled as -1
| Pixel properties | Quadrant properties | ||||||
|---|---|---|---|---|---|---|---|
| Quadrant | DetID | PixID | Counts | Sigma | Mean | Median | Sigma |
| A | 13 | 251 | 208969 | 576.1 | 1764 | 1721 | 359.7 |
| A | 1 | 162 | 29396 | 76.93 | 1764 | 1721 | 359.7 |
| A | 0 | 226 | 16255 | 40.4 | 1764 | 1721 | 359.7 |
| B | 4 | 239 | 3782071 | 11418.57 | 1739 | 1696 | 331.1 |
| B | 11 | 51 | 196420 | 588.16 | 1739 | 1696 | 331.1 |
| B | 0 | 214 | 97372 | 288.99 | 1739 | 1696 | 331.1 |
| C | 14 | 234 | 28287 | 66.06 | 1729 | 1738 | 401.9 |
| C | 4 | 175 | 12774 | 27.46 | 1729 | 1738 | 401.9 |
| C | 13 | 61 | 12656 | 27.17 | 1729 | 1738 | 401.9 |
| D | 2 | 16 | 1725002 | 4180.33 | 1715 | 1665 | 412.2 |
| D | 8 | 195 | 463275 | 1119.74 | 1715 | 1665 | 412.2 |
| D | 1 | 52 | 258588 | 623.22 | 1715 | 1665 | 412.2 |
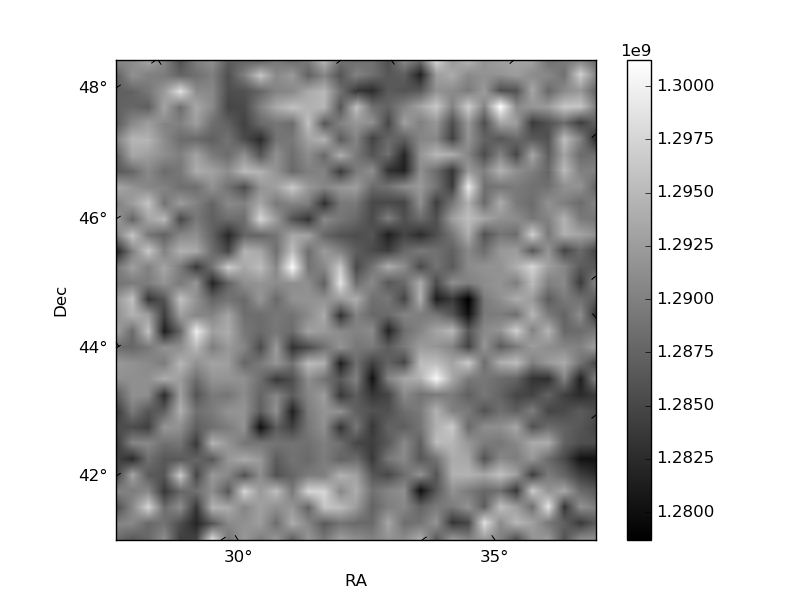
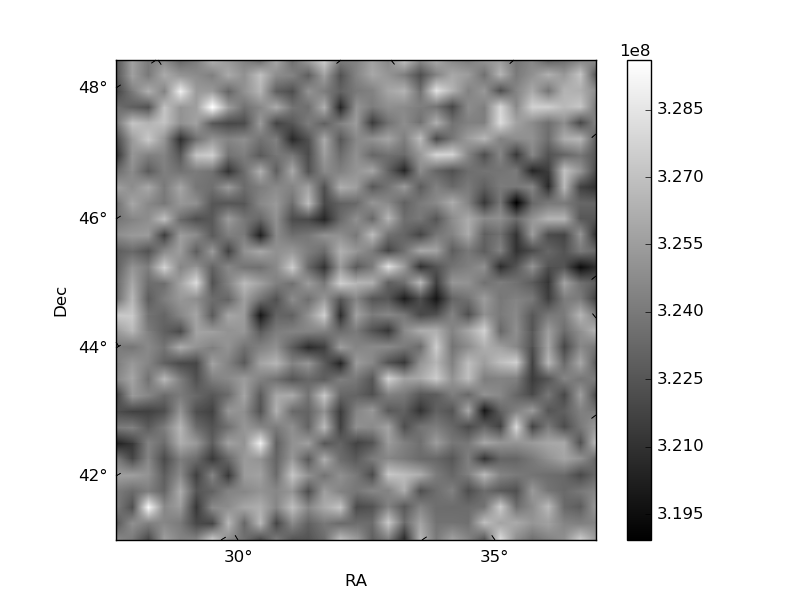
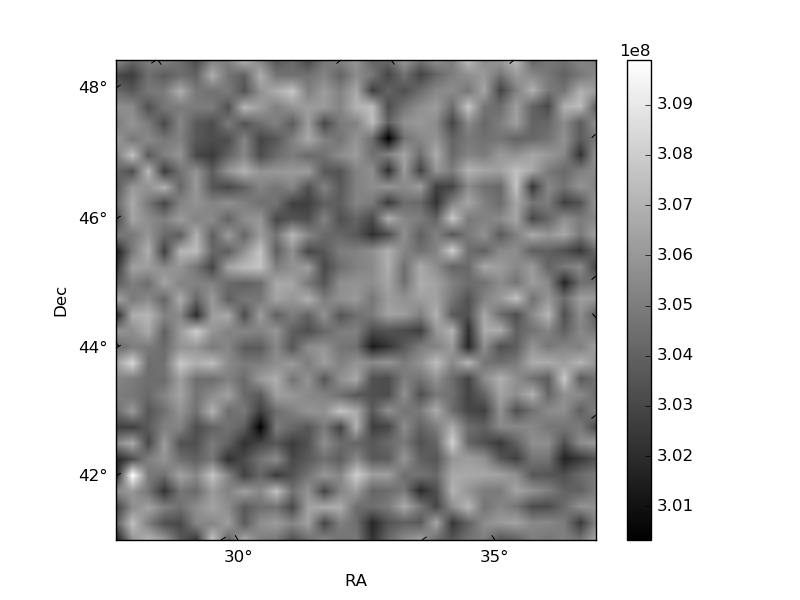
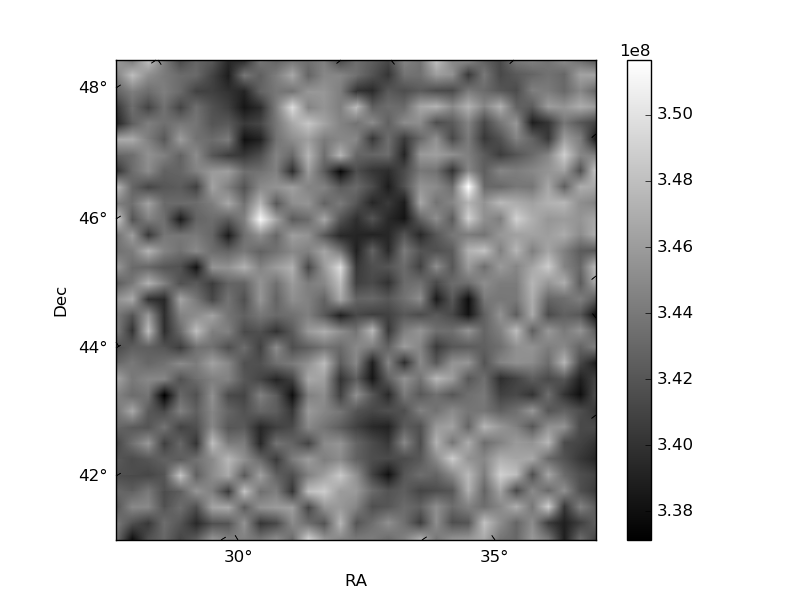
Histogram calculated using DETX and DETY for each event in the final _common_clean file
| Quadrant A | 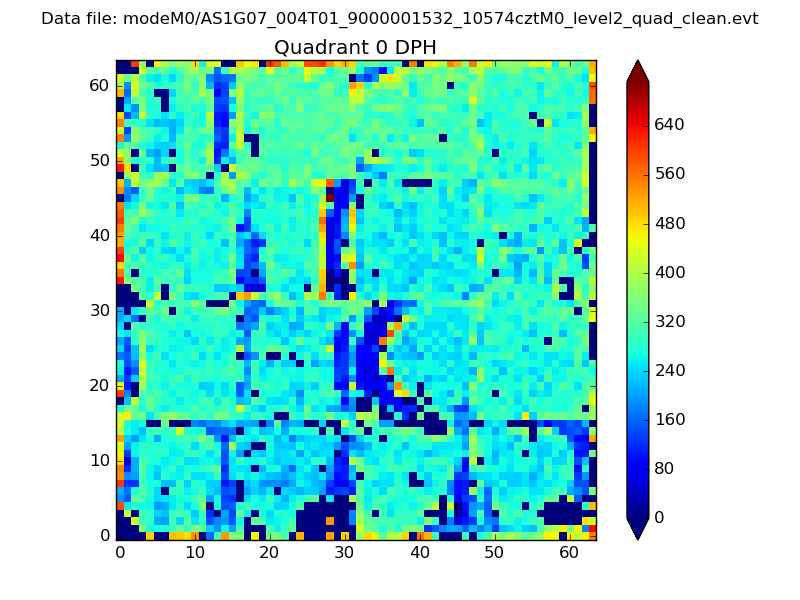 |
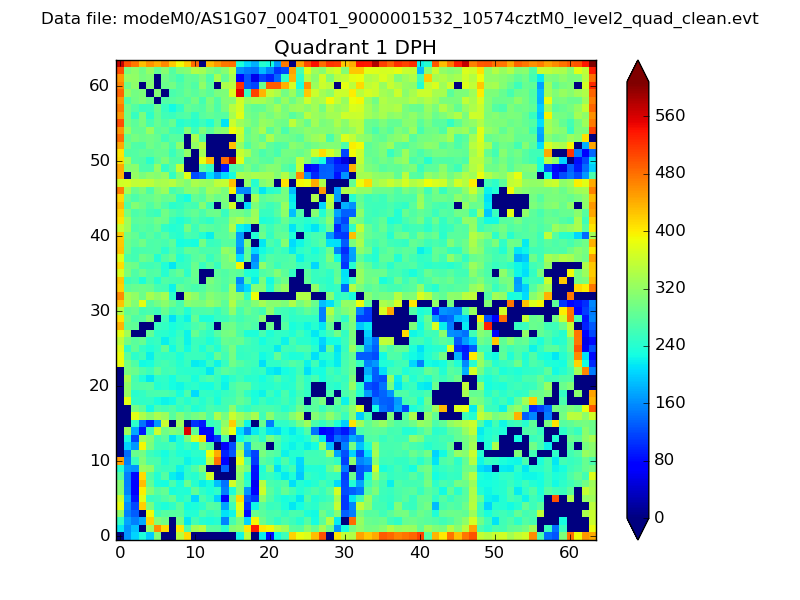 |
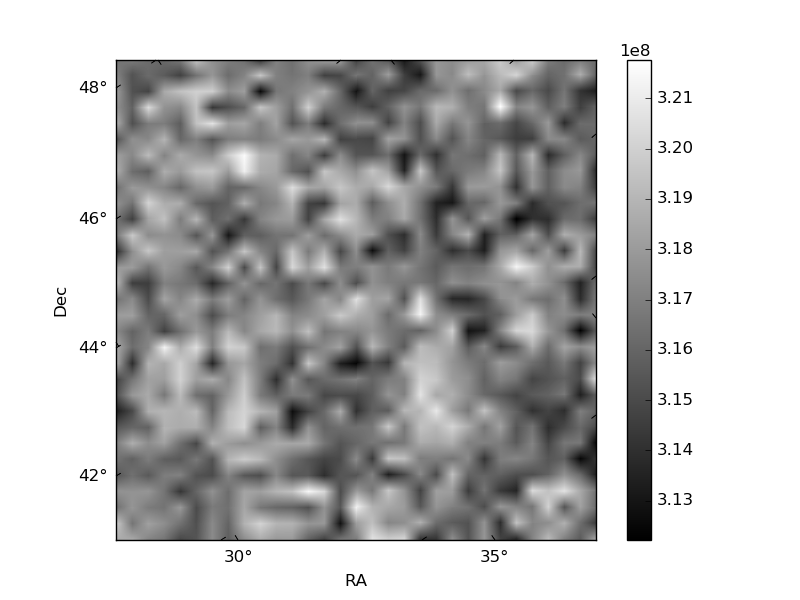
Quadrant B |
|---|---|---|---|
| Quadrant D | 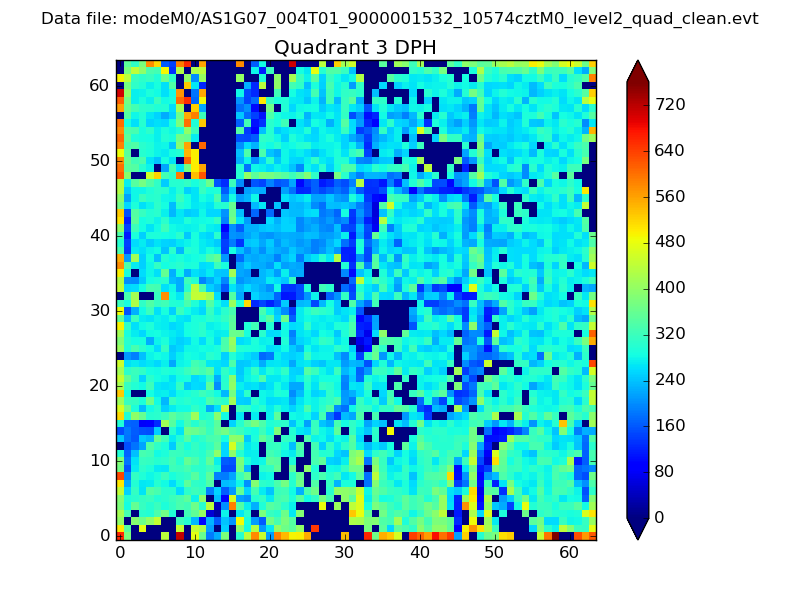 |
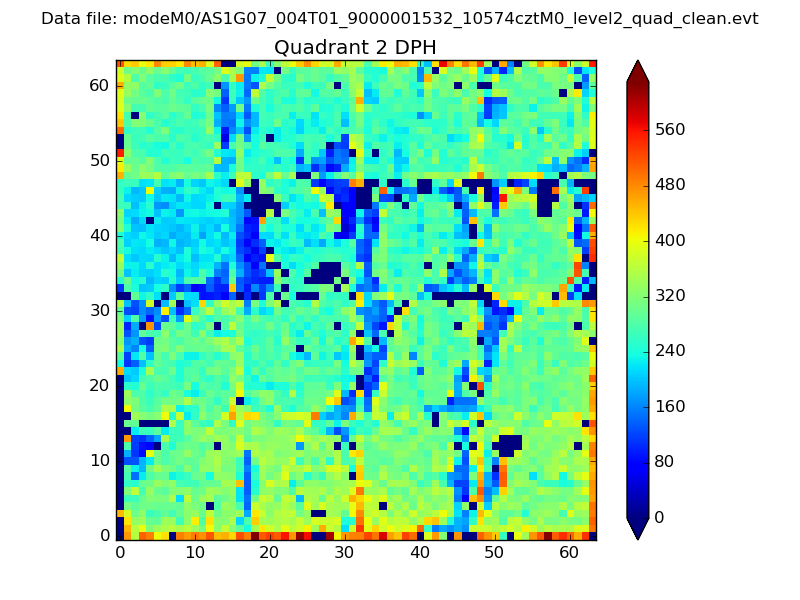 |
Quadrant C |
| Plot type | Count rate plots | Images |
|---|---|---|
| Comparison with Poisson distribution Blue bars denote a histogram of data divided into 1 sec bins. Red curve is a Poisson curve with rate = median count rate of data. |
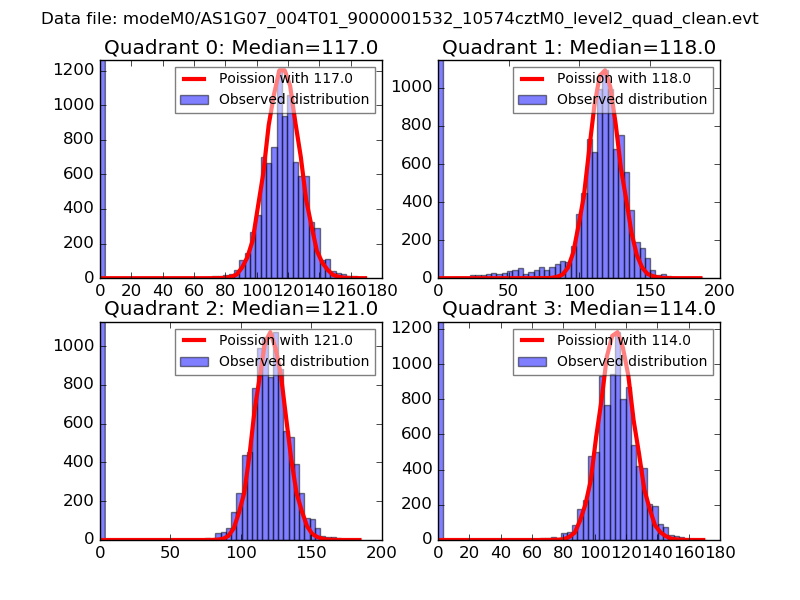 |
 |
| Quadrant-wise count rates Data is divided into 100 sec bins |
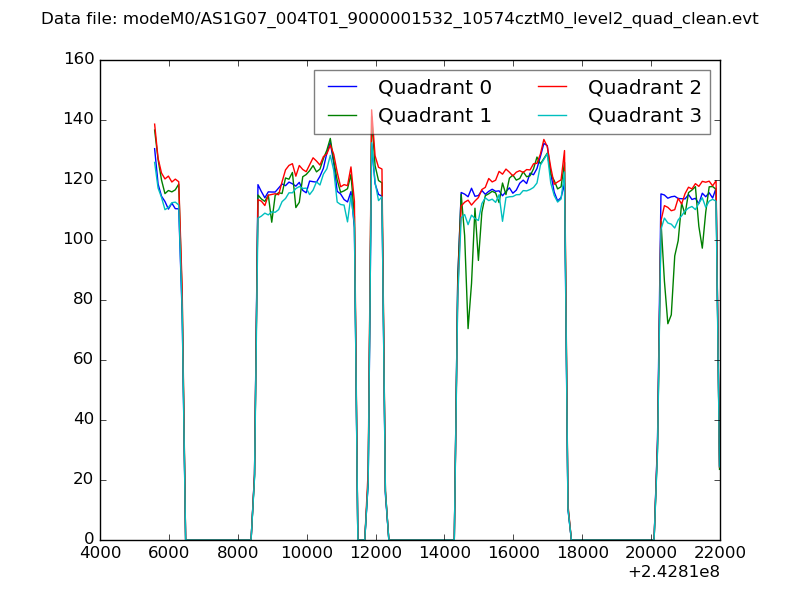 |
|
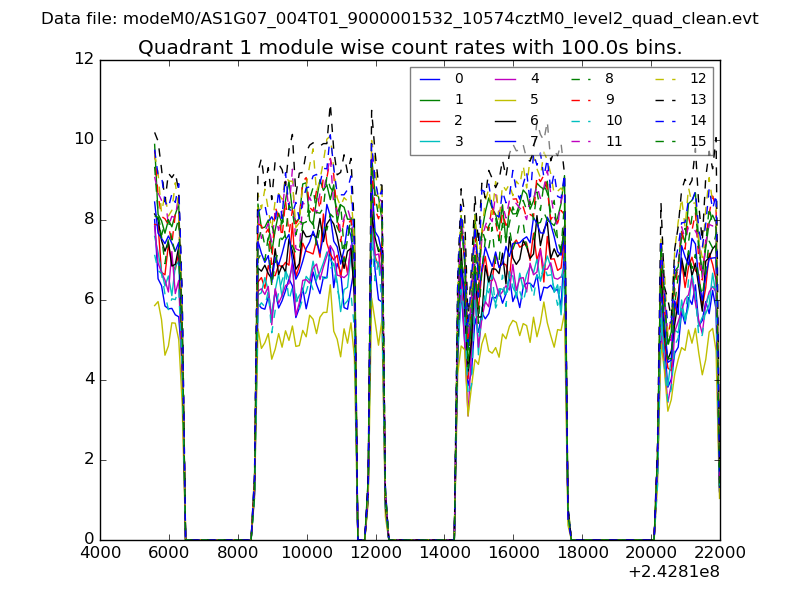
| Module-wise count rates for Quadrant A Data is divided into 100 sec bins |
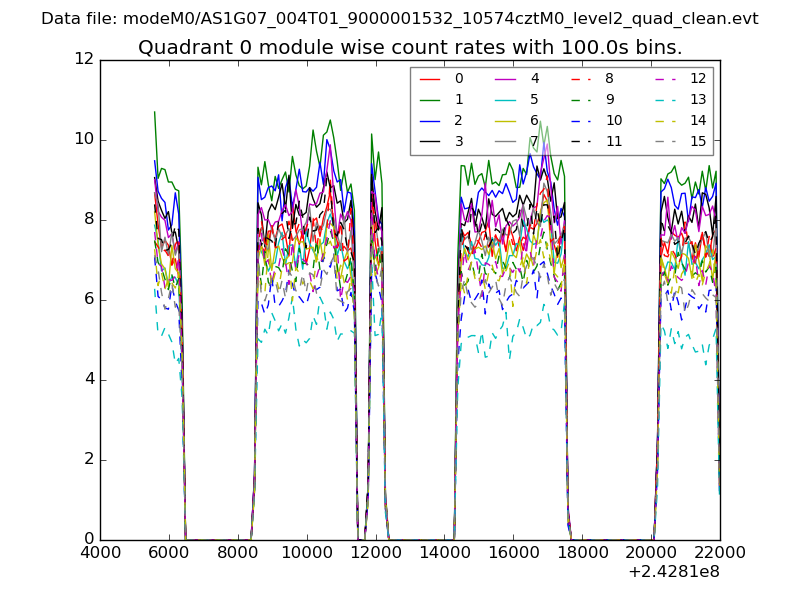 |
 |
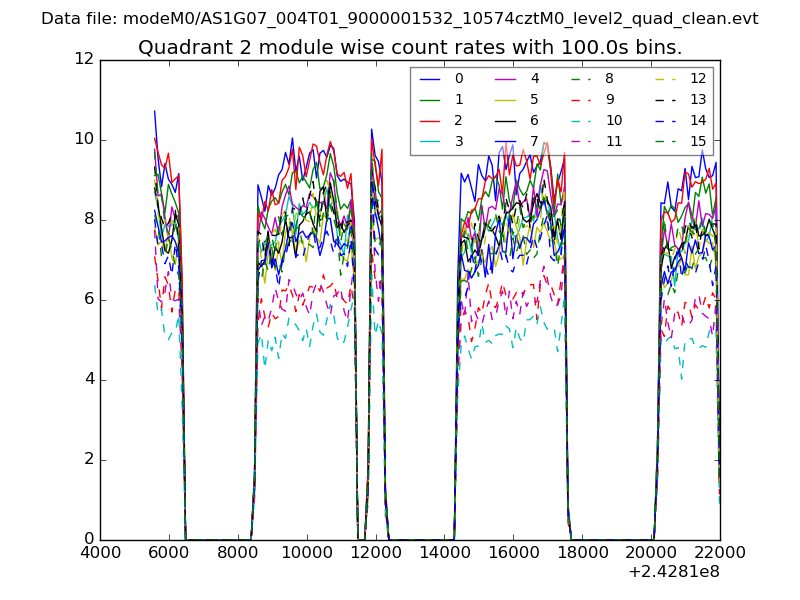
| Module-wise count rates for Quadrant B Data is divided into 100 sec bins |
 |
 |
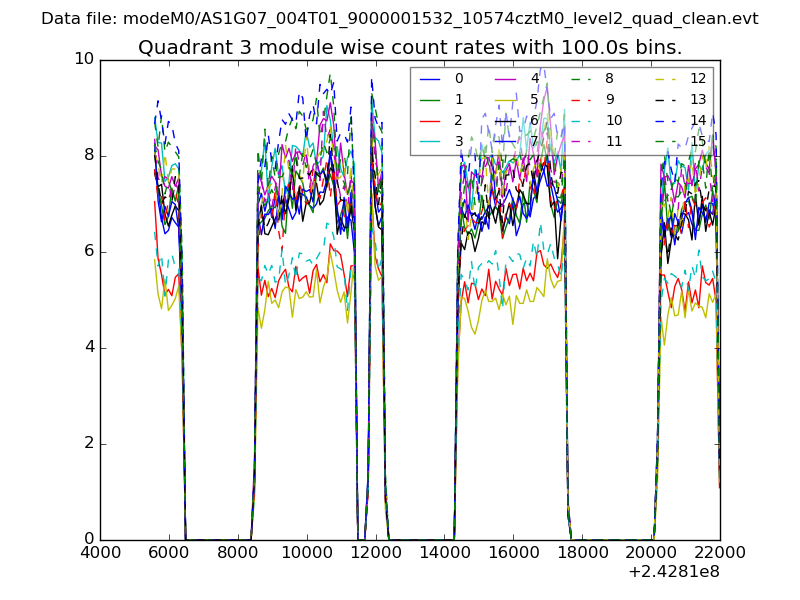
| Module-wise count rates for Quadrant C Data is divided into 100 sec bins |
 |
 |
| Module-wise count rates for Quadrant D Data is divided into 100 sec bins |
 |
 |
| Parameter | Plot |
|---|---|
| CZT HV Monitor | 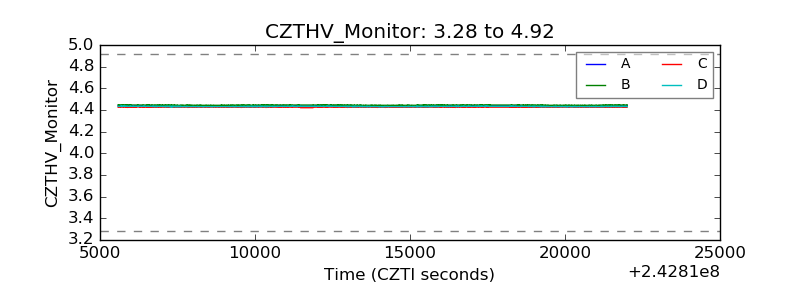 |
| D_VDD | 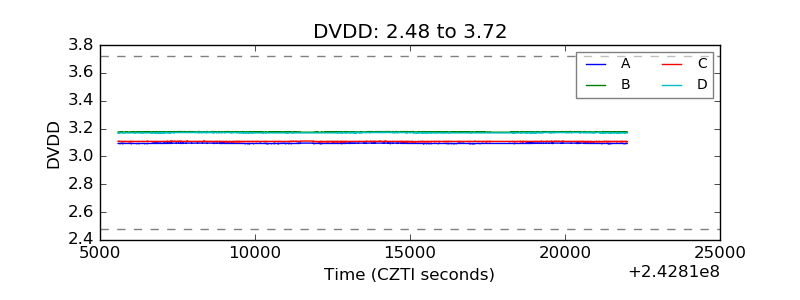 |
| Temperature 1 |  |
| Veto HV Monitor | 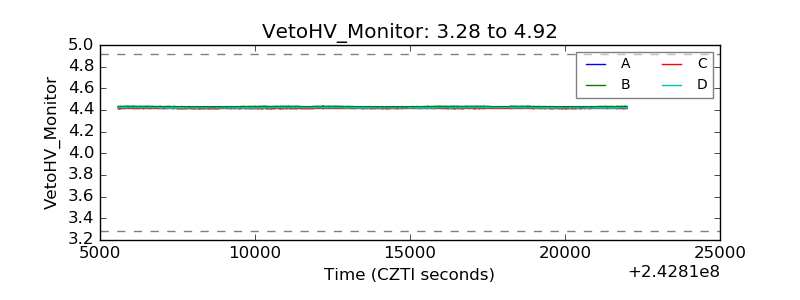 |
| Veto LLD | 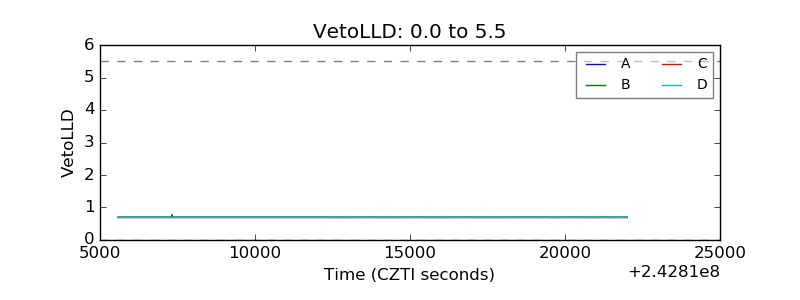 |
| Alpha Counter | 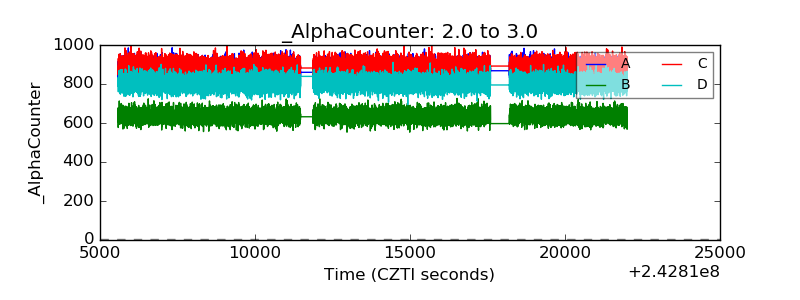 |
| _CPM_Rate | 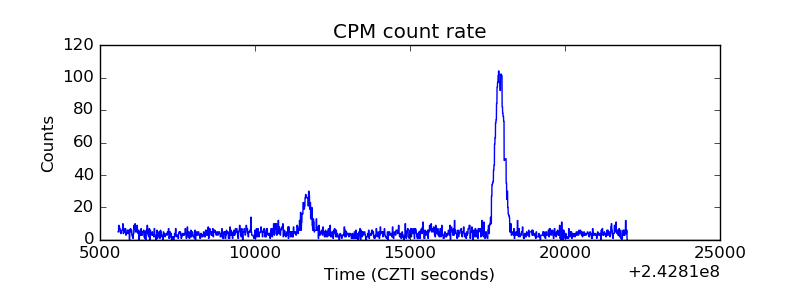 |
| CZT Counter | 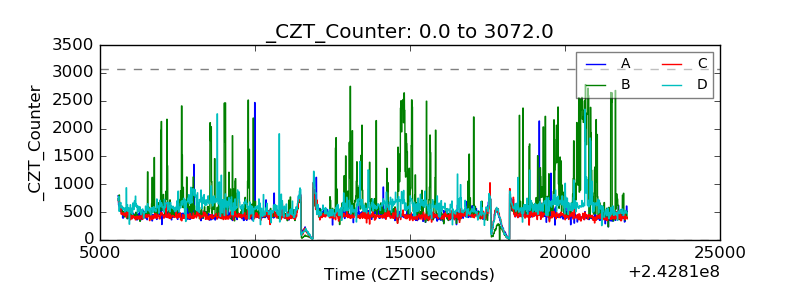 |
| +2.5 Volts monitor |  |
| +5 Volts monitor |  |
| _ROLL_ROT |  |
| _Roll_DEC | 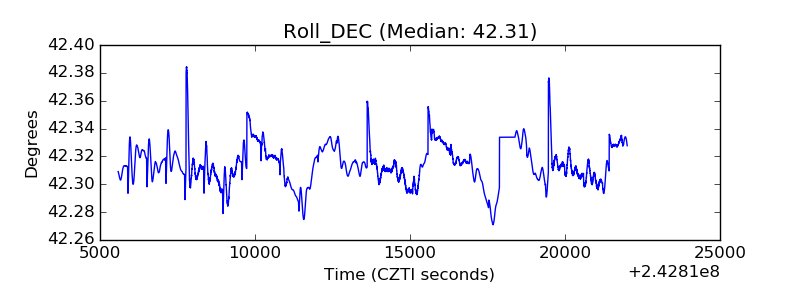 |
| _Roll_RA | 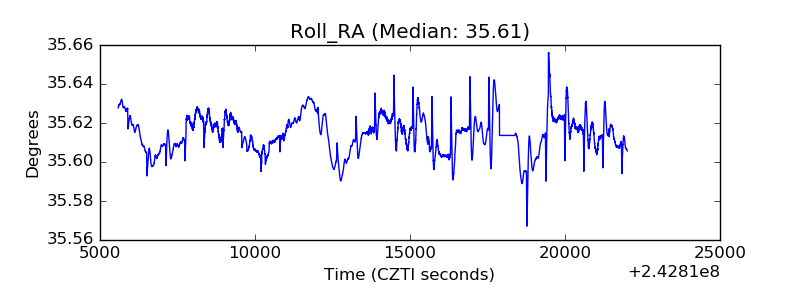 |
| Veto Counter | 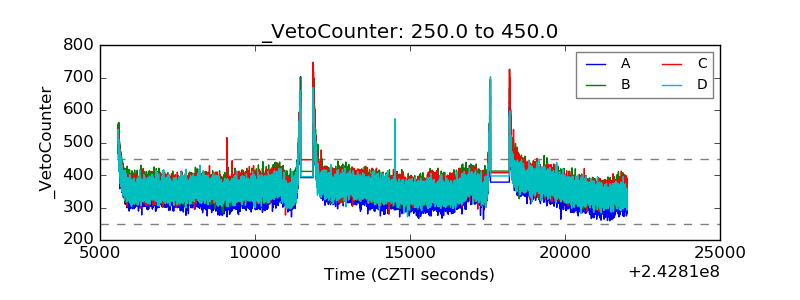 |