| Param | Original file | Final file |
|---|---|---|
| Filename | modeM0/AS1G07_046T01_9000001534cztM0_level2.fits | modeM0/AS1G07_046T01_9000001534cztM0_level2_quad_clean.evt |
| Size (bytes) | 400,743,360 | 292,196,160 |
| Size | 382.2 MB | 278.7 MB |
| Events in quadrant A | 2,447,426 | 1,578,088 |
| Events in quadrant B | 2,306,950 | 1,508,568 |
| Events in quadrant C | 2,413,910 | 1,504,519 |
| Events in quadrant D | 2,062,654 | 1,351,014 |
| Mode SS | |||
|---|---|---|---|
| Quadrant | BADHDUFLAG | Total packets | Discarded packets |
| A | 0 | 858 | 0 |
| B | 0 | 858 | 0 |
| C | 0 | 858 | 0 |
| D | 0 | 858 | 0 |
| Mode M0 | |||
|---|---|---|---|
| Quadrant | BADHDUFLAG | Total packets | Discarded packets |
| A | 0 | 88736 | 0 |
| B | 0 | 118141 | 0 |
| C | 0 | 86882 | 0 |
| D | 0 | 108086 | 0 |
| Mode M9 | |||
|---|---|---|---|
| Quadrant | BADHDUFLAG | Total packets | Discarded packets |
| A | 0 | 88 | 0 |
| B | 0 | 88 | 0 |
| C | 0 | 88 | 0 |
| D | 0 | 88 | 0 |
| Quadrant | Total seconds | Saturated seconds | Saturation percentage |
|---|---|---|---|
| A | 42326 | 346 | 0.817464% |
| B | 42326 | 3173 | 7.496574% |
| C | 42326 | 185 | 0.437084% |
| D | 42326 | 411 | 0.971034% |
Noise dominated data is calculated using 1-second bins in cleaned event files. If a bin has >2000 counts, and if more than 50% of those come from <1% of pixels, then it is considered to be noise-dominated and hence unusable.
| Quadrant | # 1 sec bins | Bins with >0 counts | Bins with >2000 counts | High rate bins dominated by noise | Noise dominated (total time) | Noise dominated (detector-on time) | Marked lightcurve |
|---|---|---|---|---|---|---|---|
| A | 56313 | 42326 | 0 | 0 | 0.00% | 0.00% |  |
| B | 56313 | 42321 | 0 | 0 | 0.00% | 0.00% |  |
| C | 56313 | 42326 | 0 | 0 | 0.00% | 0.00% |  |
| D | 56313 | 42325 | 0 | 0 | 0.00% | 0.00% |  |
Top three noisy pixels from each quadrant. If the there are fewer than three noisy pixels in the level2.evt file, extra rows are filled as -1
| Pixel properties | Quadrant properties | ||||||
|---|---|---|---|---|---|---|---|
| Quadrant | DetID | PixID | Counts | Sigma | Mean | Median | Sigma |
| A | 0 | 29 | 2402 | 11.18 | 636 | 594 | 161.7 |
| A | 7 | 110 | 2016 | 8.8 | 636 | 594 | 161.7 |
| A | 9 | 19 | 1814 | 7.55 | 636 | 594 | 161.7 |
| B | 2 | 9 | 2073 | 12.24 | 607 | 579 | 122.0 |
| B | 3 | 17 | 1552 | 7.97 | 607 | 579 | 122.0 |
| B | 5 | 128 | 1526 | 7.76 | 607 | 579 | 122.0 |
| C | 1 | 80 | 1805 | 7.21 | 637 | 593 | 168.2 |
| C | 1 | 81 | 1746 | 6.86 | 637 | 593 | 168.2 |
| C | 12 | 241 | 1662 | 6.36 | 637 | 593 | 168.2 |
| D | 6 | 231 | 1516 | 6.2 | 587 | 533 | 158.6 |
| D | 7 | 3 | 1505 | 6.13 | 587 | 533 | 158.6 |
| D | 7 | 5 | 1476 | 5.94 | 587 | 533 | 158.6 |
Histogram calculated using DETX and DETY for each event in the final _common_clean file
| Quadrant A |  |
 |
Quadrant B |
|---|---|---|---|
| Quadrant D |  |
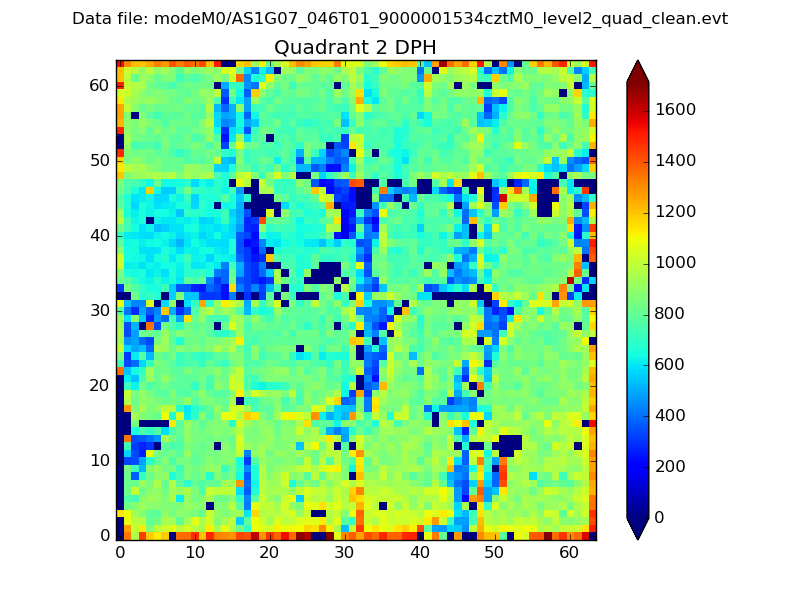 |
Quadrant C |
| Plot type | Count rate plots | Images |
|---|---|---|
| Comparison with Poisson distribution Blue bars denote a histogram of data divided into 1 sec bins. Red curve is a Poisson curve with rate = median count rate of data. |
 |
 |
| Quadrant-wise count rates Data is divided into 100 sec bins |
 |
|
| Module-wise count rates for Quadrant A Data is divided into 100 sec bins |
 |
 |
| Module-wise count rates for Quadrant B Data is divided into 100 sec bins |
 |
 |
| Module-wise count rates for Quadrant C Data is divided into 100 sec bins |
 |
 |
| Module-wise count rates for Quadrant D Data is divided into 100 sec bins |
 |
 |
| Parameter | Plot |
|---|---|
| CZT HV Monitor |  |
| D_VDD |  |
| Temperature 1 |  |
| Veto HV Monitor |  |
| Veto LLD |  |
| Alpha Counter |  |
| _CPM_Rate |  |
| CZT Counter |  |
| +2.5 Volts monitor |  |
| +5 Volts monitor |  |
| _ROLL_ROT |  |
| _Roll_DEC |  |
| _Roll_RA |  |
| Veto Counter |  |