| Param | Original file | Final file |
|---|---|---|
| Filename | modeM0/AS1G07_046T01_9000001534_10575cztM0_level2.evt | modeM0/AS1G07_046T01_9000001534_10575cztM0_level2_quad_clean.evt |
| Size (bytes) | 496,805,760 | 81,803,520 |
| Size | 473.8 MB | 78.0 MB |
| Events in quadrant A | 2,934,020 | 530,266 |
| Events in quadrant B | 4,957,338 | 492,581 |
| Events in quadrant C | 2,775,579 | 527,216 |
| Events in quadrant D | 3,960,388 | 496,276 |
| Mode SS | |||
|---|---|---|---|
| Quadrant | BADHDUFLAG | Total packets | Discarded packets |
| A | 0 | 124 | 0 |
| B | 0 | 124 | 0 |
| C | 0 | 124 | 0 |
| D | 0 | 124 | 0 |
| Mode M0 | |||
|---|---|---|---|
| Quadrant | BADHDUFLAG | Total packets | Discarded packets |
| A | 0 | 12814 | 2 |
| B | 0 | 18755 | 1 |
| C | 0 | 12572 | 1 |
| D | 0 | 15941 | 1 |
| Mode M9 | |||
|---|---|---|---|
| Quadrant | BADHDUFLAG | Total packets | Discarded packets |
| A | 0 | 10 | 0 |
| B | 0 | 10 | 0 |
| C | 0 | 10 | 0 |
| D | 0 | 10 | 0 |
| Quadrant | Total seconds | Saturated seconds | Saturation percentage |
|---|---|---|---|
| A | 6170 | 50 | 0.810373% |
| B | 6170 | 736 | 11.928687% |
| C | 6170 | 32 | 0.518639% |
| D | 6170 | 75 | 1.215559% |
Noise dominated data is calculated using 1-second bins in cleaned event files. If a bin has >2000 counts, and if more than 50% of those come from <1% of pixels, then it is considered to be noise-dominated and hence unusable.
| Quadrant | # 1 sec bins | Bins with >0 counts | Bins with >2000 counts | High rate bins dominated by noise | Noise dominated (total time) | Noise dominated (detector-on time) | Marked lightcurve |
|---|---|---|---|---|---|---|---|
| A | 7115 | 6171 | 0 | 0 | 0.00% | 0.00% | 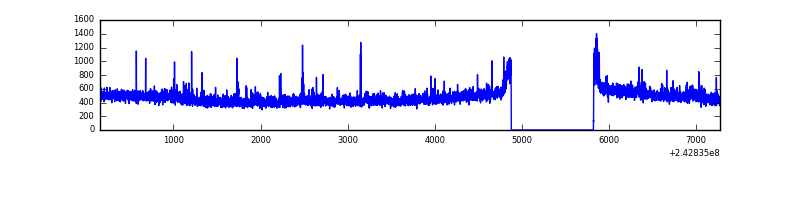 |
| B | 7115 | 6171 | 551 | 551 | 7.74% | 8.93% | 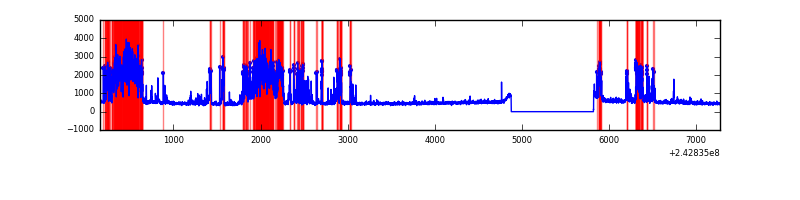 |
| C | 7115 | 6171 | 1 | 1 | 0.01% | 0.02% | 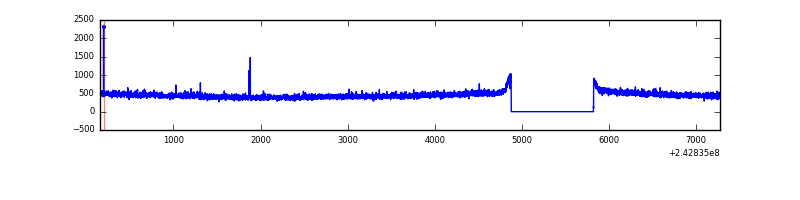 |
| D | 7115 | 6171 | 35 | 35 | 0.49% | 0.57% | 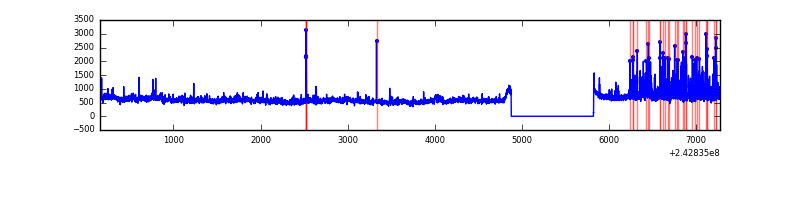 |
Top three noisy pixels from each quadrant. If the there are fewer than three noisy pixels in the level2.evt file, extra rows are filled as -1
| Pixel properties | Quadrant properties | ||||||
|---|---|---|---|---|---|---|---|
| Quadrant | DetID | PixID | Counts | Sigma | Mean | Median | Sigma |
| A | 13 | 251 | 75583 | 500.42 | 727 | 711 | 149.6 |
| A | 1 | 162 | 33381 | 218.36 | 727 | 711 | 149.6 |
| A | 11 | 29 | 6986 | 41.94 | 727 | 711 | 149.6 |
| B | 4 | 239 | 2098482 | 15557.32 | 694 | 674 | 134.8 |
| B | 0 | 219 | 53520 | 391.9 | 694 | 674 | 134.8 |
| B | 0 | 214 | 33783 | 245.53 | 694 | 674 | 134.8 |
| C | 4 | 175 | 18696 | 109.45 | 704 | 710 | 164.3 |
| C | 14 | 234 | 7864 | 43.53 | 704 | 710 | 164.3 |
| C | 13 | 61 | 5142 | 26.97 | 704 | 710 | 164.3 |
| D | 2 | 16 | 697856 | 4115.91 | 701 | 681 | 169.4 |
| D | 8 | 195 | 454854 | 2681.3 | 701 | 681 | 169.4 |
| D | 1 | 52 | 71260 | 416.68 | 701 | 681 | 169.4 |
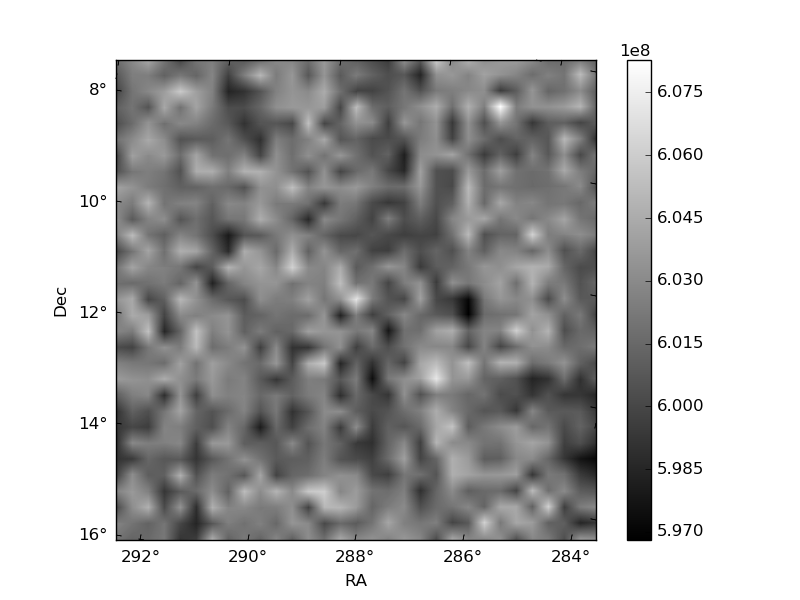
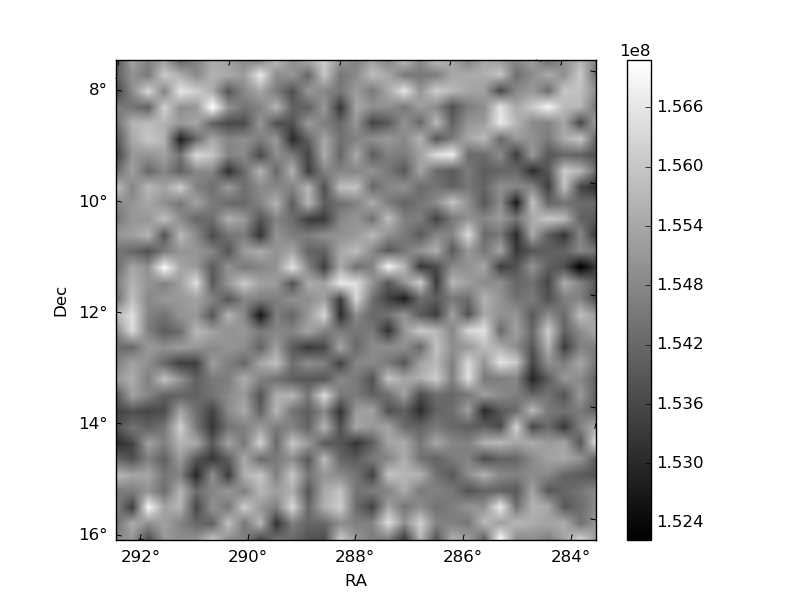
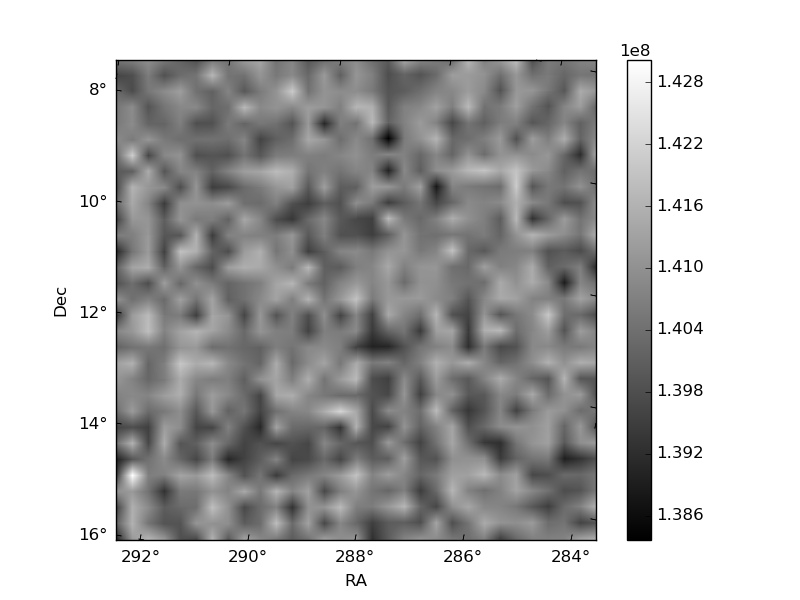
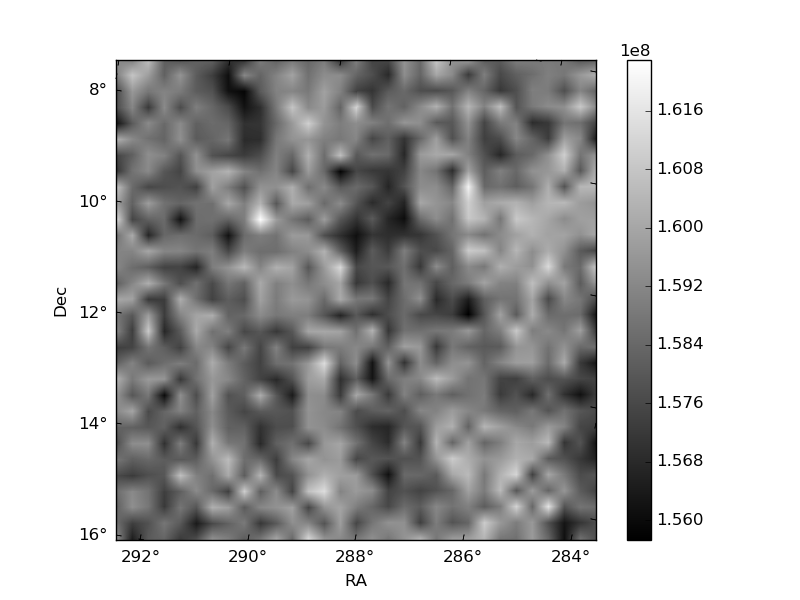
Histogram calculated using DETX and DETY for each event in the final _common_clean file
| Quadrant A | 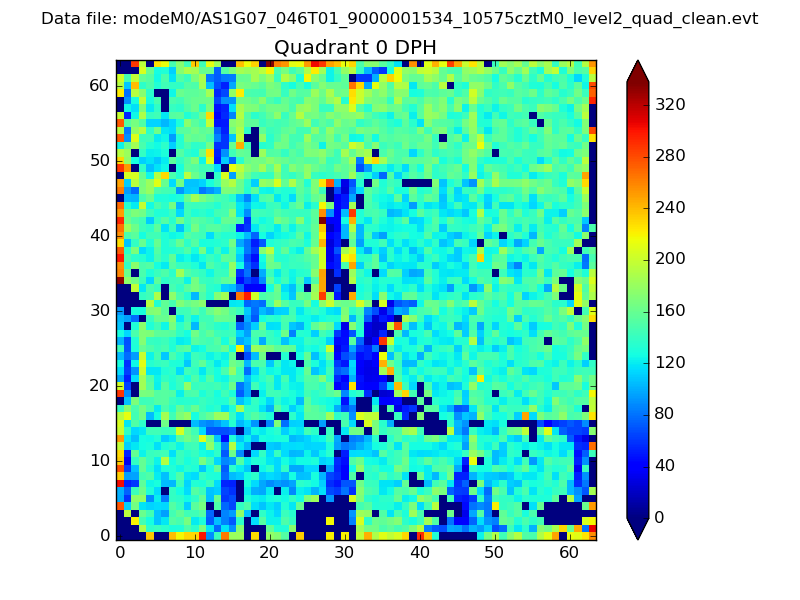 |
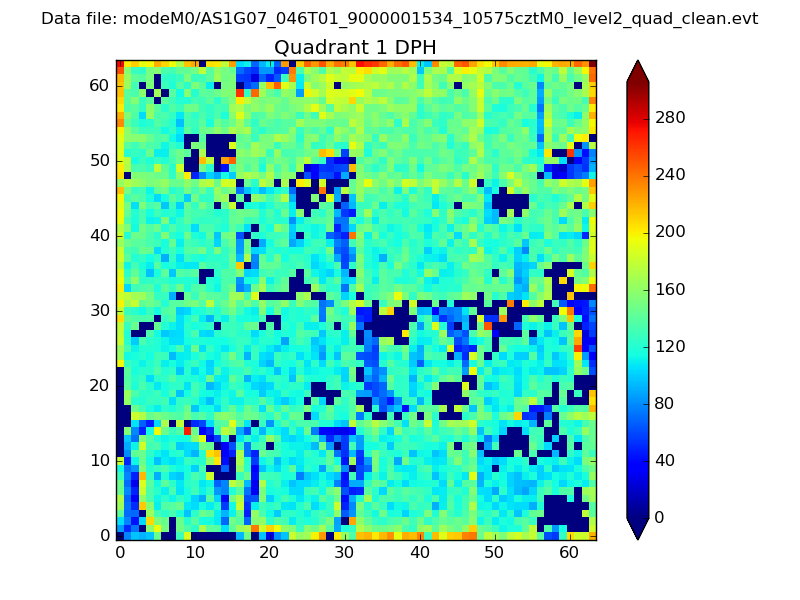 |
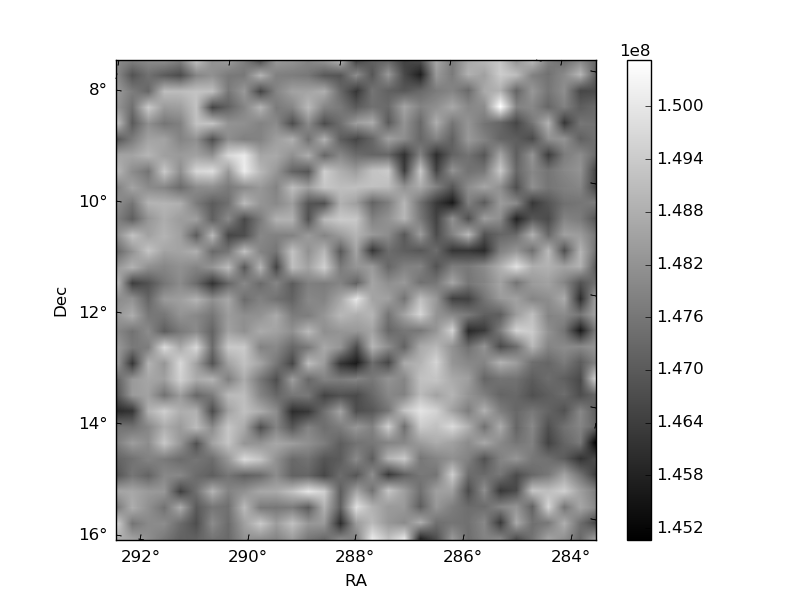
Quadrant B |
|---|---|---|---|
| Quadrant D | 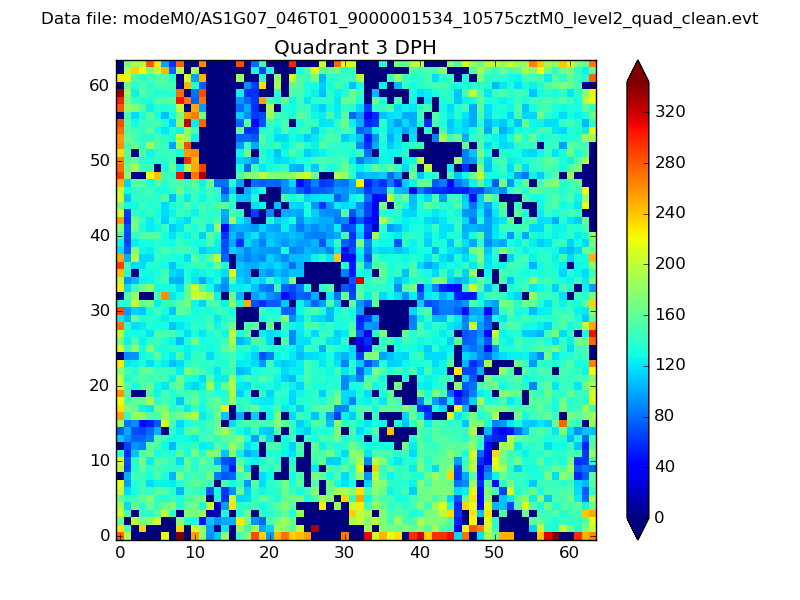 |
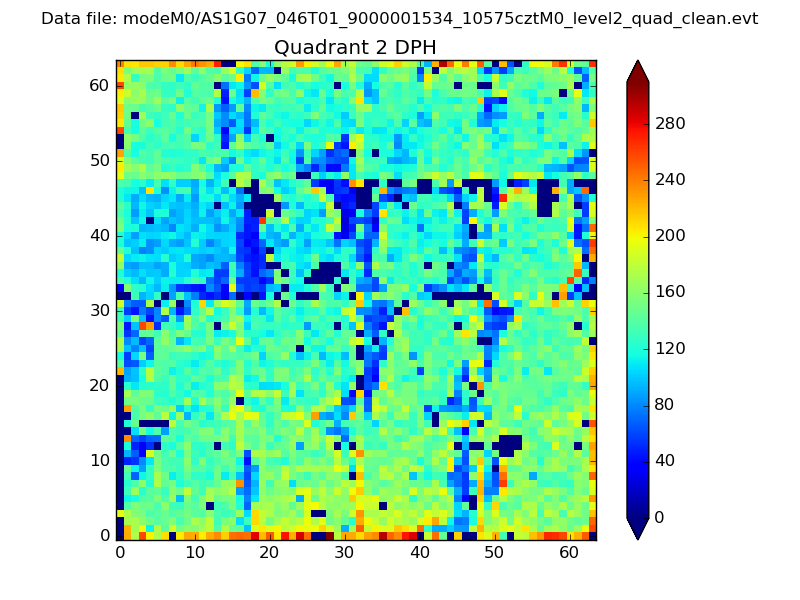 |
Quadrant C |
| Plot type | Count rate plots | Images |
|---|---|---|
| Comparison with Poisson distribution Blue bars denote a histogram of data divided into 1 sec bins. Red curve is a Poisson curve with rate = median count rate of data. |
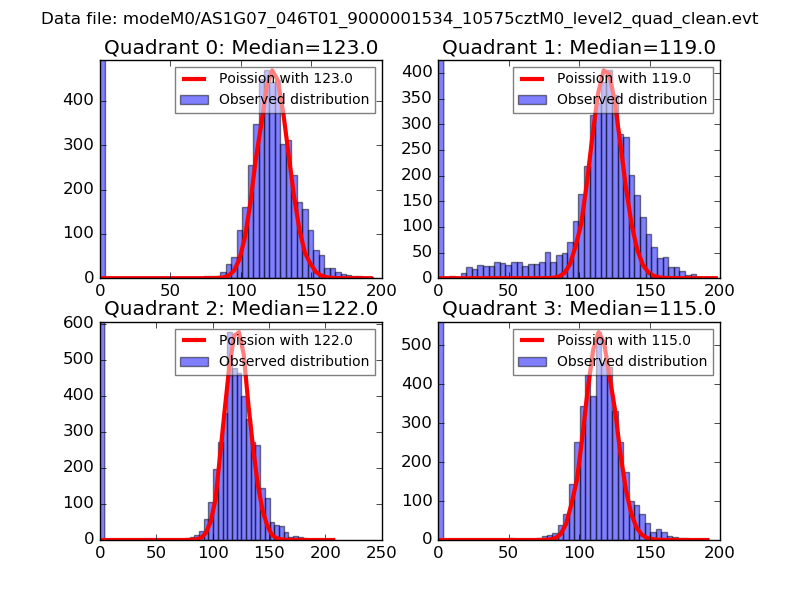 |
 |
| Quadrant-wise count rates Data is divided into 100 sec bins |
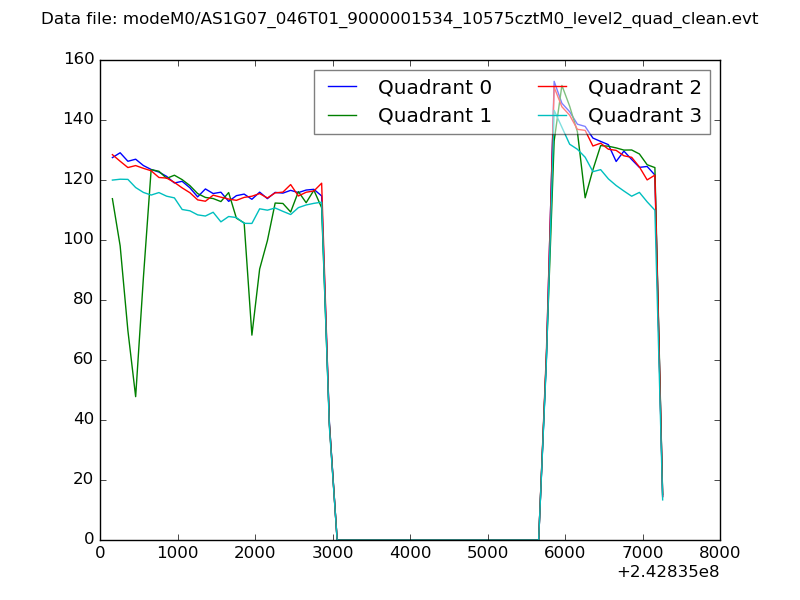 |
|
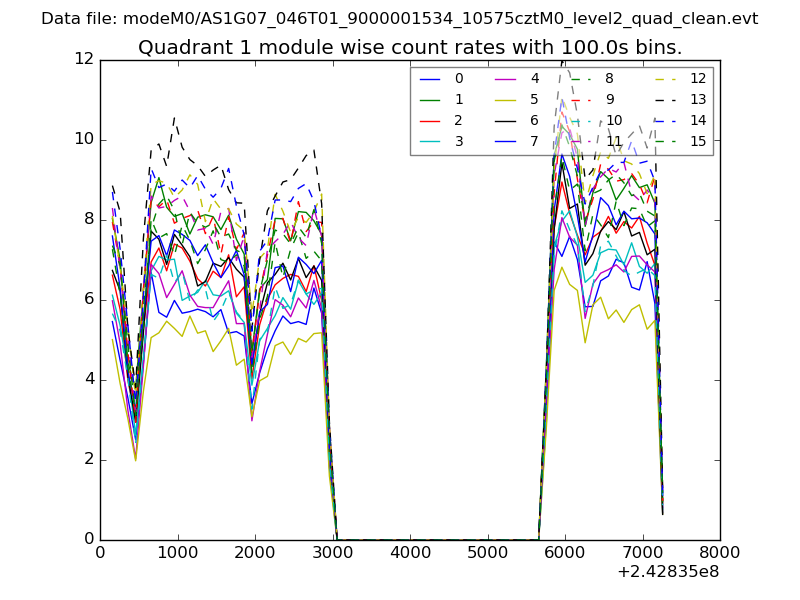
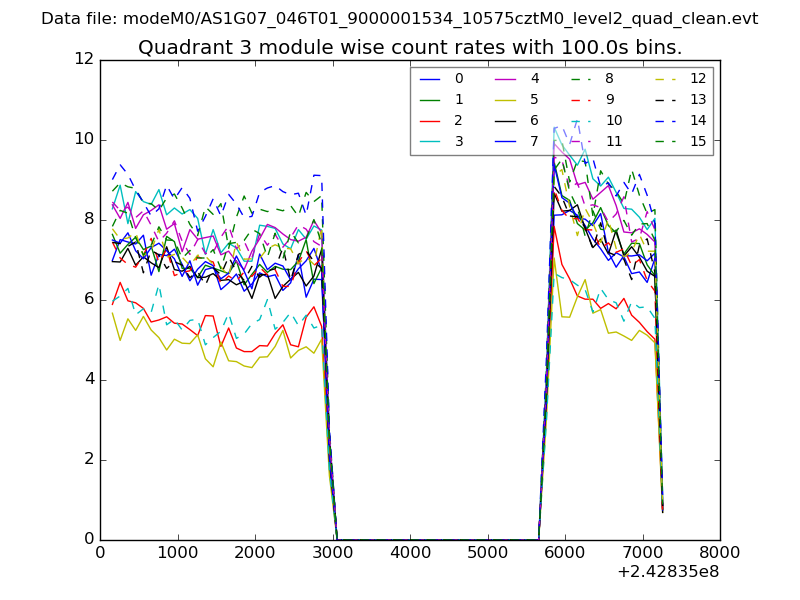
| Module-wise count rates for Quadrant A Data is divided into 100 sec bins |
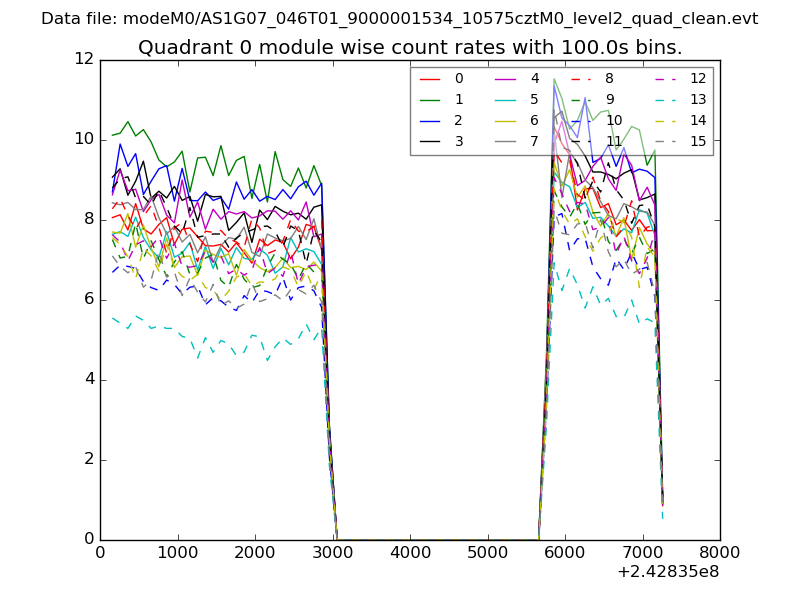 |
 |
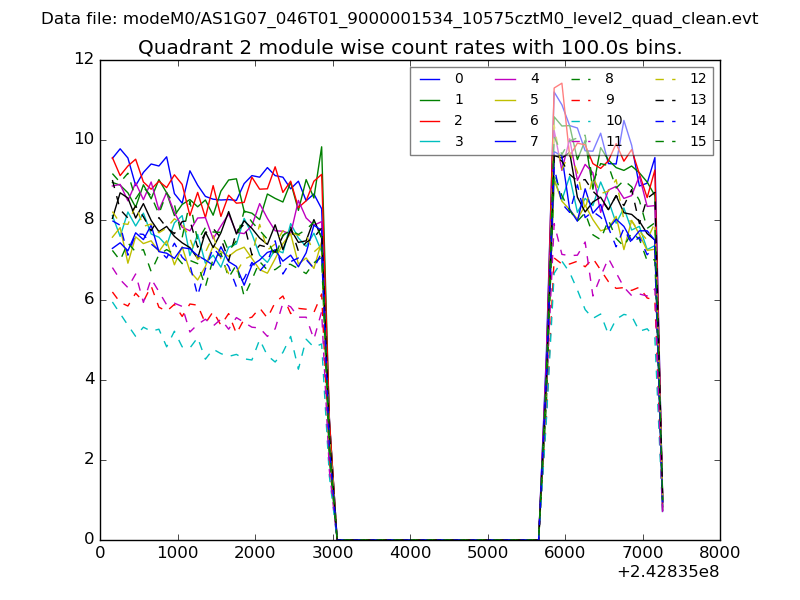
| Module-wise count rates for Quadrant B Data is divided into 100 sec bins |
 |
 |
| Module-wise count rates for Quadrant C Data is divided into 100 sec bins |
 |
 |
| Module-wise count rates for Quadrant D Data is divided into 100 sec bins |
 |
 |
| Parameter | Plot |
|---|---|
| CZT HV Monitor | 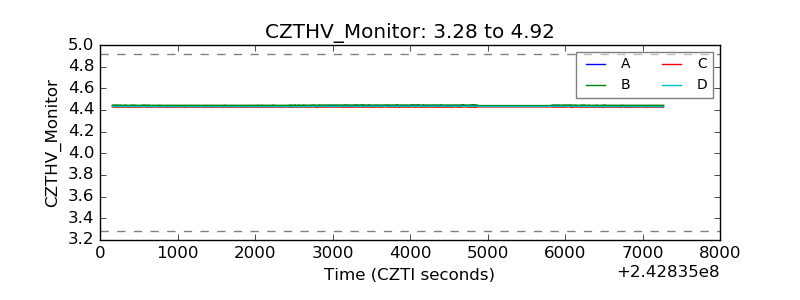 |
| D_VDD | 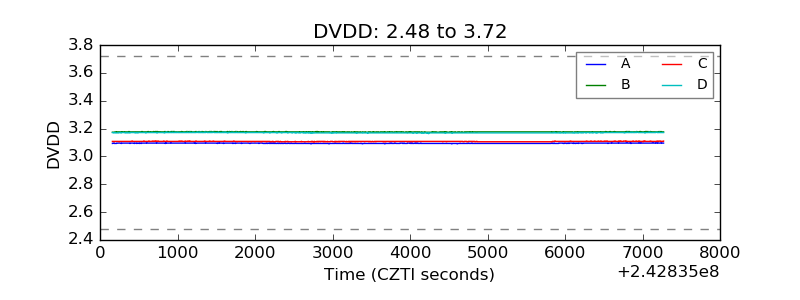 |
| Temperature 1 | 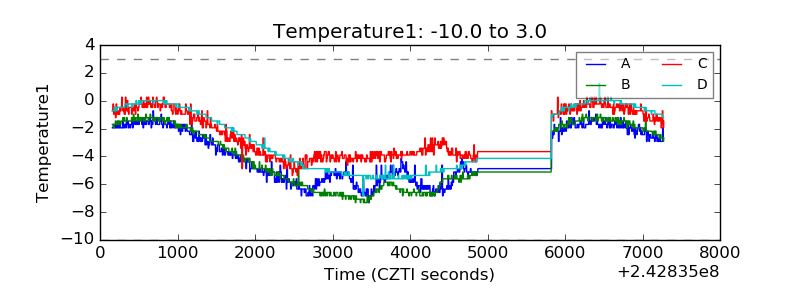 |
| Veto HV Monitor | 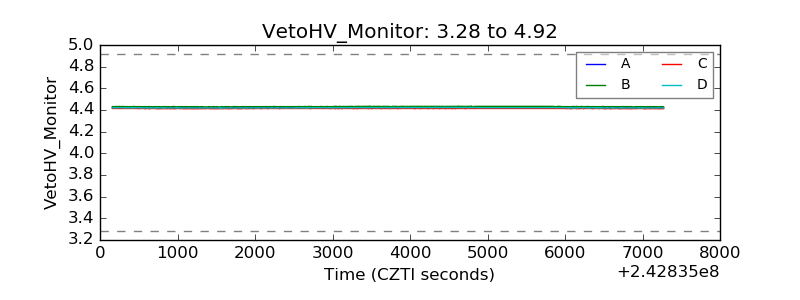 |
| Veto LLD | 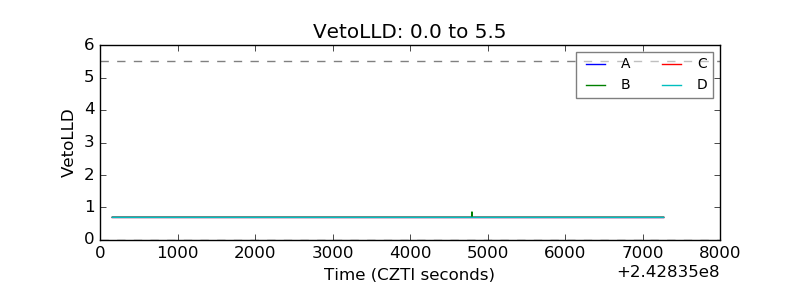 |
| Alpha Counter | 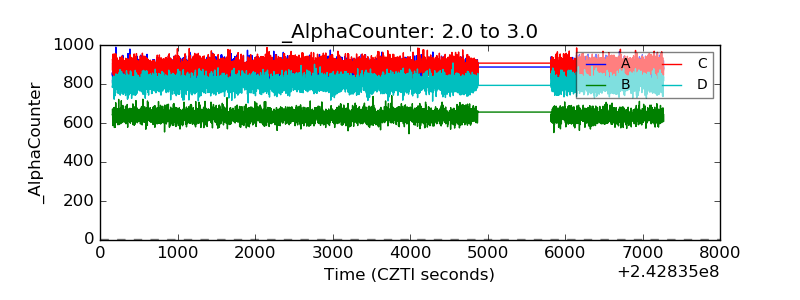 |
| _CPM_Rate | 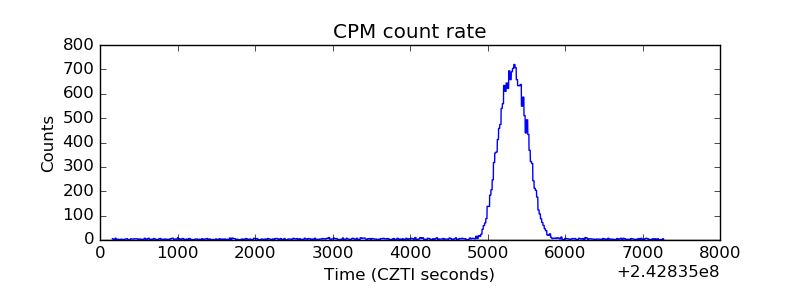 |
| CZT Counter | 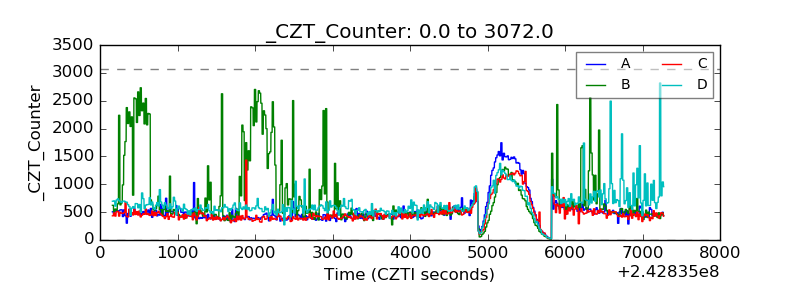 |
| +2.5 Volts monitor |  |
| +5 Volts monitor | 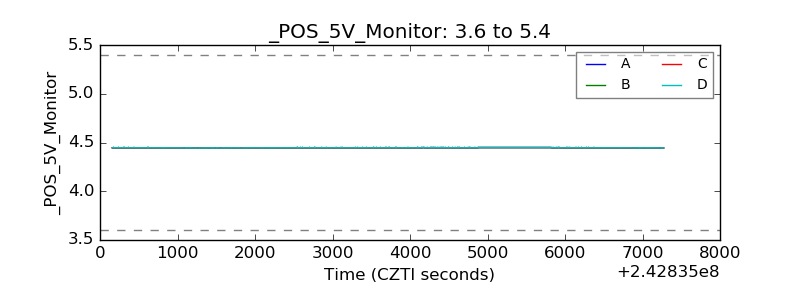 |
| _ROLL_ROT | 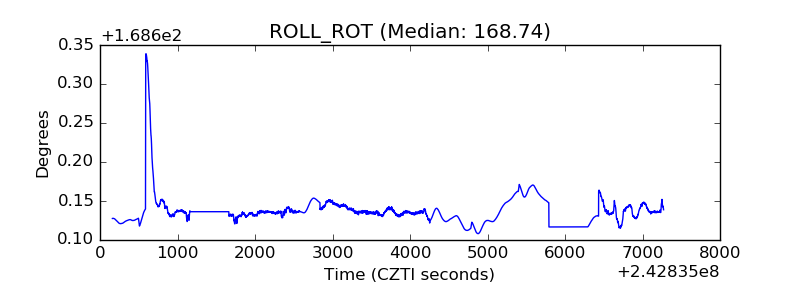 |
| _Roll_DEC |  |
| _Roll_RA | 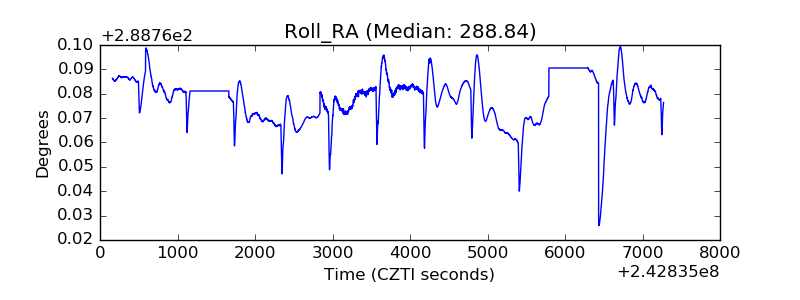 |
| Veto Counter | 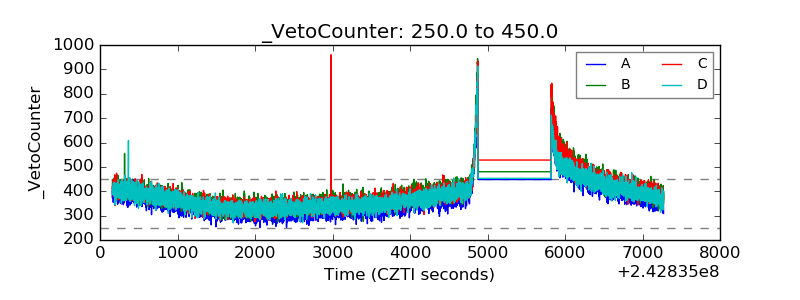 |