| Param | Original file | Final file |
|---|---|---|
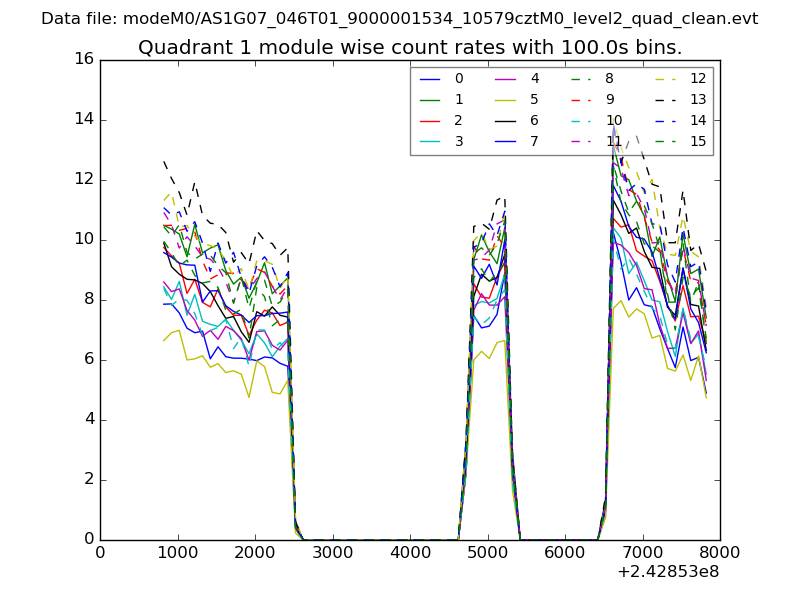
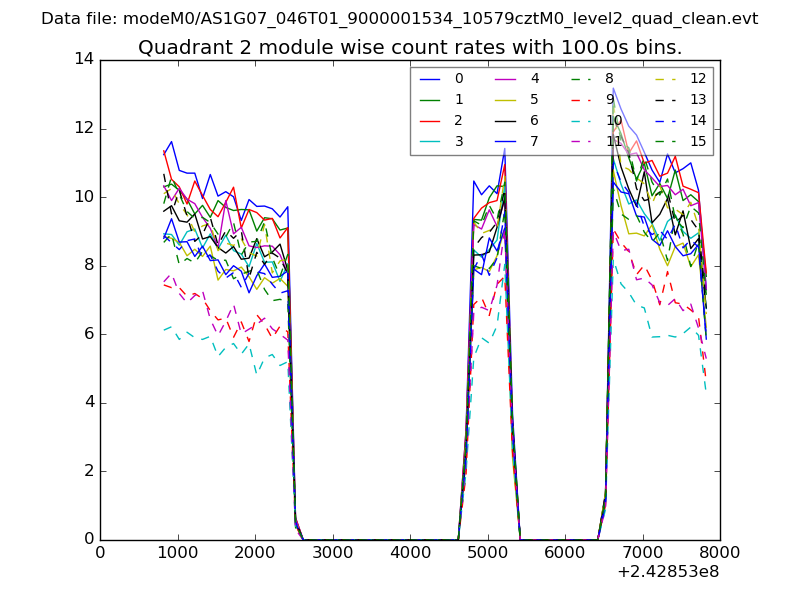
| Filename | modeM0/AS1G07_046T01_9000001534_10579cztM0_level2.evt | modeM0/AS1G07_046T01_9000001534_10579cztM0_level2_quad_clean.evt |
| Size (bytes) | 453,421,440 | 78,652,800 |
| Size | 432.4 MB | 75.0 MB |
| Events in quadrant A | 2,832,547 | 505,601 |
| Events in quadrant B | 4,490,610 | 497,907 |
| Events in quadrant C | 2,732,836 | 501,802 |
| Events in quadrant D | 3,280,878 | 469,705 |
| Mode SS | |||
|---|---|---|---|
| Quadrant | BADHDUFLAG | Total packets | Discarded packets |
| A | 0 | 118 | 0 |
| B | 0 | 118 | 0 |
| C | 0 | 118 | 0 |
| D | 0 | 118 | 0 |
| Mode M0 | |||
|---|---|---|---|
| Quadrant | BADHDUFLAG | Total packets | Discarded packets |
| A | 0 | 12144 | 2 |
| B | 0 | 17122 | 1 |
| C | 0 | 11967 | 1 |
| D | 0 | 13495 | 1 |
| Mode M9 | |||
|---|---|---|---|
| Quadrant | BADHDUFLAG | Total packets | Discarded packets |
| A | 0 | 13 | 0 |
| B | 0 | 13 | 0 |
| C | 0 | 13 | 0 |
| D | 0 | 13 | 0 |
| Quadrant | Total seconds | Saturated seconds | Saturation percentage |
|---|---|---|---|
| A | 5817 | 53 | 0.911123% |
| B | 5817 | 472 | 8.114148% |
| C | 5817 | 33 | 0.567303% |
| D | 5817 | 37 | 0.636067% |
Noise dominated data is calculated using 1-second bins in cleaned event files. If a bin has >2000 counts, and if more than 50% of those come from <1% of pixels, then it is considered to be noise-dominated and hence unusable.
| Quadrant | # 1 sec bins | Bins with >0 counts | Bins with >2000 counts | High rate bins dominated by noise | Noise dominated (total time) | Noise dominated (detector-on time) | Marked lightcurve |
|---|---|---|---|---|---|---|---|
| A | 7077 | 5818 | 0 | 0 | 0.00% | 0.00% | 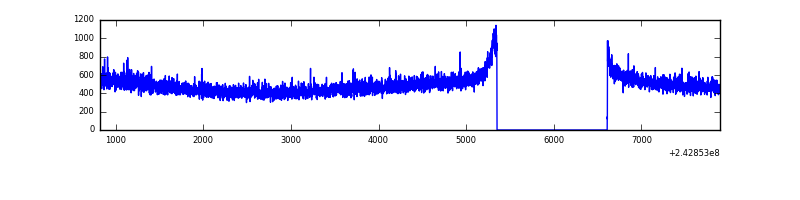 |
| B | 7077 | 5818 | 335 | 335 | 4.73% | 5.76% | 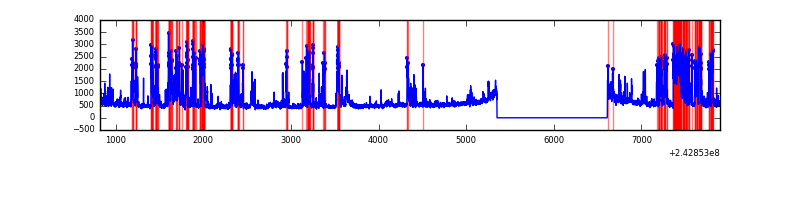 |
| C | 7077 | 5818 | 5 | 5 | 0.07% | 0.09% | 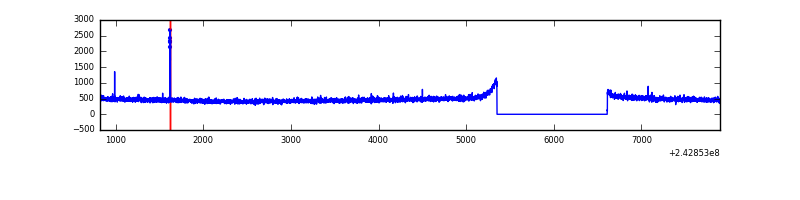 |
| D | 7077 | 5818 | 12 | 12 | 0.17% | 0.21% | 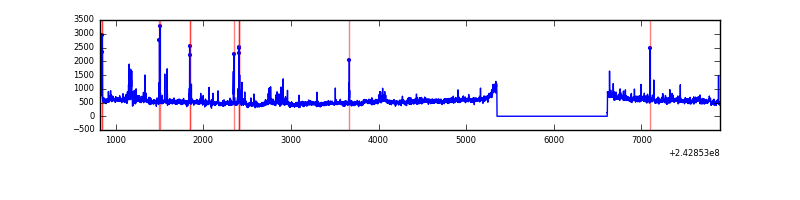 |
Top three noisy pixels from each quadrant. If the there are fewer than three noisy pixels in the level2.evt file, extra rows are filled as -1
| Pixel properties | Quadrant properties | ||||||
|---|---|---|---|---|---|---|---|
| Quadrant | DetID | PixID | Counts | Sigma | Mean | Median | Sigma |
| A | 13 | 251 | 46831 | 318.28 | 713 | 698 | 144.9 |
| A | 1 | 162 | 22690 | 151.73 | 713 | 698 | 144.9 |
| A | 0 | 226 | 6524 | 40.19 | 713 | 698 | 144.9 |
| B | 4 | 239 | 1500191 | 11246.78 | 707 | 693 | 133.3 |
| B | 0 | 219 | 89380 | 665.18 | 707 | 693 | 133.3 |
| B | 4 | 81 | 35323 | 259.74 | 707 | 693 | 133.3 |
| C | 3 | 254 | 14116 | 82.44 | 695 | 701 | 162.7 |
| C | 4 | 175 | 6355 | 34.75 | 695 | 701 | 162.7 |
| C | 13 | 61 | 5173 | 27.48 | 695 | 701 | 162.7 |
| D | 2 | 16 | 309730 | 1877.91 | 683 | 666 | 164.6 |
| D | 8 | 195 | 179702 | 1087.84 | 683 | 666 | 164.6 |
| D | 10 | 199 | 47593 | 285.13 | 683 | 666 | 164.6 |
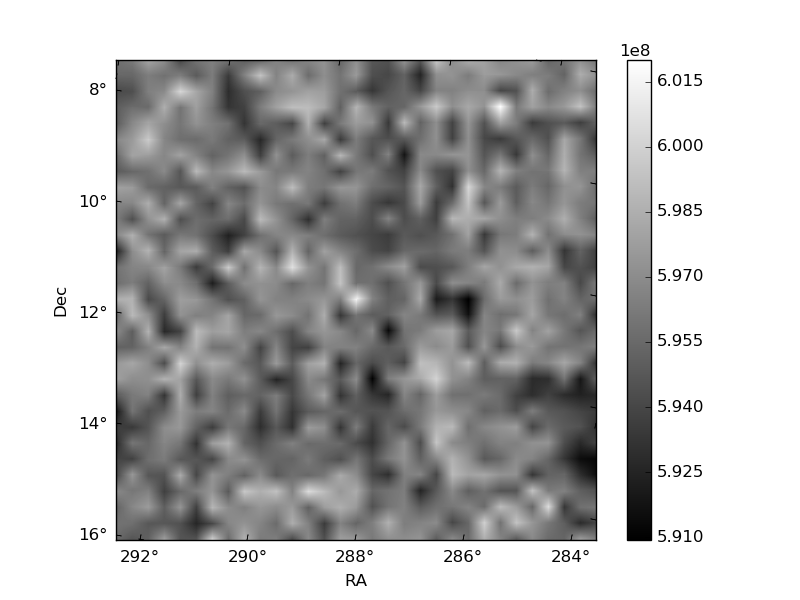
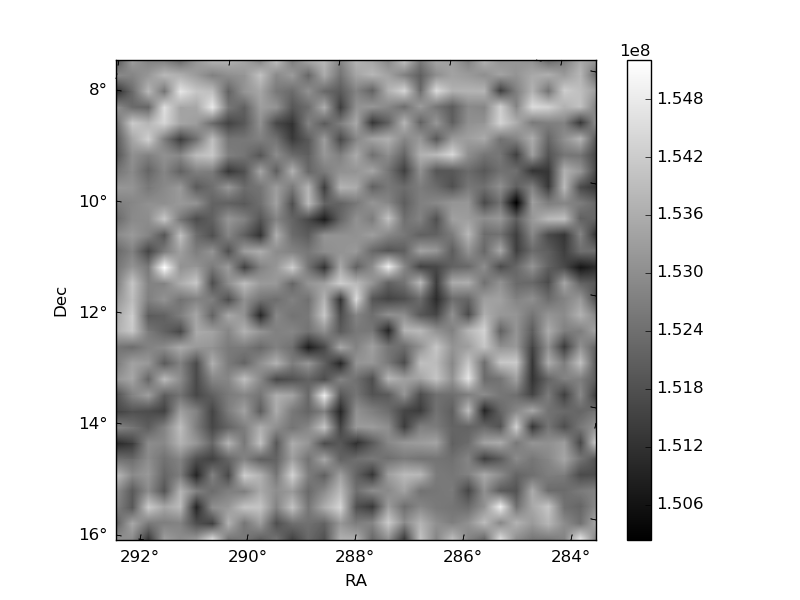
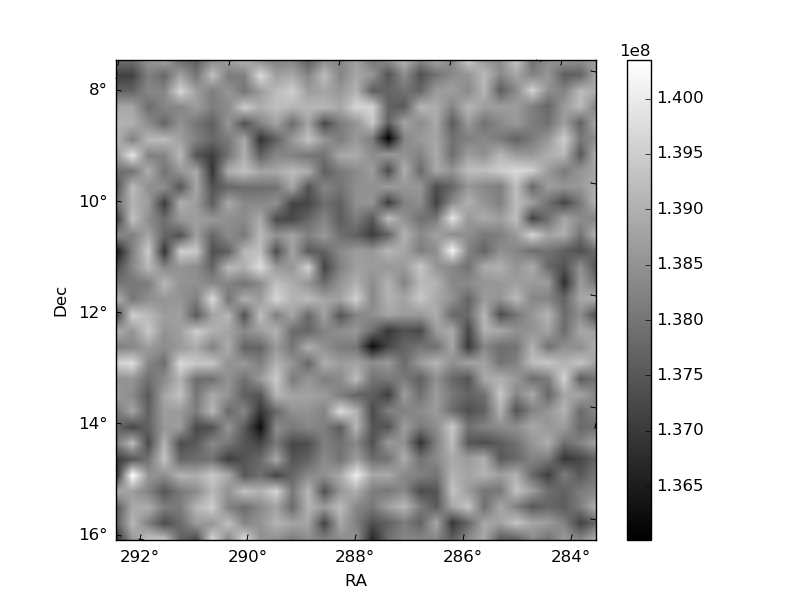
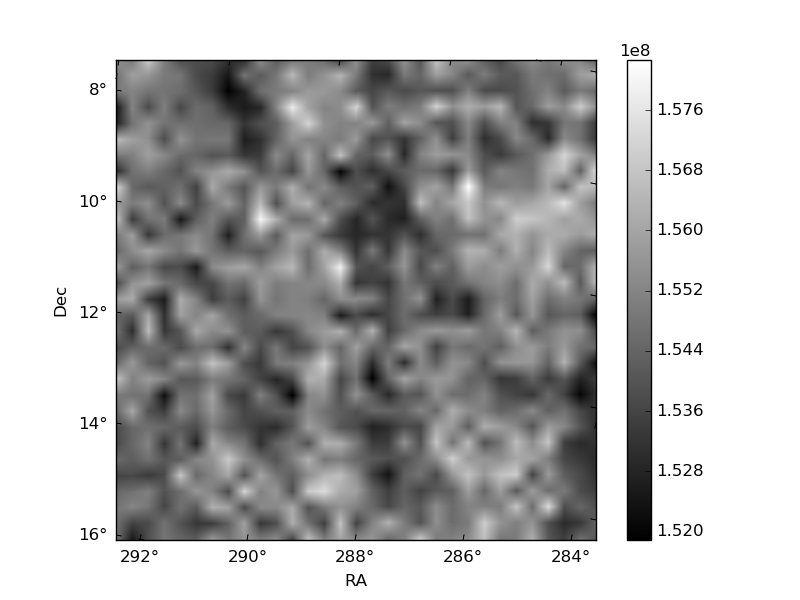
Histogram calculated using DETX and DETY for each event in the final _common_clean file
| Quadrant A | 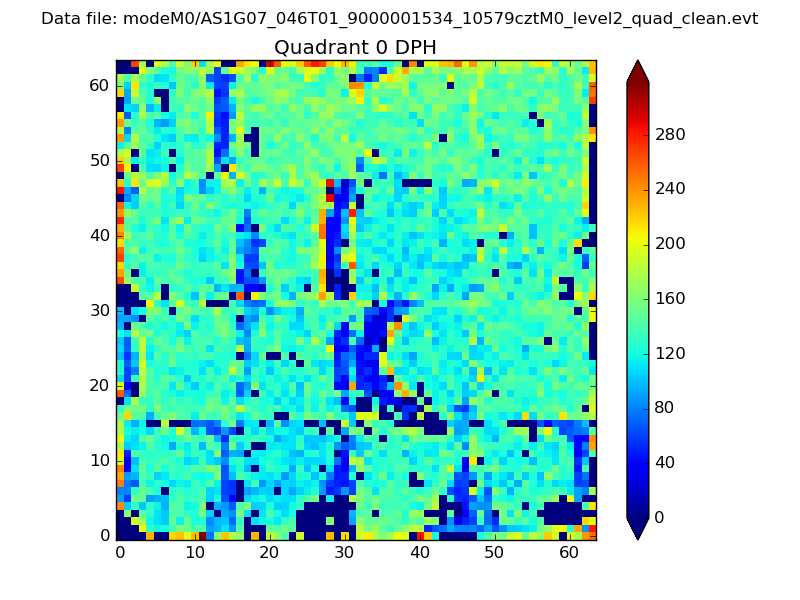 |
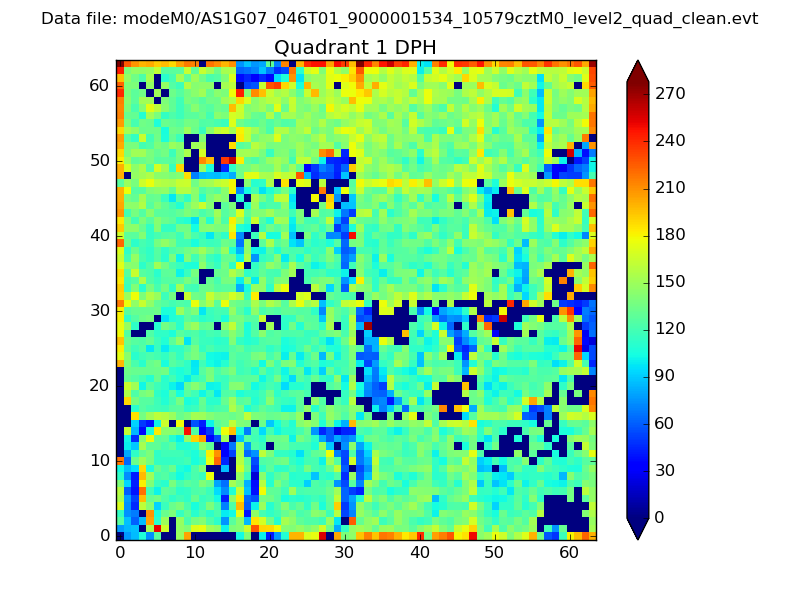 |
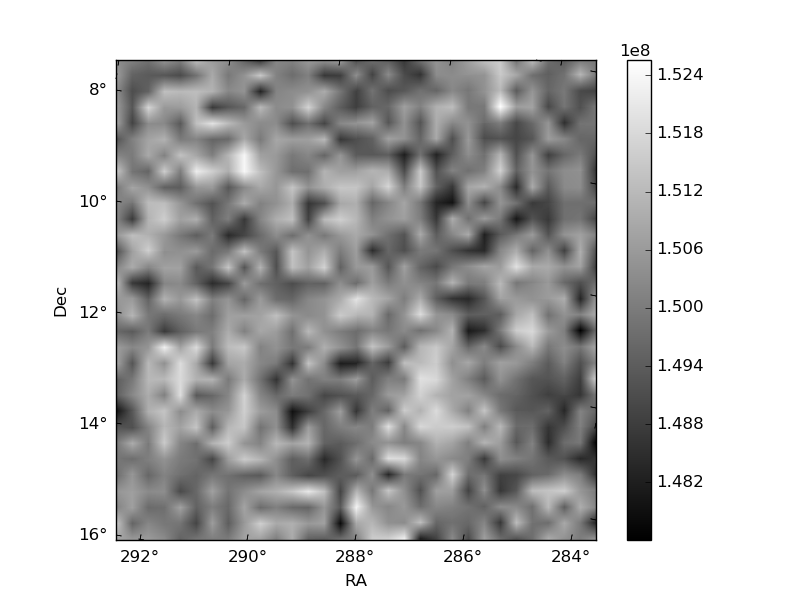
Quadrant B |
|---|---|---|---|
| Quadrant D | 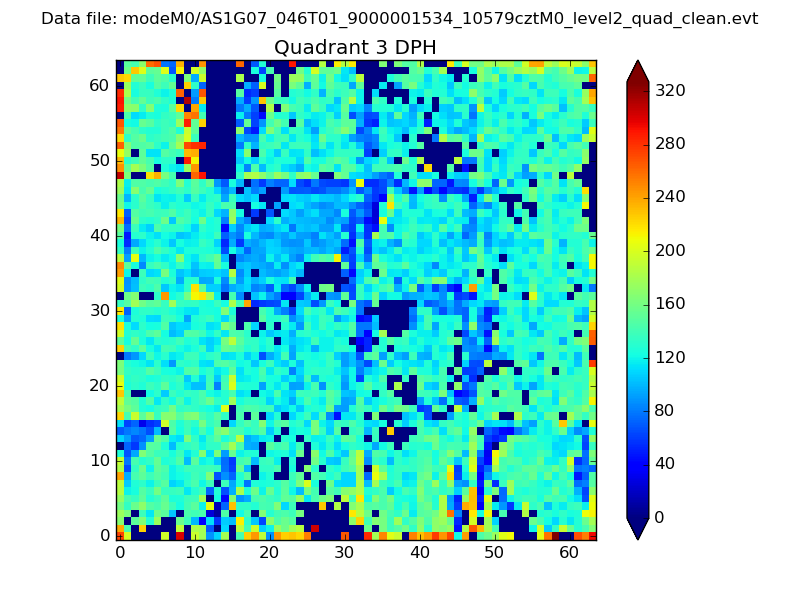 |
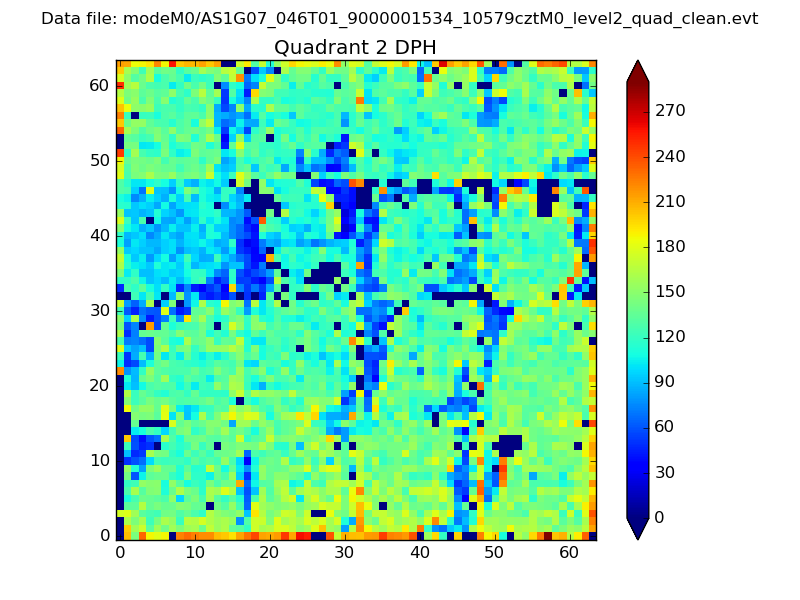 |
Quadrant C |
| Plot type | Count rate plots | Images |
|---|---|---|
| Comparison with Poisson distribution Blue bars denote a histogram of data divided into 1 sec bins. Red curve is a Poisson curve with rate = median count rate of data. |
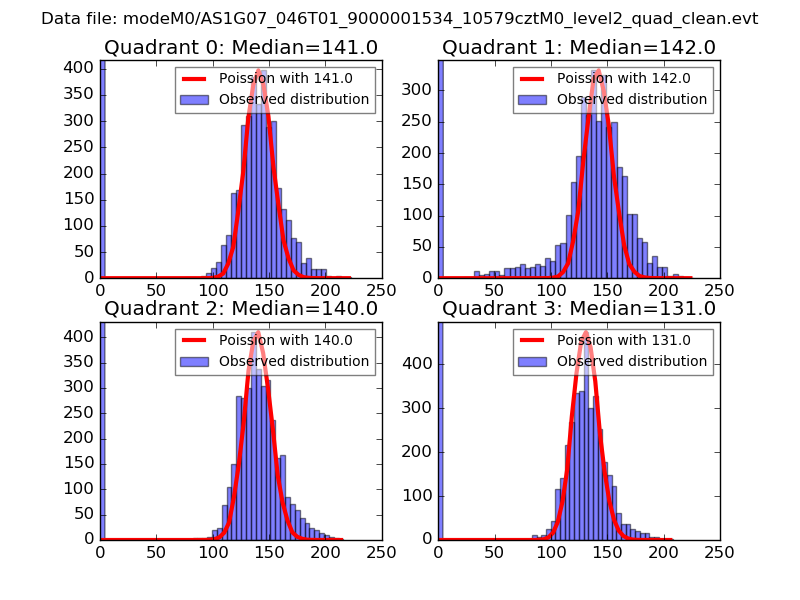 |
 |
| Quadrant-wise count rates Data is divided into 100 sec bins |
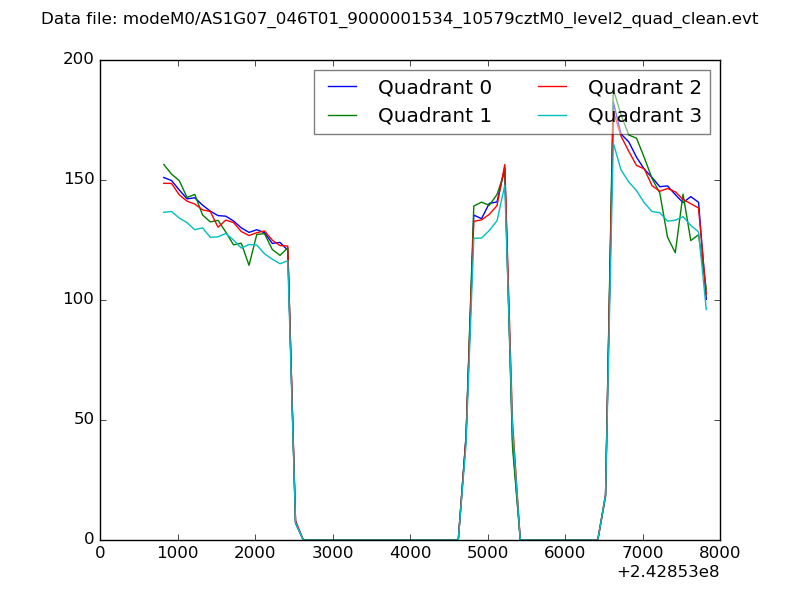 |
|
| Module-wise count rates for Quadrant A Data is divided into 100 sec bins |
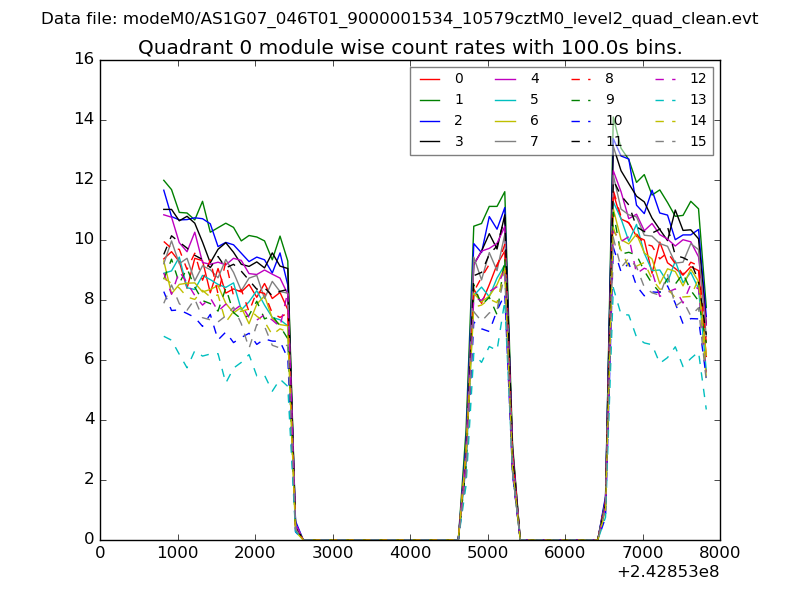 |
 |
| Module-wise count rates for Quadrant B Data is divided into 100 sec bins |
 |
 |
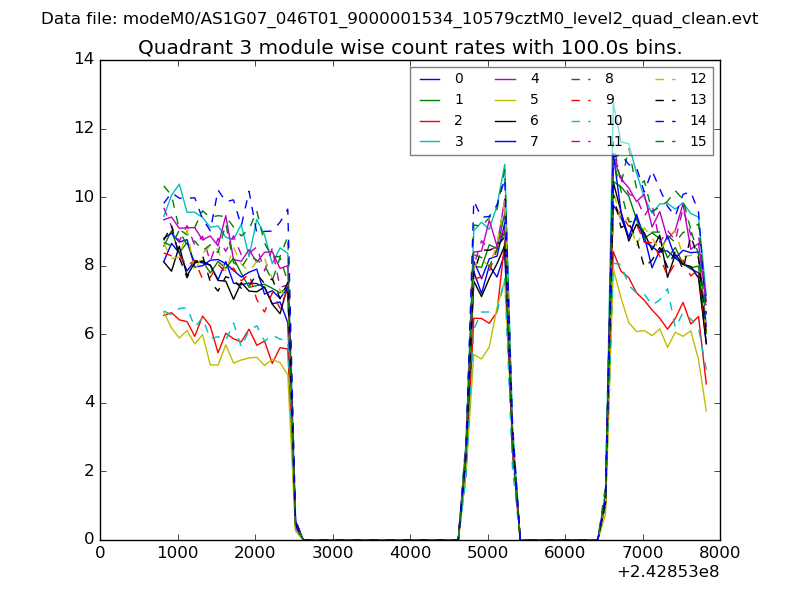
| Module-wise count rates for Quadrant C Data is divided into 100 sec bins |
 |
 |
| Module-wise count rates for Quadrant D Data is divided into 100 sec bins |
 |
 |
| Parameter | Plot |
|---|---|
| CZT HV Monitor | 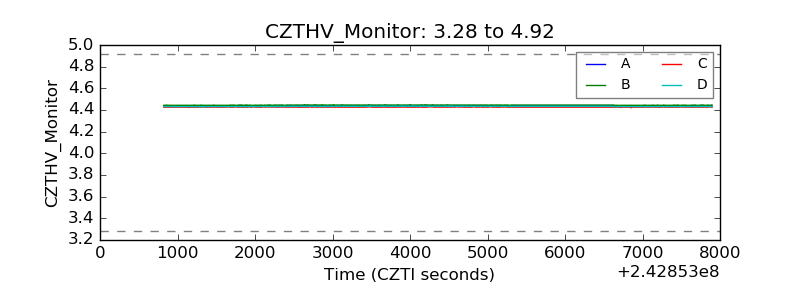 |
| D_VDD | 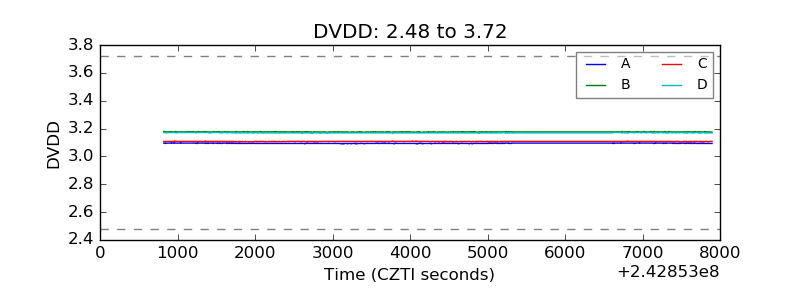 |
| Temperature 1 | 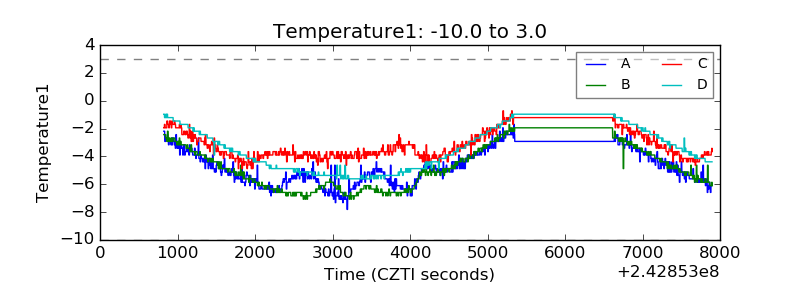 |
| Veto HV Monitor |  |
| Veto LLD | 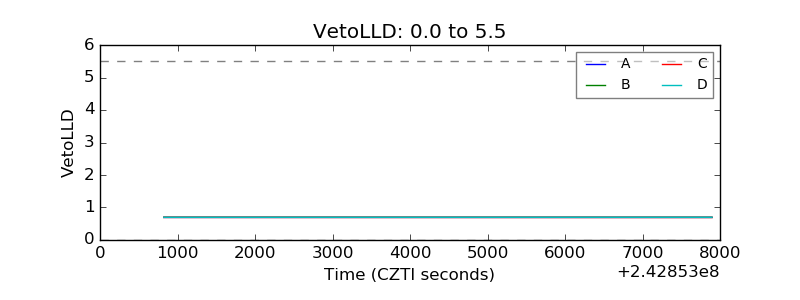 |
| Alpha Counter | 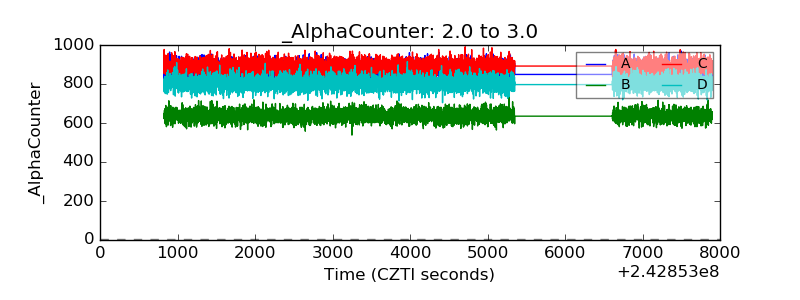 |
| _CPM_Rate | 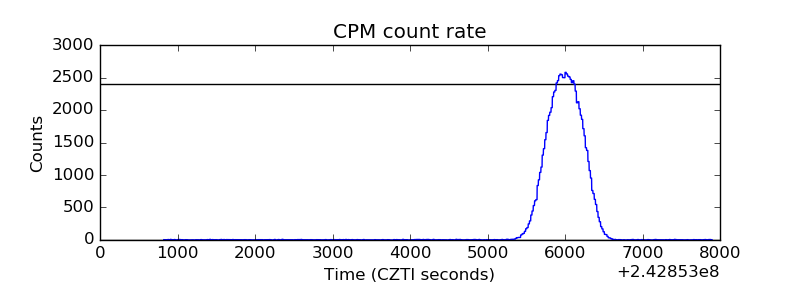 |
| CZT Counter | 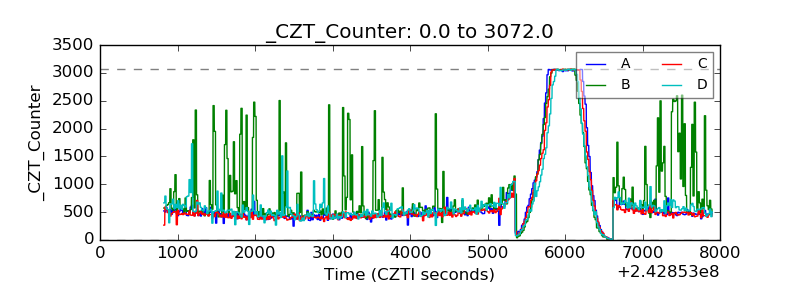 |
| +2.5 Volts monitor |  |
| +5 Volts monitor |  |
| _ROLL_ROT | 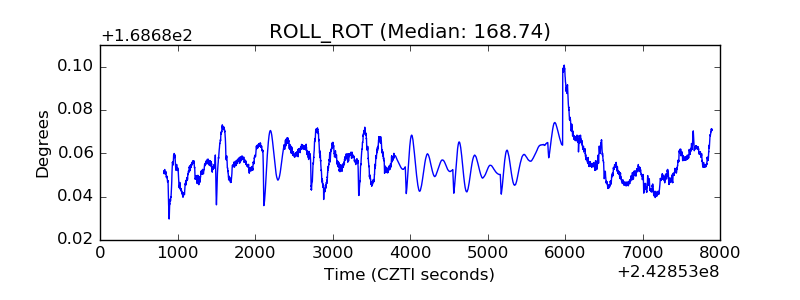 |
| _Roll_DEC | 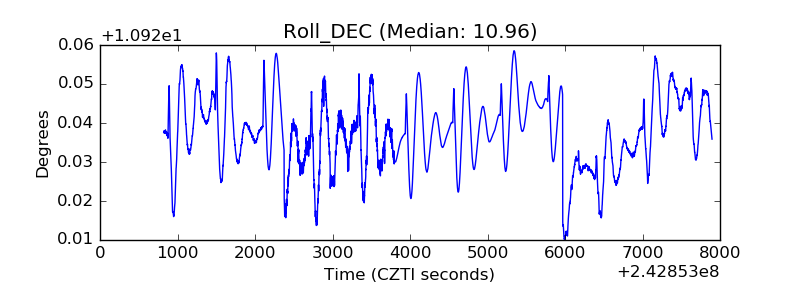 |
| _Roll_RA | 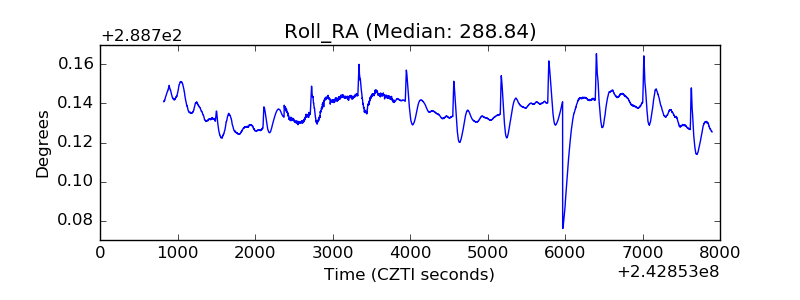 |
| Veto Counter | 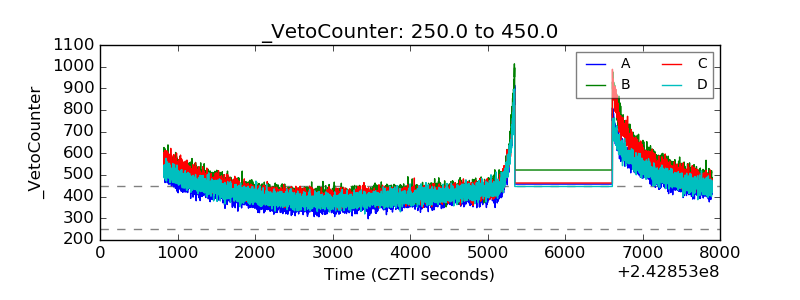 |