| Param | Original file | Final file |
|---|---|---|
| Filename | modeM0/AS1G07_046T01_9000001534_10582cztM0_level2.evt | modeM0/AS1G07_046T01_9000001534_10582cztM0_level2_quad_clean.evt |
| Size (bytes) | 501,390,720 | 72,478,080 |
| Size | 478.2 MB | 69.1 MB |
| Events in quadrant A | 3,039,549 | 451,071 |
| Events in quadrant B | 4,547,116 | 438,026 |
| Events in quadrant C | 2,929,103 | 445,785 |
| Events in quadrant D | 4,237,746 | 416,196 |
| Mode SS | |||
|---|---|---|---|
| Quadrant | BADHDUFLAG | Total packets | Discarded packets |
| A | 0 | 128 | 0 |
| B | 0 | 128 | 0 |
| C | 0 | 128 | 0 |
| D | 0 | 128 | 0 |
| Mode M0 | |||
|---|---|---|---|
| Quadrant | BADHDUFLAG | Total packets | Discarded packets |
| A | 0 | 13219 | 2 |
| B | 0 | 17521 | 1 |
| C | 0 | 12949 | 1 |
| D | 0 | 16991 | 1 |
| Mode M9 | |||
|---|---|---|---|
| Quadrant | BADHDUFLAG | Total packets | Discarded packets |
| A | 0 | 12 | 0 |
| B | 0 | 12 | 0 |
| C | 0 | 12 | 0 |
| D | 0 | 12 | 0 |
| Quadrant | Total seconds | Saturated seconds | Saturation percentage |
|---|---|---|---|
| A | 6357 | 17 | 0.267422% |
| B | 6357 | 461 | 7.251848% |
| C | 6357 | 7 | 0.110115% |
| D | 6357 | 17 | 0.267422% |
Noise dominated data is calculated using 1-second bins in cleaned event files. If a bin has >2000 counts, and if more than 50% of those come from <1% of pixels, then it is considered to be noise-dominated and hence unusable.
| Quadrant | # 1 sec bins | Bins with >0 counts | Bins with >2000 counts | High rate bins dominated by noise | Noise dominated (total time) | Noise dominated (detector-on time) | Marked lightcurve |
|---|---|---|---|---|---|---|---|
| A | 7517 | 6358 | 0 | 0 | 0.00% | 0.00% | 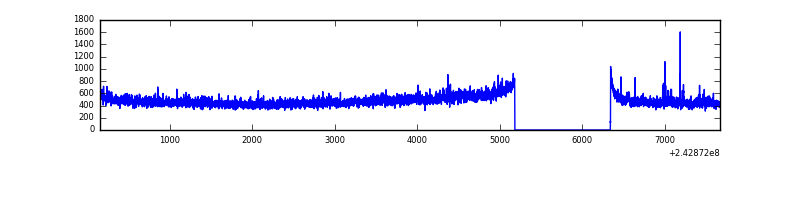 |
| B | 7517 | 6358 | 281 | 281 | 3.74% | 4.42% | 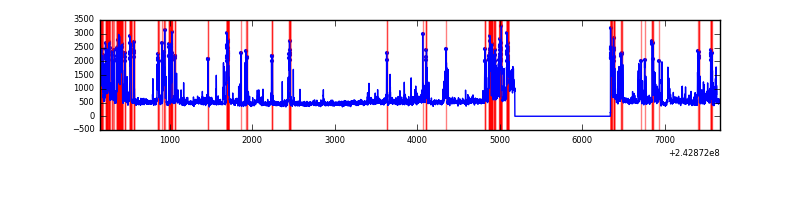 |
| C | 7517 | 6358 | 0 | 0 | 0.00% | 0.00% | 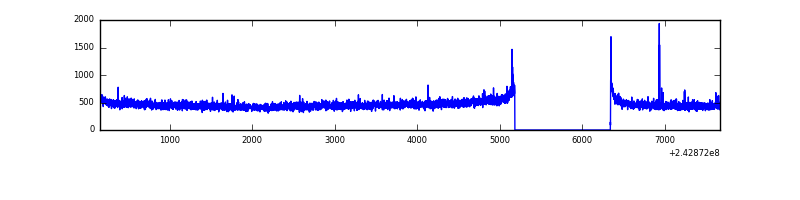 |
| D | 7517 | 6358 | 9 | 9 | 0.12% | 0.14% | 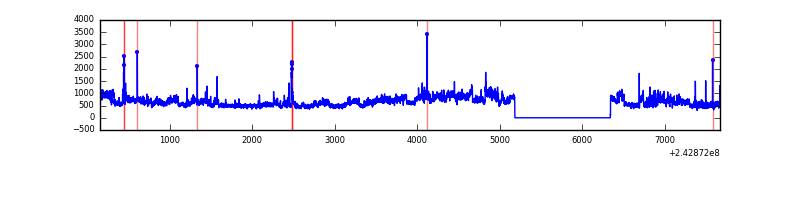 |
Top three noisy pixels from each quadrant. If the there are fewer than three noisy pixels in the level2.evt file, extra rows are filled as -1
| Pixel properties | Quadrant properties | ||||||
|---|---|---|---|---|---|---|---|
| Quadrant | DetID | PixID | Counts | Sigma | Mean | Median | Sigma |
| A | 13 | 251 | 83129 | 529.46 | 762 | 746 | 155.6 |
| A | 1 | 162 | 15049 | 91.92 | 762 | 746 | 155.6 |
| A | 0 | 226 | 6887 | 39.47 | 762 | 746 | 155.6 |
| B | 4 | 239 | 1335804 | 9322.06 | 751 | 733 | 143.2 |
| B | 0 | 219 | 158408 | 1100.96 | 751 | 733 | 143.2 |
| B | 4 | 81 | 43986 | 302.01 | 751 | 733 | 143.2 |
| C | 14 | 67 | 17709 | 98.68 | 740 | 744 | 171.9 |
| C | 4 | 254 | 10261 | 55.36 | 740 | 744 | 171.9 |
| C | 4 | 175 | 7662 | 40.24 | 740 | 744 | 171.9 |
| D | 2 | 16 | 1069528 | 6063.89 | 726 | 706 | 176.3 |
| D | 8 | 195 | 300481 | 1700.75 | 726 | 706 | 176.3 |
| D | 9 | 85 | 46167 | 257.92 | 726 | 706 | 176.3 |
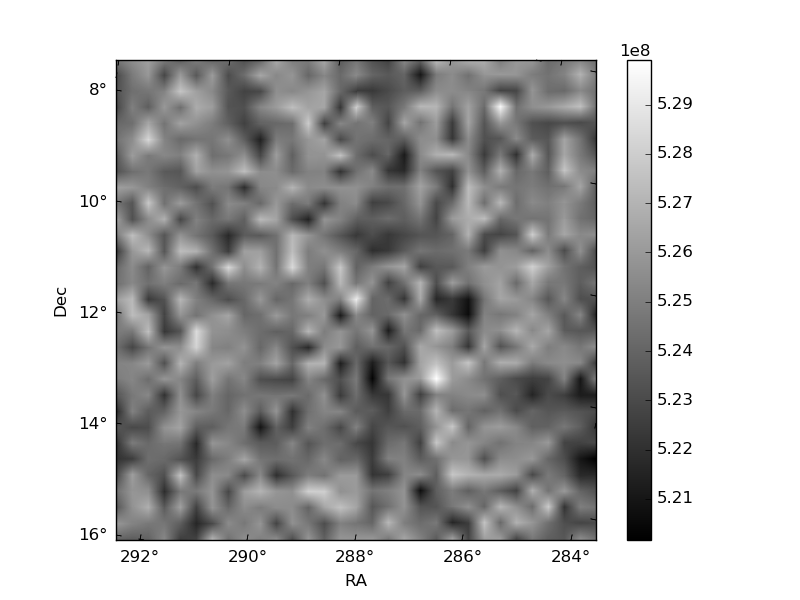
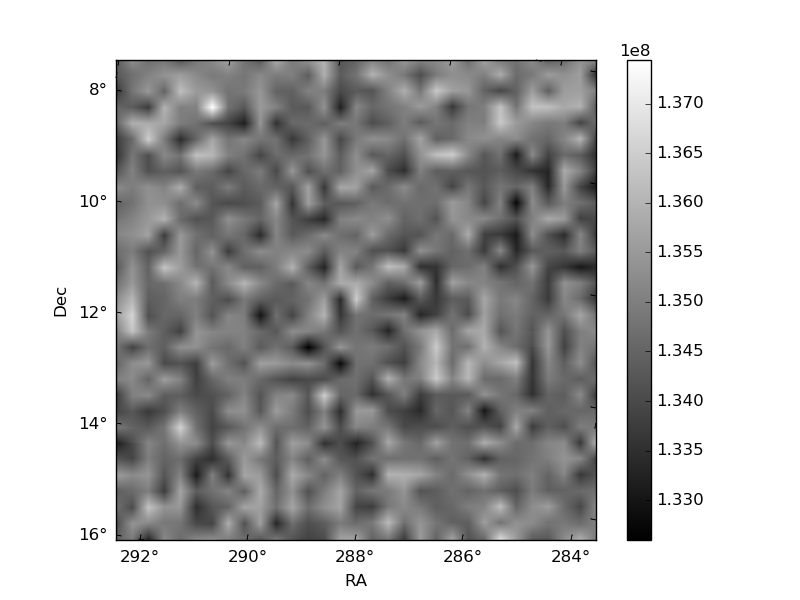
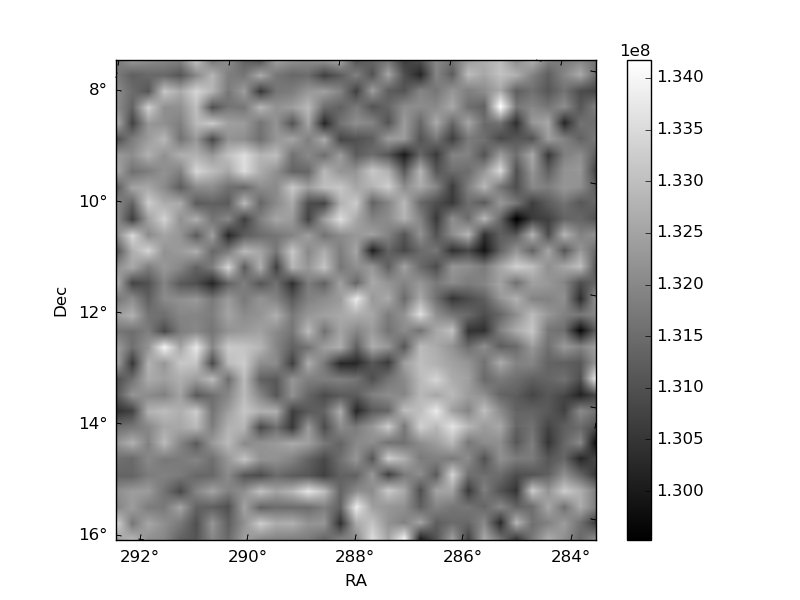
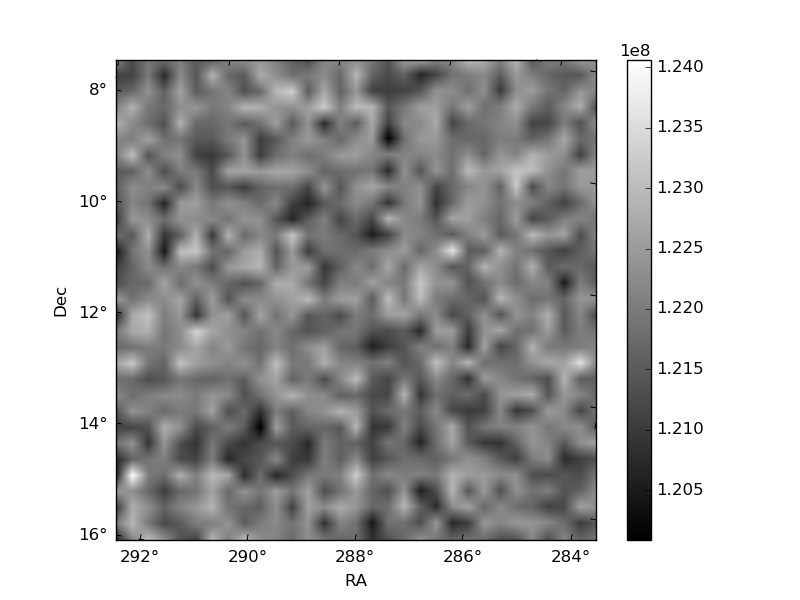
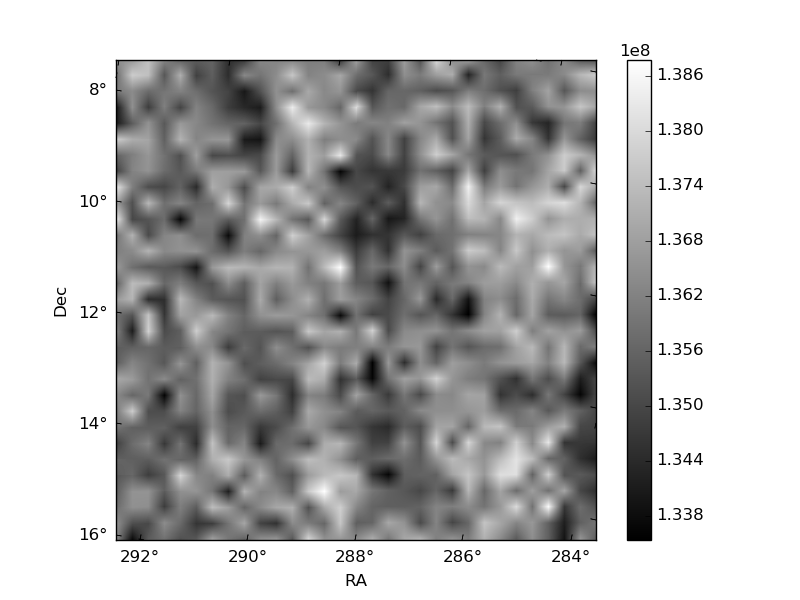
Histogram calculated using DETX and DETY for each event in the final _common_clean file
| Quadrant A | 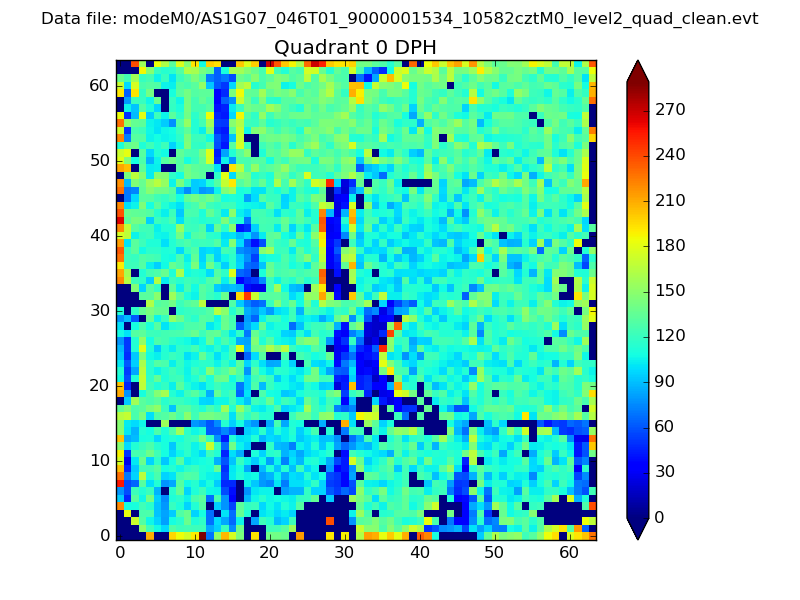 |
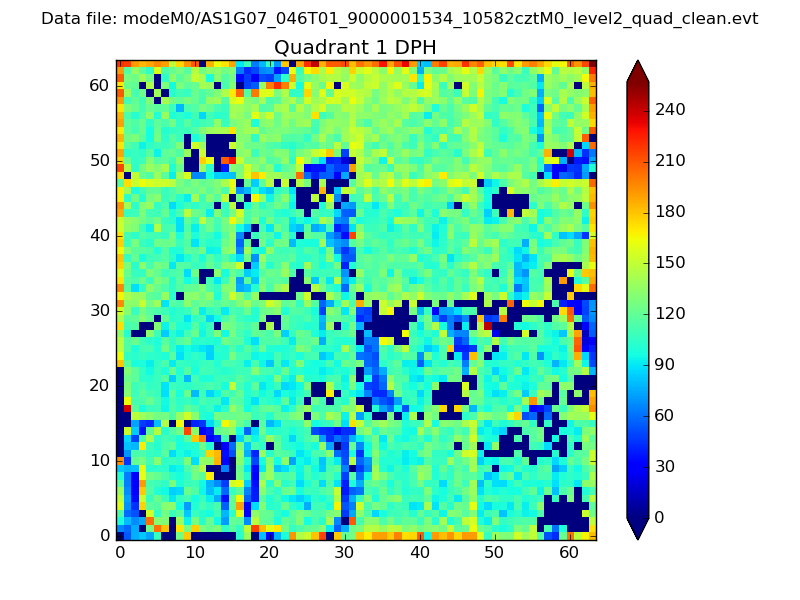 |
Quadrant B |
|---|---|---|---|
| Quadrant D | 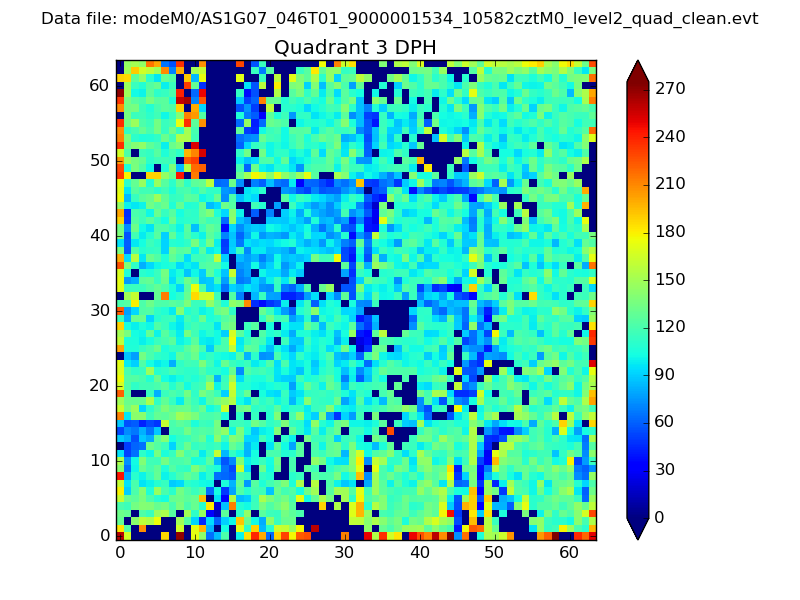 |
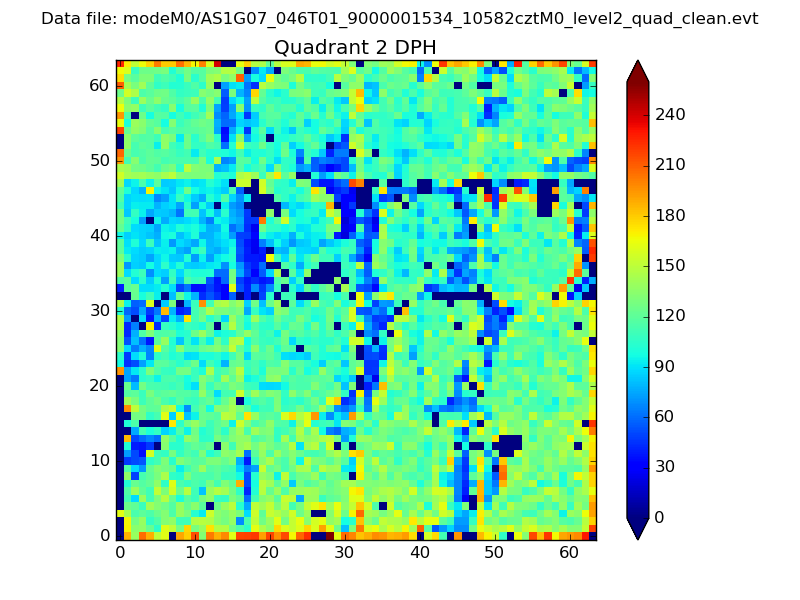 |
Quadrant C |
| Plot type | Count rate plots | Images |
|---|---|---|
| Comparison with Poisson distribution Blue bars denote a histogram of data divided into 1 sec bins. Red curve is a Poisson curve with rate = median count rate of data. |
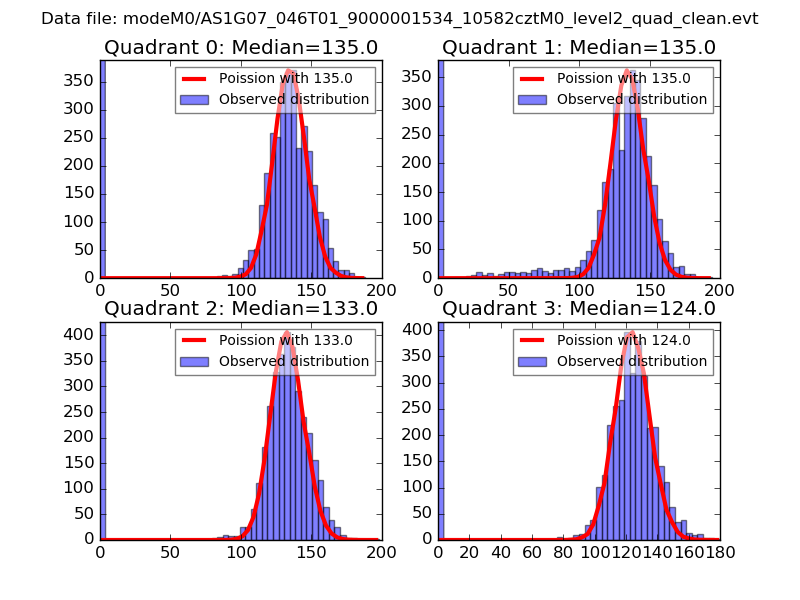 |
 |
| Quadrant-wise count rates Data is divided into 100 sec bins |
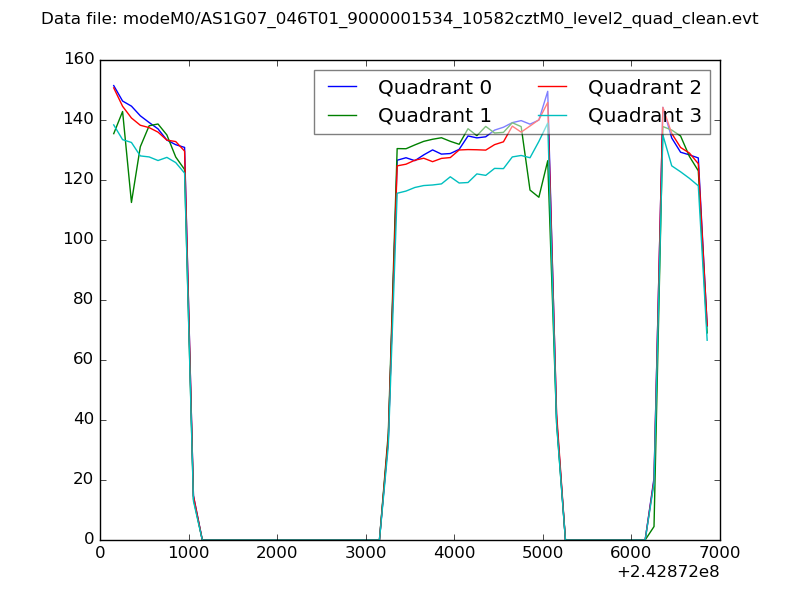 |
|
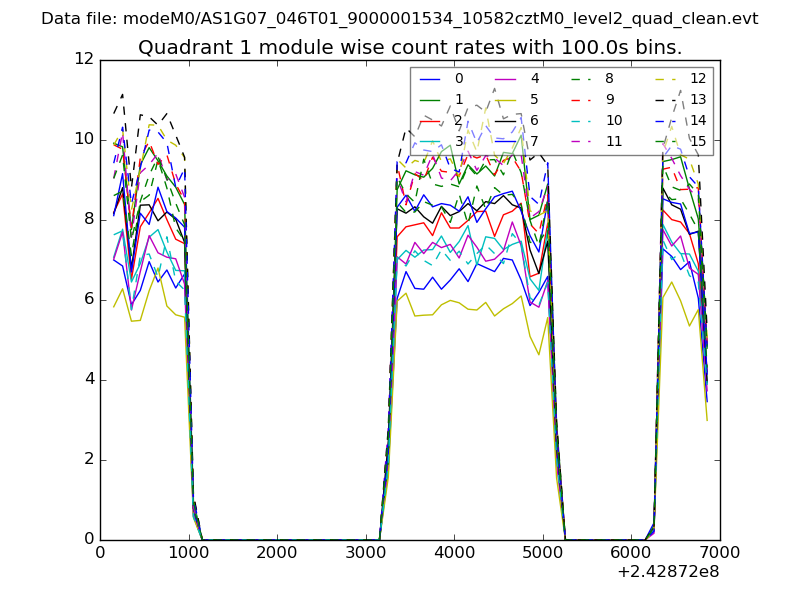
| Module-wise count rates for Quadrant A Data is divided into 100 sec bins |
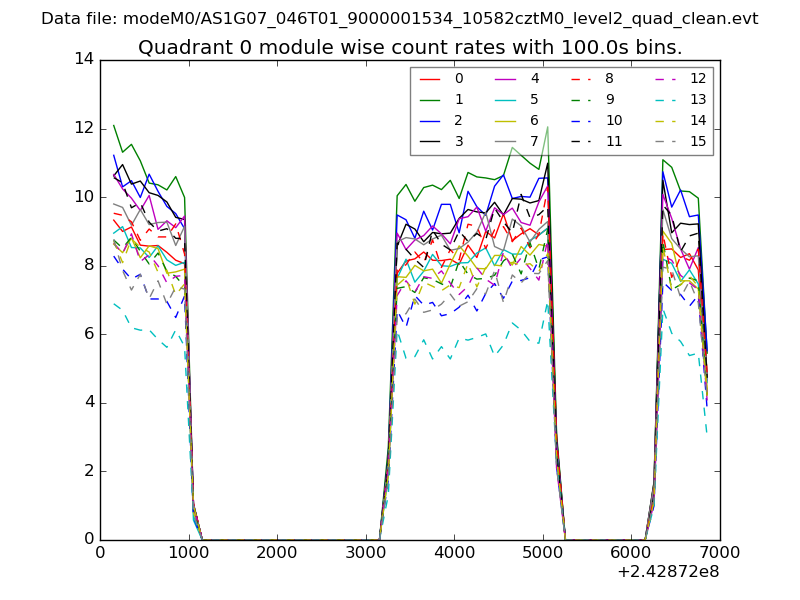 |
 |
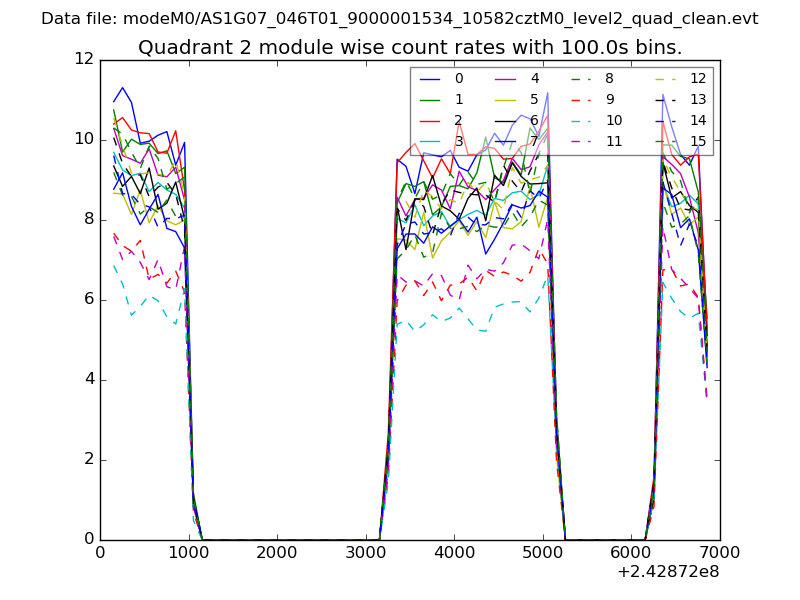
| Module-wise count rates for Quadrant B Data is divided into 100 sec bins |
 |
 |
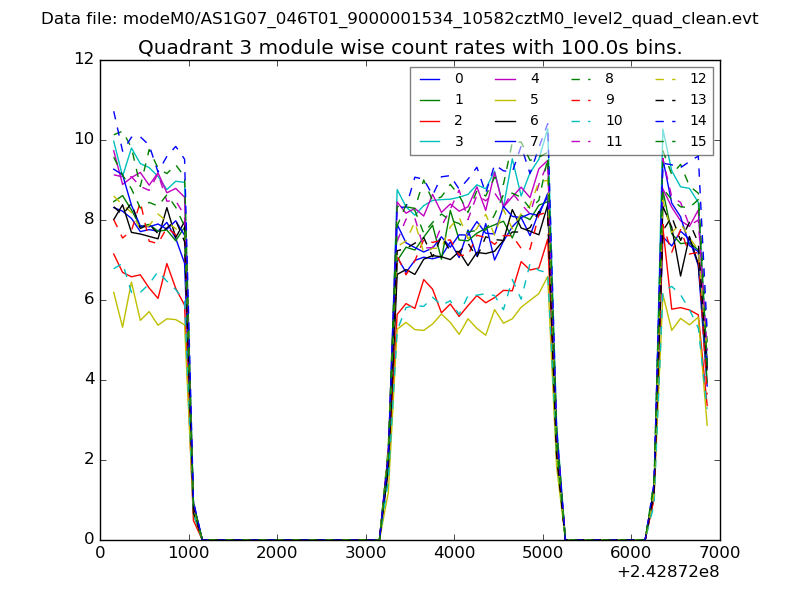
| Module-wise count rates for Quadrant C Data is divided into 100 sec bins |
 |
 |
| Module-wise count rates for Quadrant D Data is divided into 100 sec bins |
 |
 |
| Parameter | Plot |
|---|---|
| CZT HV Monitor | 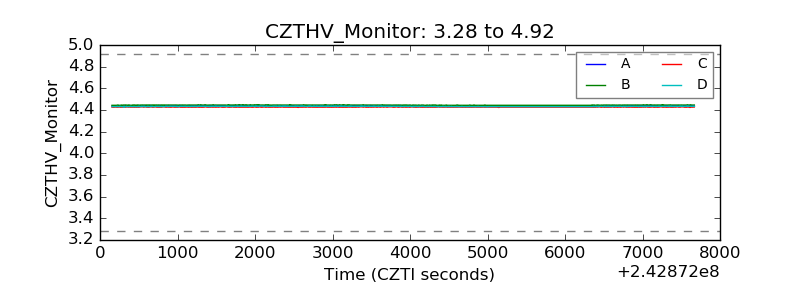 |
| D_VDD | 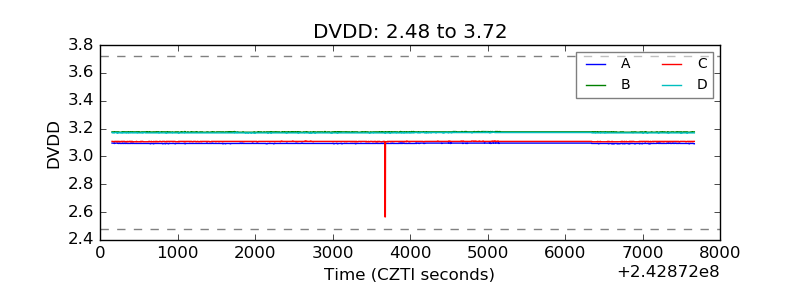 |
| Temperature 1 | 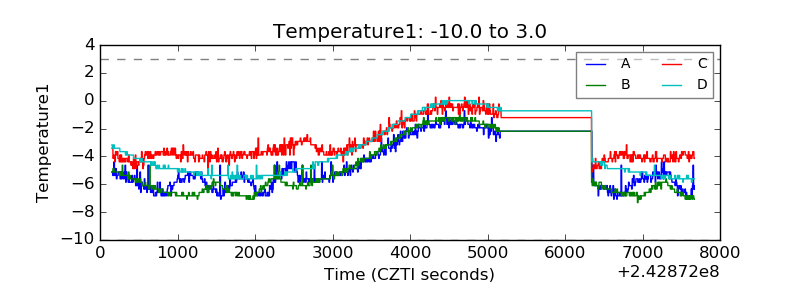 |
| Veto HV Monitor | 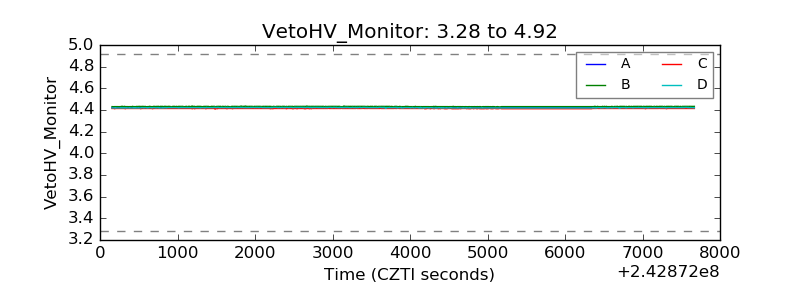 |
| Veto LLD | 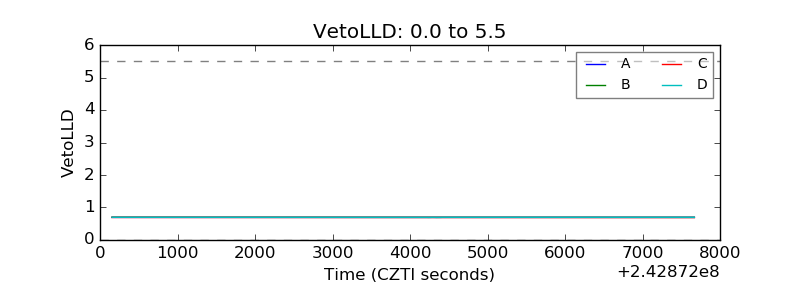 |
| Alpha Counter | 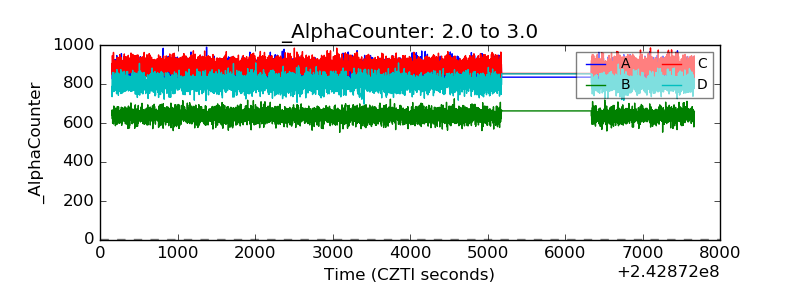 |
| _CPM_Rate | 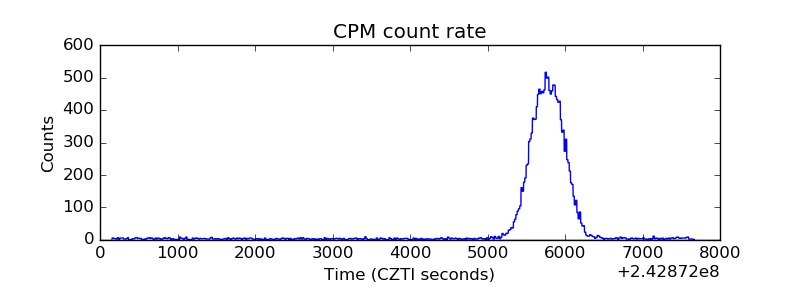 |
| CZT Counter | 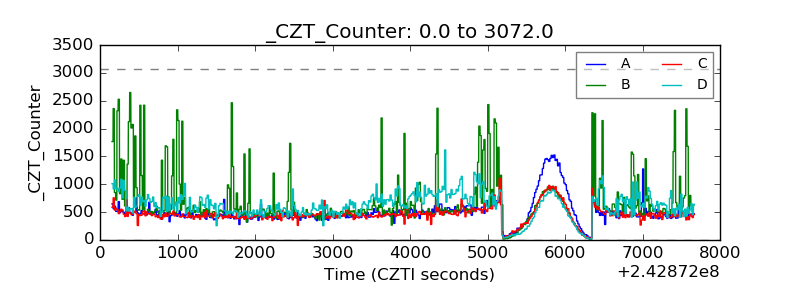 |
| +2.5 Volts monitor |  |
| +5 Volts monitor |  |
| _ROLL_ROT | 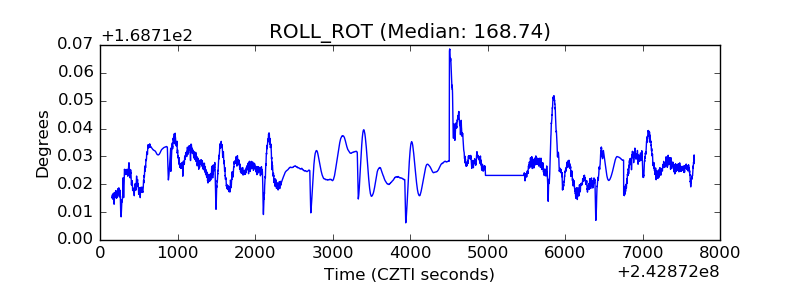 |
| _Roll_DEC | 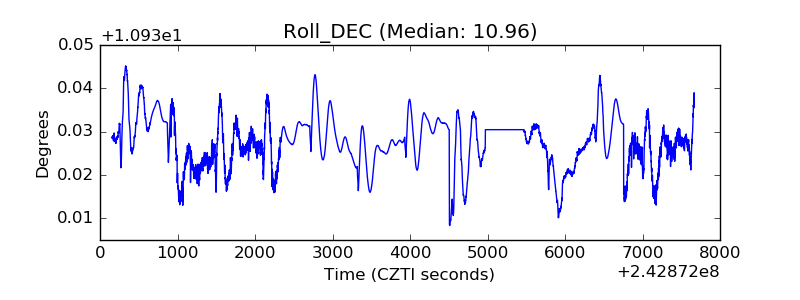 |
| _Roll_RA | 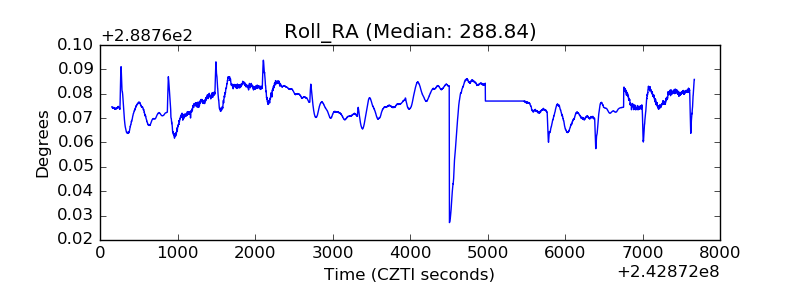 |
| Veto Counter | 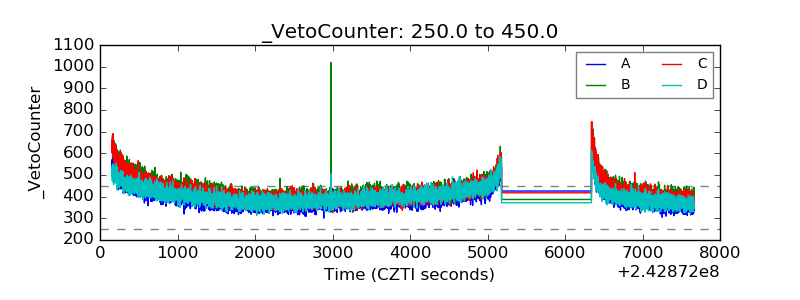 |