| Param | Original file | Final file |
|---|---|---|
| Filename | modeM0/AS1G07_046T01_9000001534_10583cztM0_level2.evt | modeM0/AS1G07_046T01_9000001534_10583cztM0_level2_quad_clean.evt |
| Size (bytes) | 559,131,840 | 73,045,440 |
| Size | 533.2 MB | 69.7 MB |
| Events in quadrant A | 3,409,576 | 443,401 |
| Events in quadrant B | 4,830,049 | 434,546 |
| Events in quadrant C | 3,246,251 | 441,233 |
| Events in quadrant D | 4,975,794 | 407,646 |
| Mode SS | |||
|---|---|---|---|
| Quadrant | BADHDUFLAG | Total packets | Discarded packets |
| A | 0 | 140 | 0 |
| B | 0 | 140 | 0 |
| C | 0 | 140 | 0 |
| D | 0 | 140 | 0 |
| Mode M0 | |||
|---|---|---|---|
| Quadrant | BADHDUFLAG | Total packets | Discarded packets |
| A | 0 | 14740 | 3 |
| B | 0 | 18800 | 2 |
| C | 0 | 14452 | 2 |
| D | 0 | 19608 | 2 |
| Mode M9 | |||
|---|---|---|---|
| Quadrant | BADHDUFLAG | Total packets | Discarded packets |
| A | 0 | 16 | 0 |
| B | 0 | 16 | 0 |
| C | 0 | 16 | 0 |
| D | 0 | 17 | 0 |
| Quadrant | Total seconds | Saturated seconds | Saturation percentage |
|---|---|---|---|
| A | 6962 | 71 | 1.019822% |
| B | 6962 | 422 | 6.061477% |
| C | 6962 | 32 | 0.459638% |
| D | 6962 | 138 | 1.982189% |
Noise dominated data is calculated using 1-second bins in cleaned event files. If a bin has >2000 counts, and if more than 50% of those come from <1% of pixels, then it is considered to be noise-dominated and hence unusable.
| Quadrant | # 1 sec bins | Bins with >0 counts | Bins with >2000 counts | High rate bins dominated by noise | Noise dominated (total time) | Noise dominated (detector-on time) | Marked lightcurve |
|---|---|---|---|---|---|---|---|
| A | 7722 | 6963 | 1 | 1 | 0.01% | 0.01% | 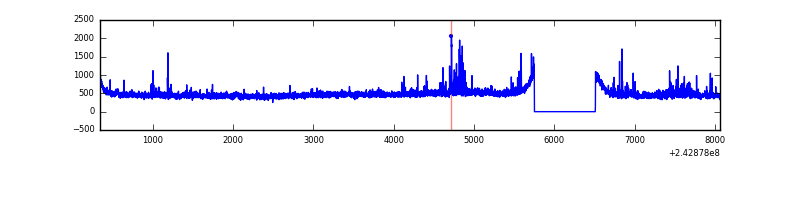 |
| B | 7722 | 6963 | 205 | 205 | 2.65% | 2.94% | 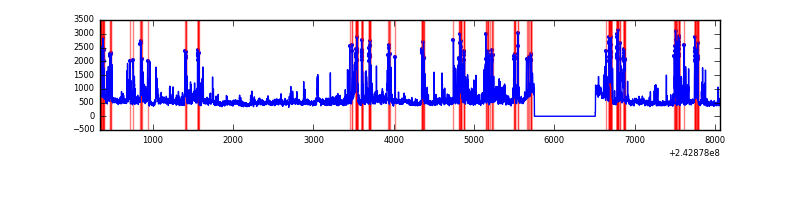 |
| C | 7722 | 6963 | 4 | 4 | 0.05% | 0.06% | 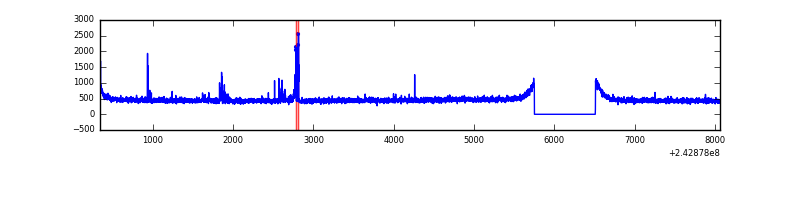 |
| D | 7722 | 6963 | 66 | 66 | 0.85% | 0.95% | 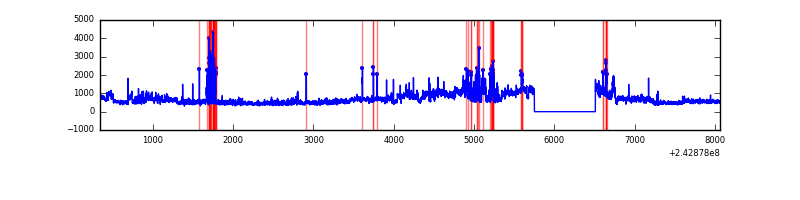 |
Top three noisy pixels from each quadrant. If the there are fewer than three noisy pixels in the level2.evt file, extra rows are filled as -1
| Pixel properties | Quadrant properties | ||||||
|---|---|---|---|---|---|---|---|
| Quadrant | DetID | PixID | Counts | Sigma | Mean | Median | Sigma |
| A | 13 | 251 | 169647 | 993.75 | 831 | 813 | 169.9 |
| A | 1 | 162 | 14962 | 83.28 | 831 | 813 | 169.9 |
| A | 13 | 248 | 13825 | 76.59 | 831 | 813 | 169.9 |
| B | 4 | 239 | 1197193 | 7487.09 | 825 | 806 | 159.8 |
| B | 0 | 219 | 272340 | 1699.28 | 825 | 806 | 159.8 |
| B | 11 | 51 | 74068 | 458.48 | 825 | 806 | 159.8 |
| C | 4 | 254 | 68659 | 358.28 | 809 | 812 | 189.4 |
| C | 4 | 175 | 14500 | 72.28 | 809 | 812 | 189.4 |
| C | 14 | 234 | 6367 | 29.33 | 809 | 812 | 189.4 |
| D | 2 | 16 | 1392470 | 7264.15 | 791 | 769 | 191.6 |
| D | 1 | 52 | 308970 | 1608.69 | 791 | 769 | 191.6 |
| D | 8 | 195 | 156294 | 811.78 | 791 | 769 | 191.6 |
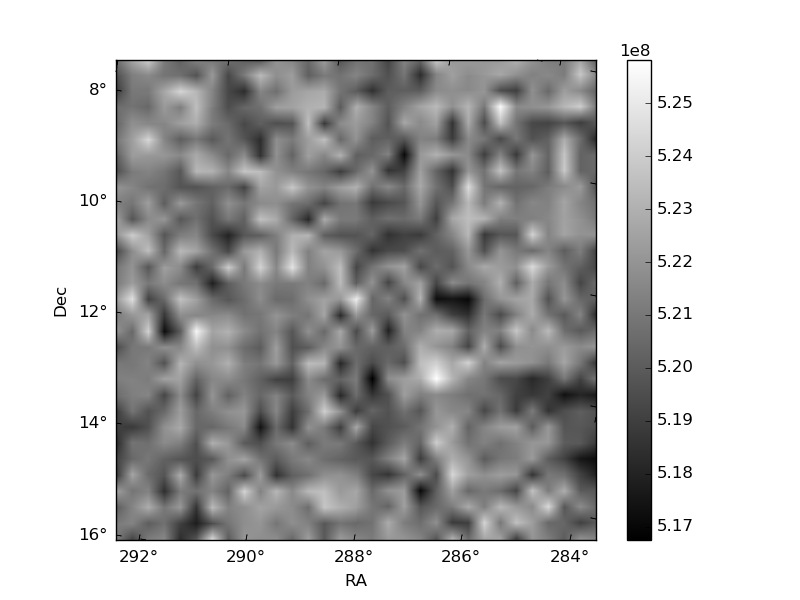
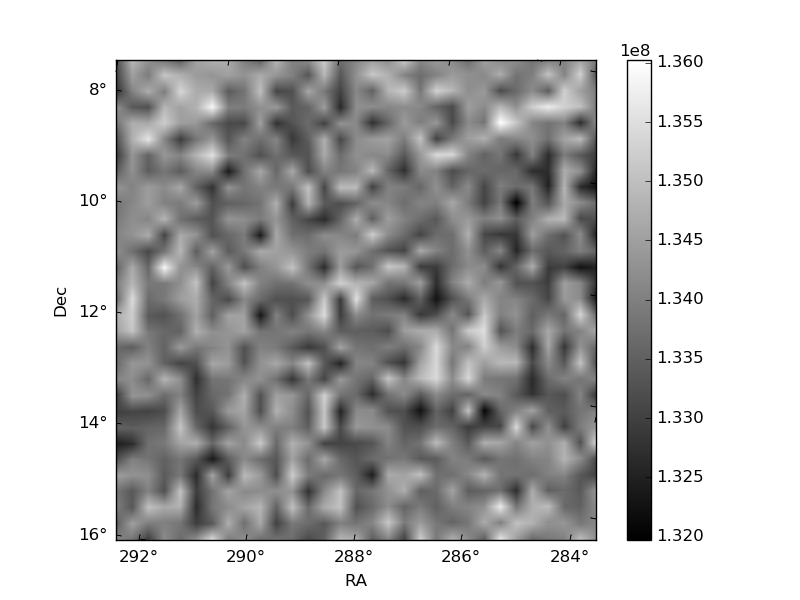
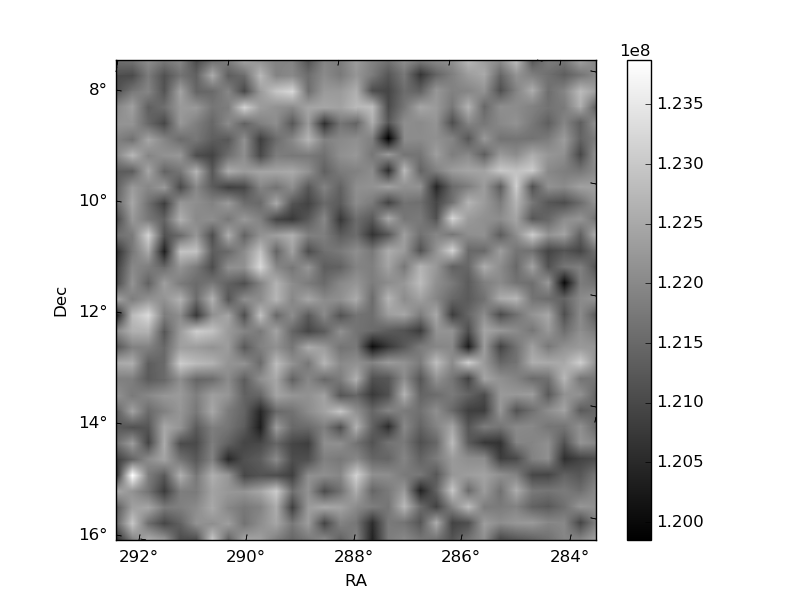
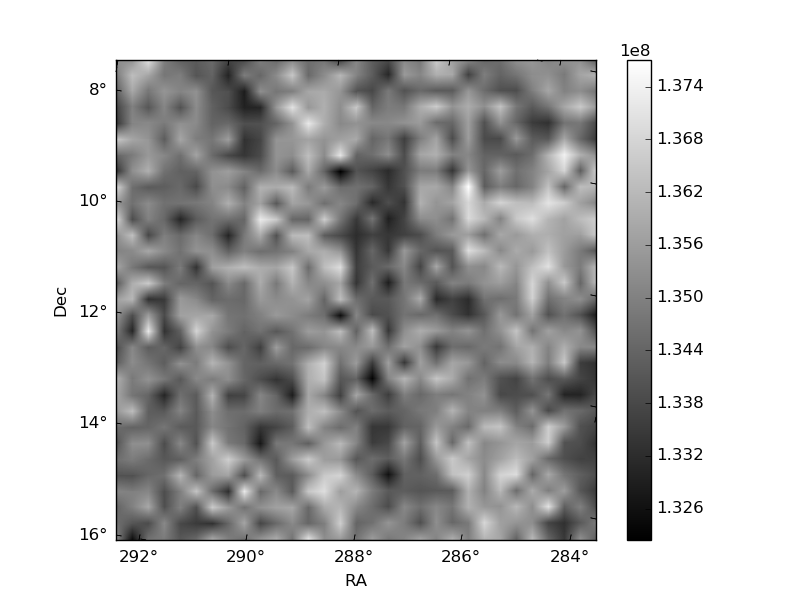
Histogram calculated using DETX and DETY for each event in the final _common_clean file
| Quadrant A | 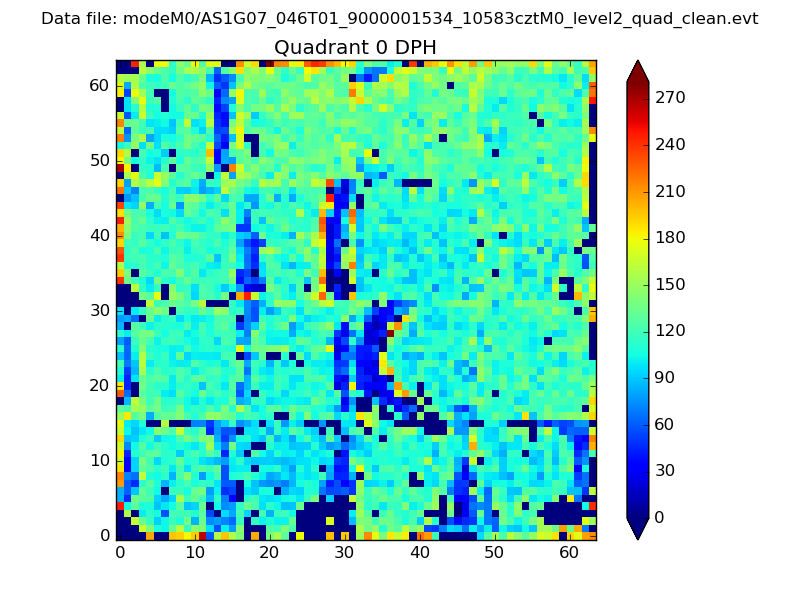 |
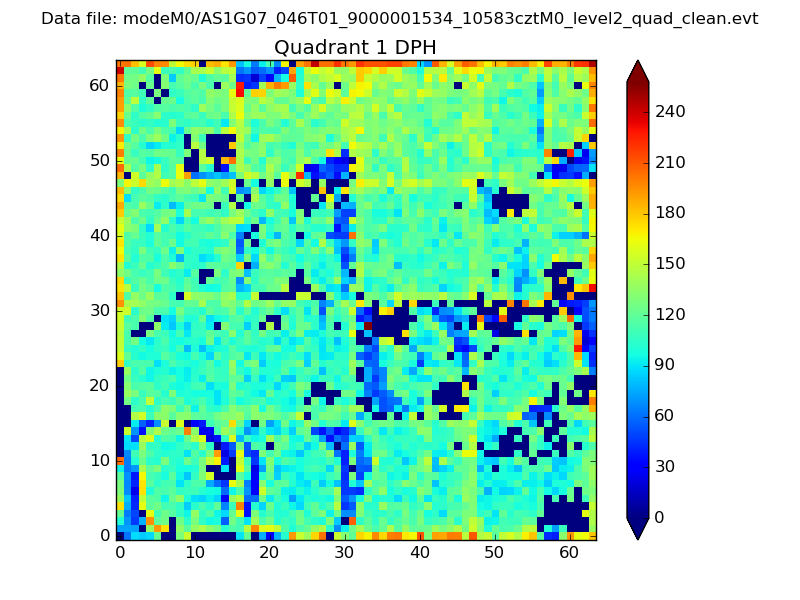 |
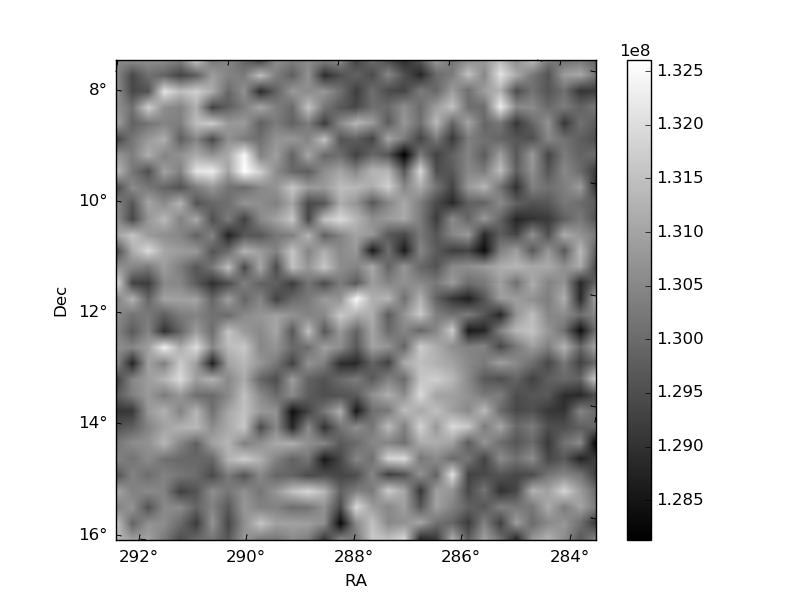
Quadrant B |
|---|---|---|---|
| Quadrant D | 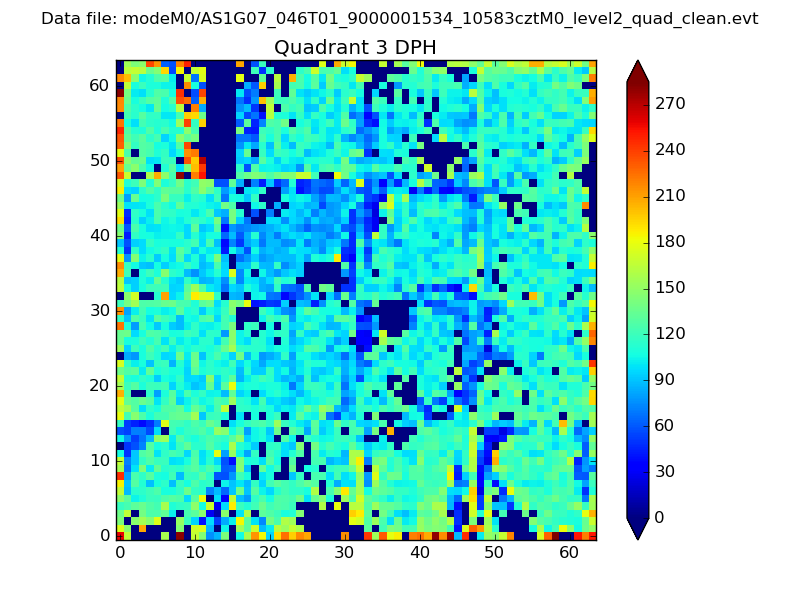 |
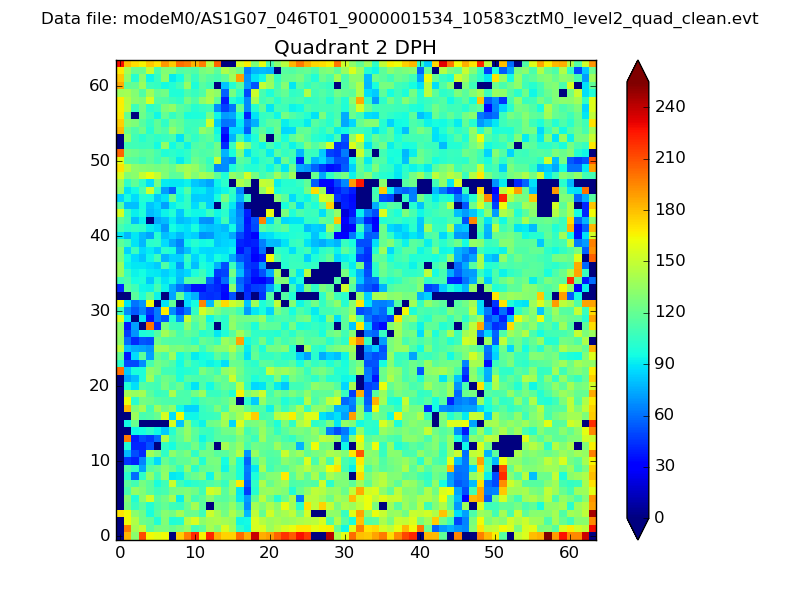 |
Quadrant C |
| Plot type | Count rate plots | Images |
|---|---|---|
| Comparison with Poisson distribution Blue bars denote a histogram of data divided into 1 sec bins. Red curve is a Poisson curve with rate = median count rate of data. |
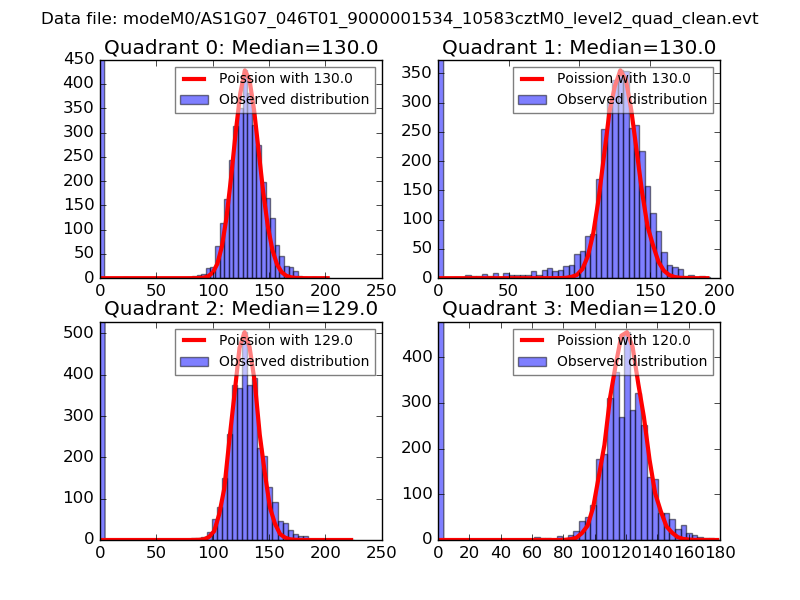 |
 |
| Quadrant-wise count rates Data is divided into 100 sec bins |
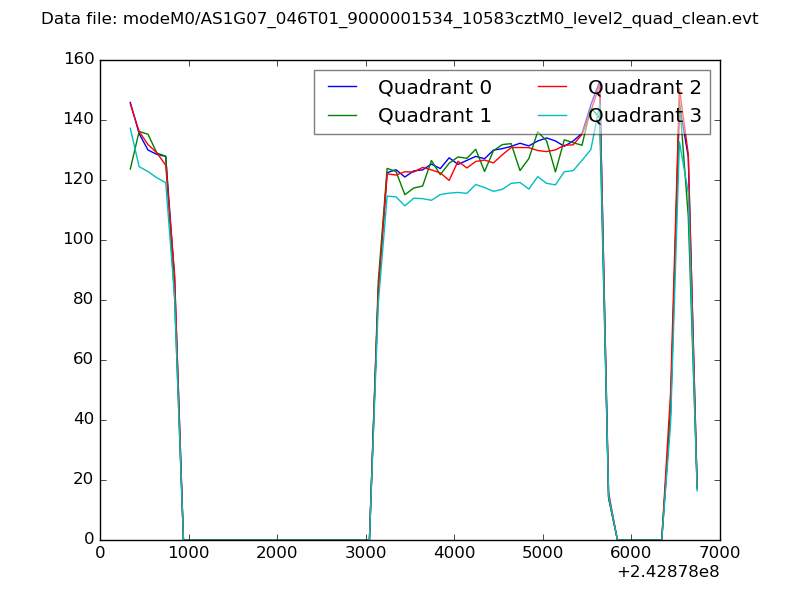 |
|
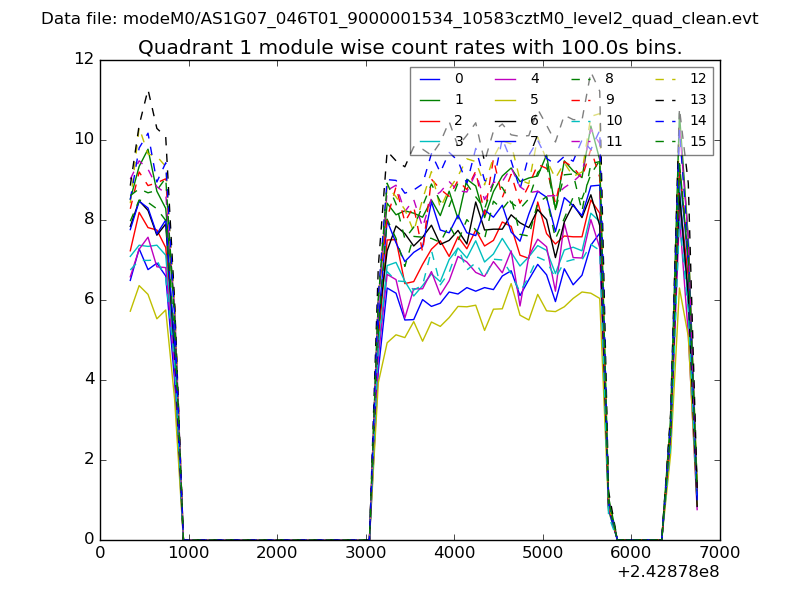
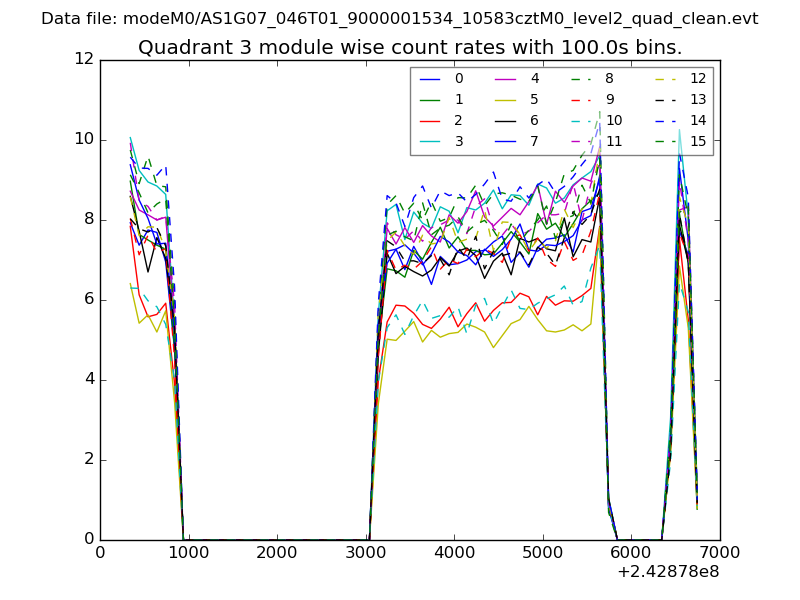
| Module-wise count rates for Quadrant A Data is divided into 100 sec bins |
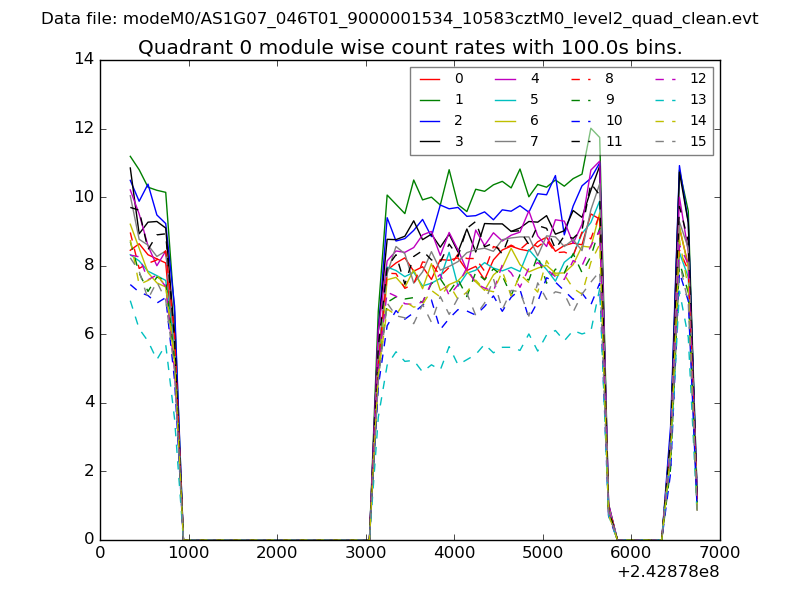 |
 |
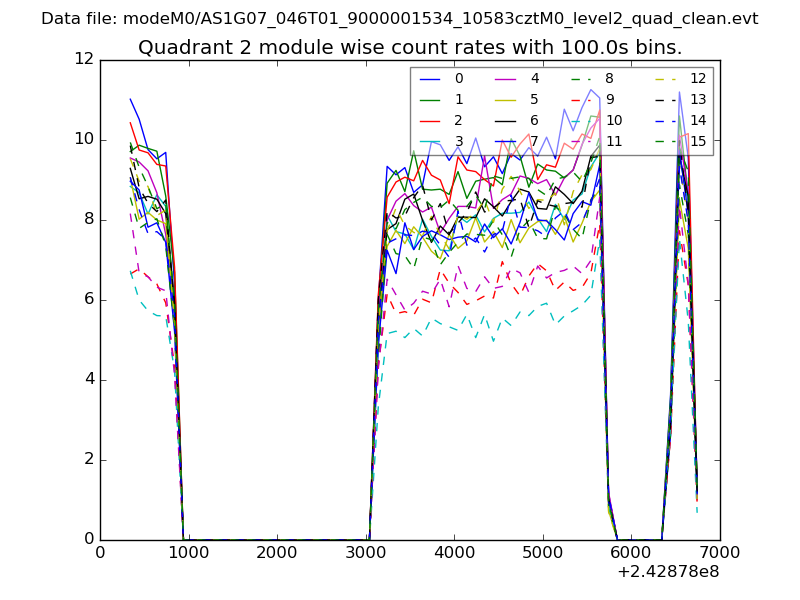
| Module-wise count rates for Quadrant B Data is divided into 100 sec bins |
 |
 |
| Module-wise count rates for Quadrant C Data is divided into 100 sec bins |
 |
 |
| Module-wise count rates for Quadrant D Data is divided into 100 sec bins |
 |
 |
| Parameter | Plot |
|---|---|
| CZT HV Monitor | 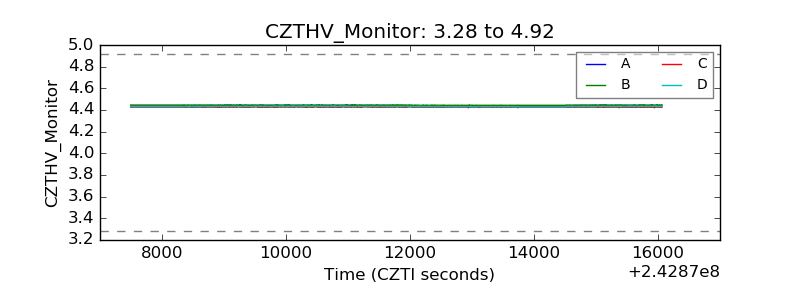 |
| D_VDD | 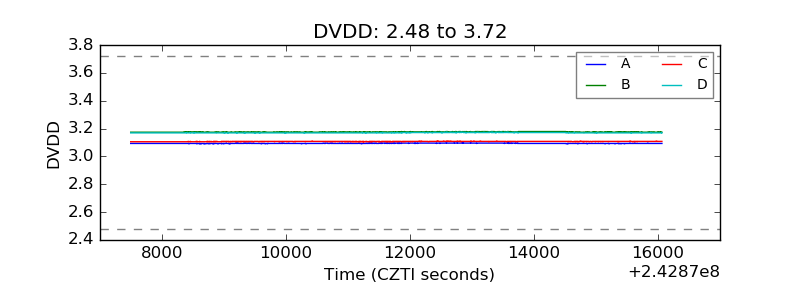 |
| Temperature 1 | 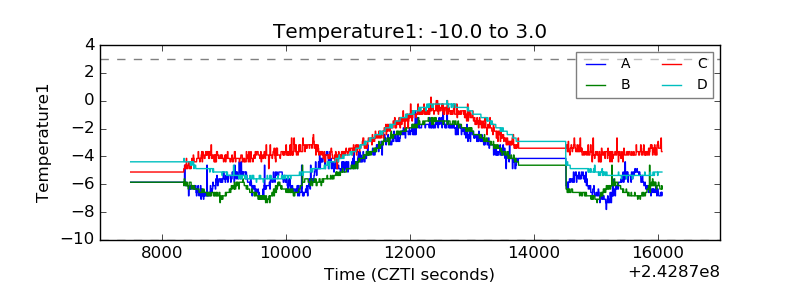 |
| Veto HV Monitor |  |
| Veto LLD | 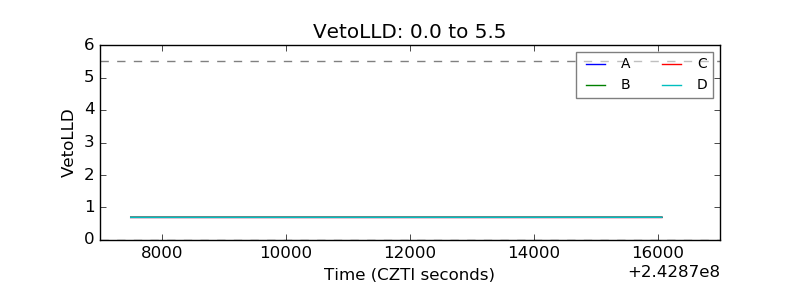 |
| Alpha Counter | 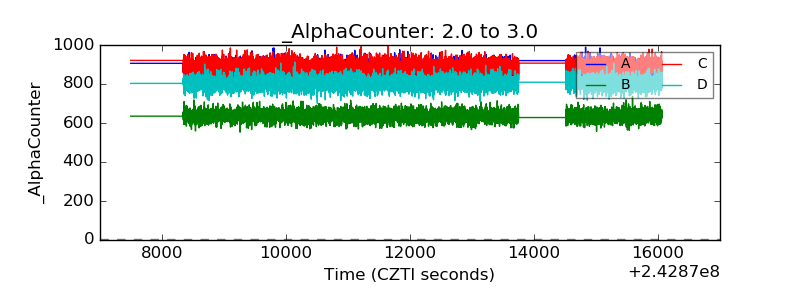 |
| _CPM_Rate | 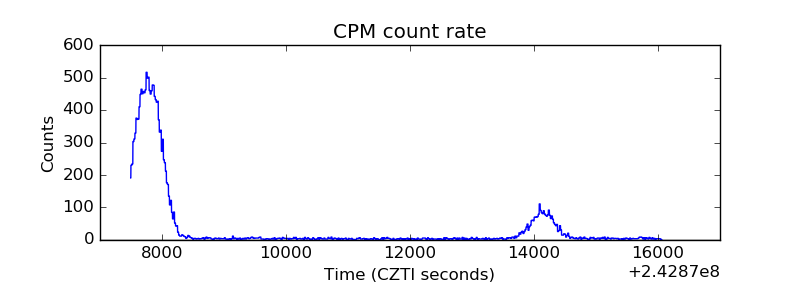 |
| CZT Counter | 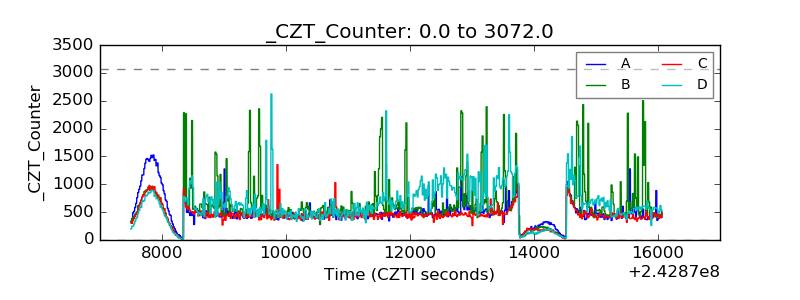 |
| +2.5 Volts monitor |  |
| +5 Volts monitor | 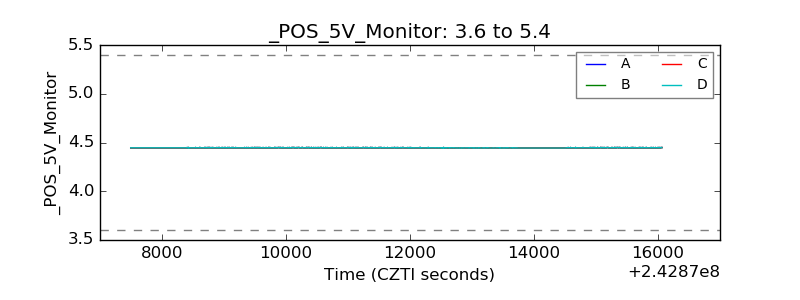 |
| _ROLL_ROT | 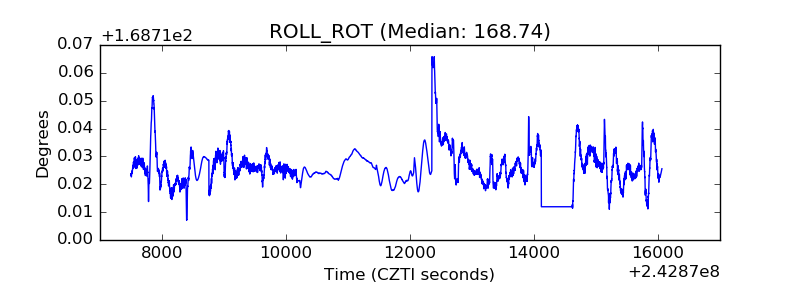 |
| _Roll_DEC | 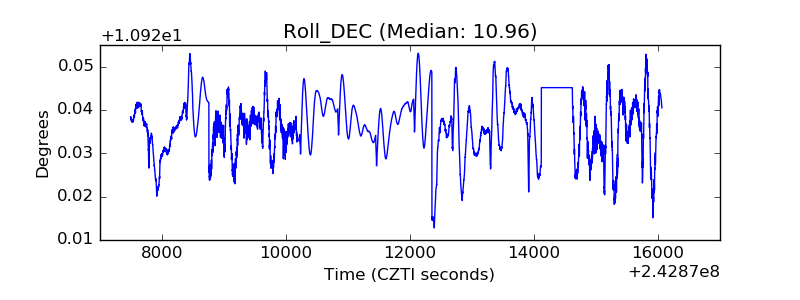 |
| _Roll_RA | 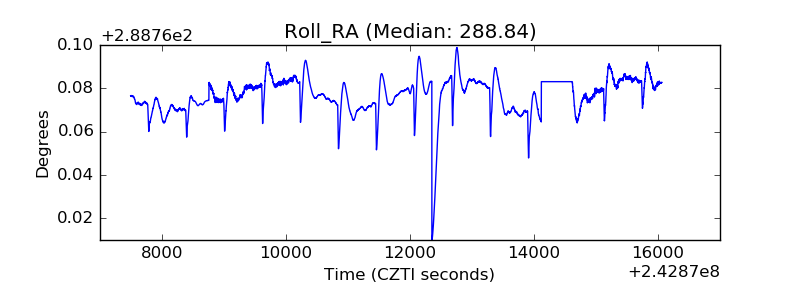 |
| Veto Counter | 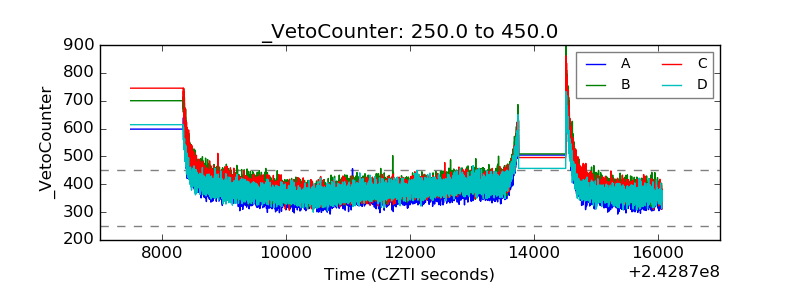 |