| Param | Original file | Final file |
|---|---|---|
| Filename | modeM0/AS1G07_046T01_9000001534_10584cztM0_level2.evt | modeM0/AS1G07_046T01_9000001534_10584cztM0_level2_quad_clean.evt |
| Size (bytes) | 382,832,640 | 51,626,880 |
| Size | 365.1 MB | 49.2 MB |
| Events in quadrant A | 2,308,266 | 315,706 |
| Events in quadrant B | 3,472,143 | 303,135 |
| Events in quadrant C | 2,085,489 | 313,235 |
| Events in quadrant D | 3,399,849 | 291,881 |
| Mode SS | |||
|---|---|---|---|
| Quadrant | BADHDUFLAG | Total packets | Discarded packets |
| A | 0 | 96 | 0 |
| B | 0 | 96 | 0 |
| C | 0 | 96 | 0 |
| D | 0 | 96 | 0 |
| Mode M0 | |||
|---|---|---|---|
| Quadrant | BADHDUFLAG | Total packets | Discarded packets |
| A | 0 | 10047 | 0 |
| B | 0 | 13472 | 0 |
| C | 0 | 9690 | 0 |
| D | 0 | 13474 | 0 |
| Quadrant | Total seconds | Saturated seconds | Saturation percentage |
|---|---|---|---|
| A | 4829 | 3 | 0.062125% |
| B | 4829 | 373 | 7.724166% |
| C | 4829 | 2 | 0.041416% |
| D | 4829 | 20 | 0.414164% |
Noise dominated data is calculated using 1-second bins in cleaned event files. If a bin has >2000 counts, and if more than 50% of those come from <1% of pixels, then it is considered to be noise-dominated and hence unusable.
| Quadrant | # 1 sec bins | Bins with >0 counts | Bins with >2000 counts | High rate bins dominated by noise | Noise dominated (total time) | Noise dominated (detector-on time) | Marked lightcurve |
|---|---|---|---|---|---|---|---|
| A | 4829 | 4829 | 2 | 2 | 0.04% | 0.04% | 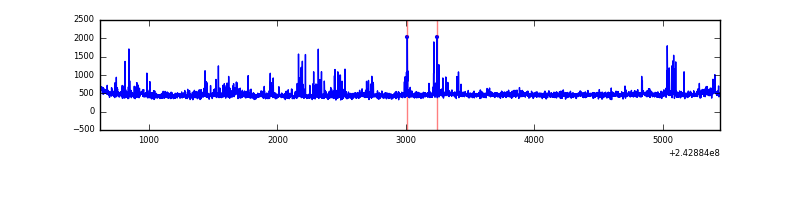 |
| B | 4829 | 4829 | 297 | 297 | 6.15% | 6.15% | 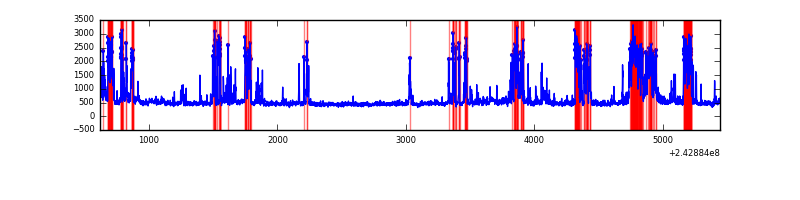 |
| C | 4829 | 4829 | 0 | 0 | 0.00% | 0.00% | 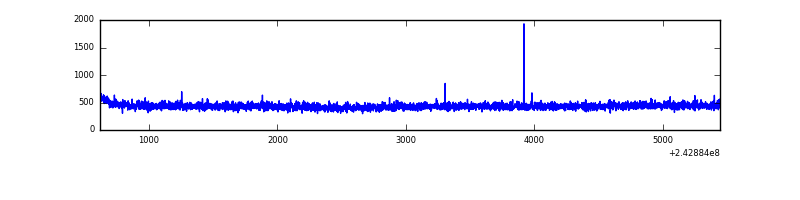 |
| D | 4829 | 4829 | 8 | 8 | 0.17% | 0.17% | 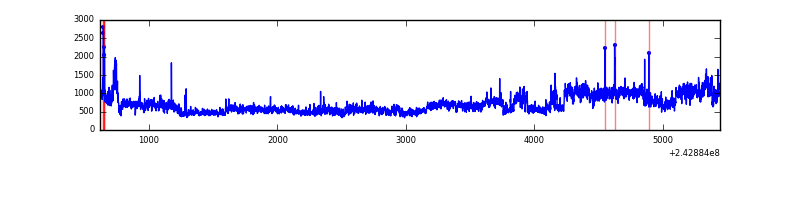 |
Top three noisy pixels from each quadrant. If the there are fewer than three noisy pixels in the level2.evt file, extra rows are filled as -1
| Pixel properties | Quadrant properties | ||||||
|---|---|---|---|---|---|---|---|
| Quadrant | DetID | PixID | Counts | Sigma | Mean | Median | Sigma |
| A | 13 | 251 | 149370 | 1312.97 | 550 | 537 | 113.4 |
| A | 13 | 248 | 13671 | 115.86 | 550 | 537 | 113.4 |
| A | 1 | 162 | 9446 | 78.59 | 550 | 537 | 113.4 |
| B | 4 | 239 | 1239336 | 11851.59 | 537 | 523 | 104.5 |
| B | 0 | 219 | 85165 | 809.76 | 537 | 523 | 104.5 |
| B | 0 | 214 | 28968 | 272.13 | 537 | 523 | 104.5 |
| C | 13 | 61 | 3961 | 27.46 | 533 | 535 | 124.8 |
| C | 12 | 4 | 3490 | 23.68 | 533 | 535 | 124.8 |
| C | 14 | 234 | 2010 | 11.82 | 533 | 535 | 124.8 |
| D | 2 | 16 | 1133049 | 8859.27 | 526 | 511 | 127.8 |
| D | 8 | 195 | 224958 | 1755.74 | 526 | 511 | 127.8 |
| D | 9 | 85 | 22244 | 170.01 | 526 | 511 | 127.8 |
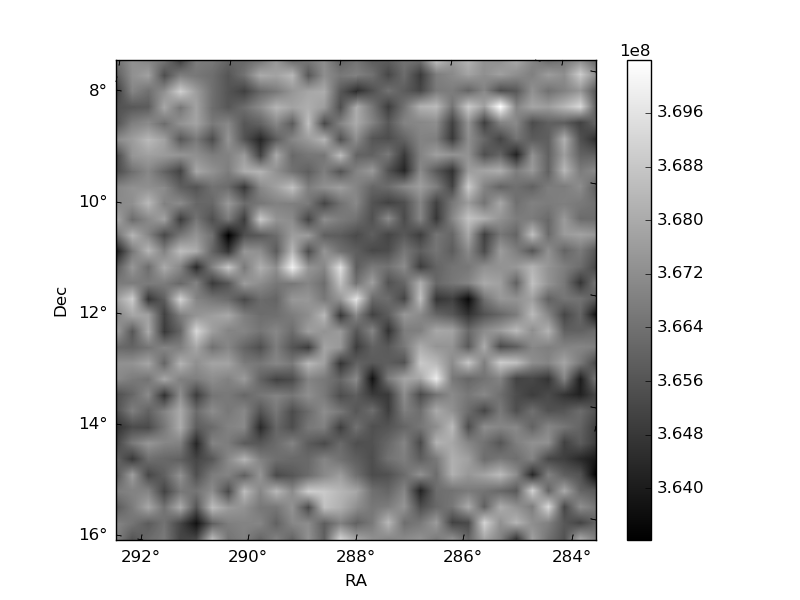
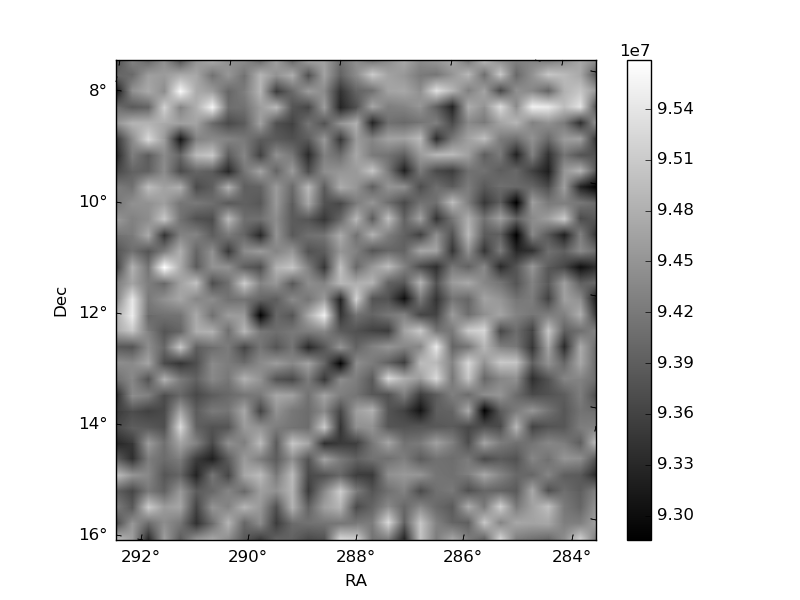
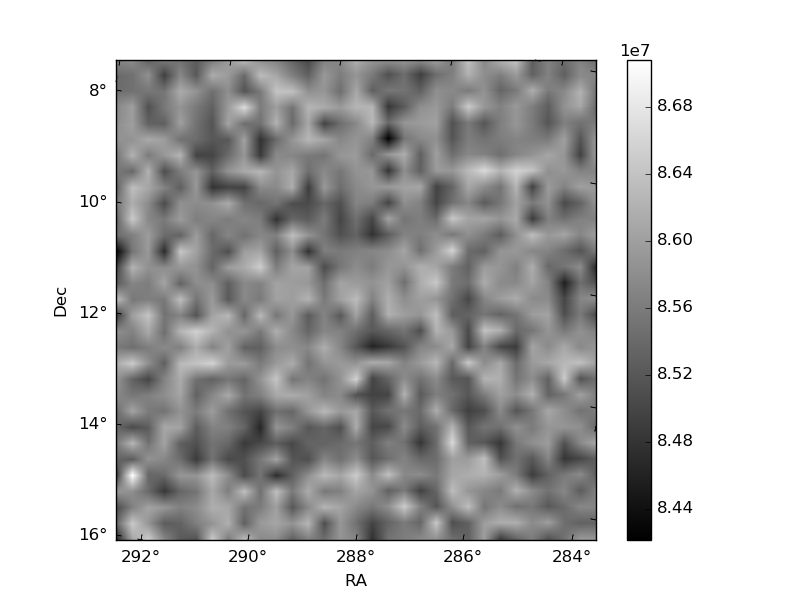
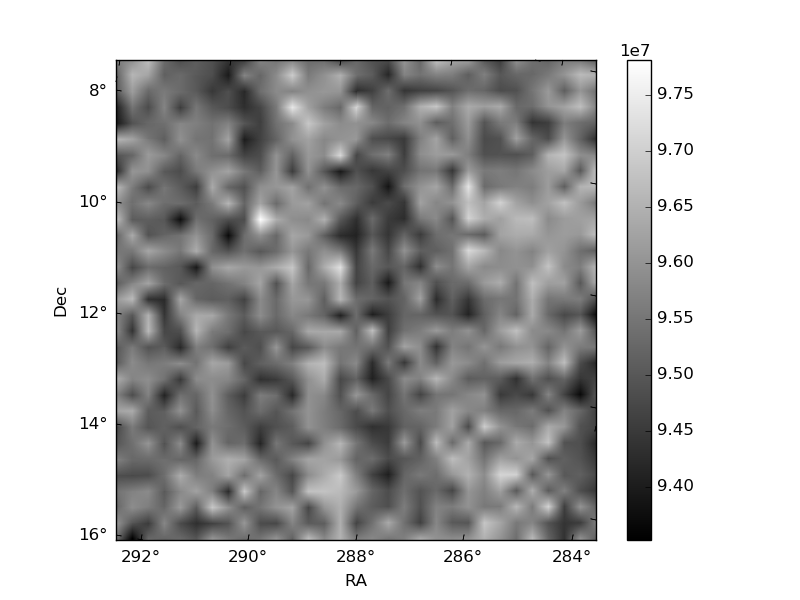
Histogram calculated using DETX and DETY for each event in the final _common_clean file
| Quadrant A | 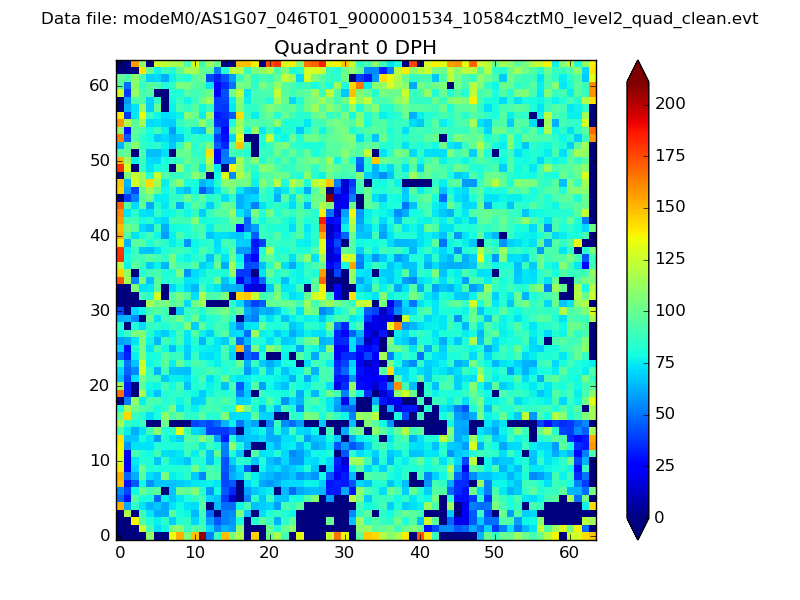 |
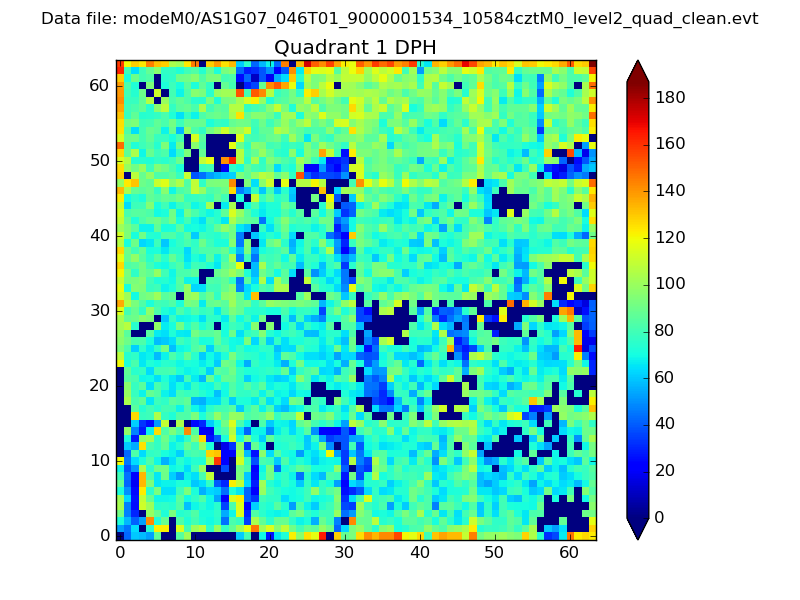 |
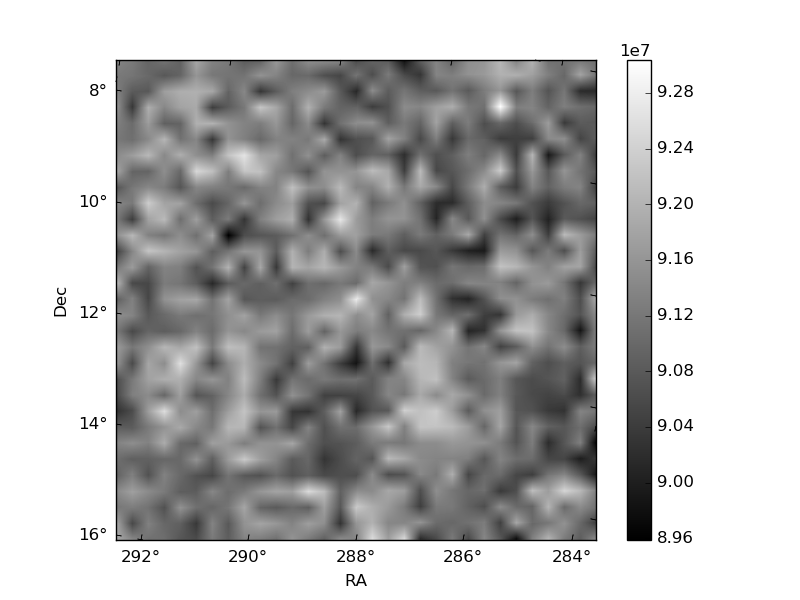
Quadrant B |
|---|---|---|---|
| Quadrant D | 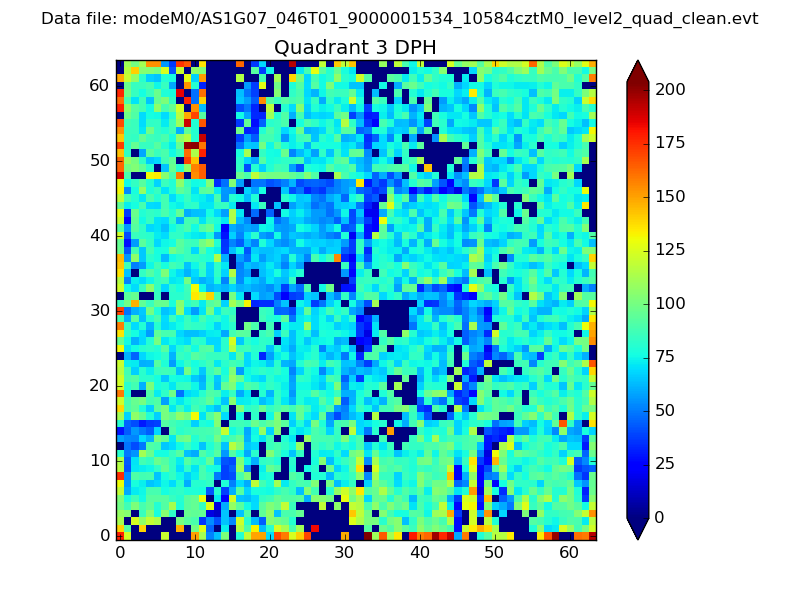 |
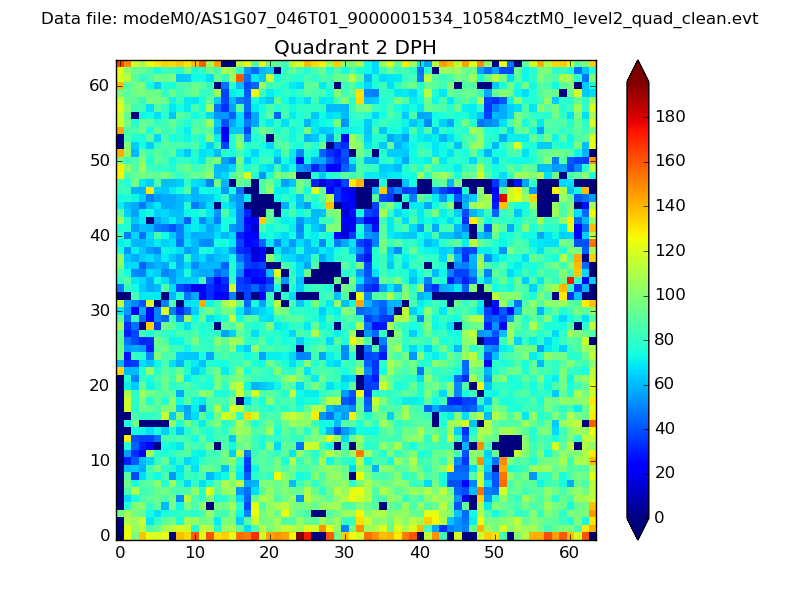 |
Quadrant C |
| Plot type | Count rate plots | Images |
|---|---|---|
| Comparison with Poisson distribution Blue bars denote a histogram of data divided into 1 sec bins. Red curve is a Poisson curve with rate = median count rate of data. |
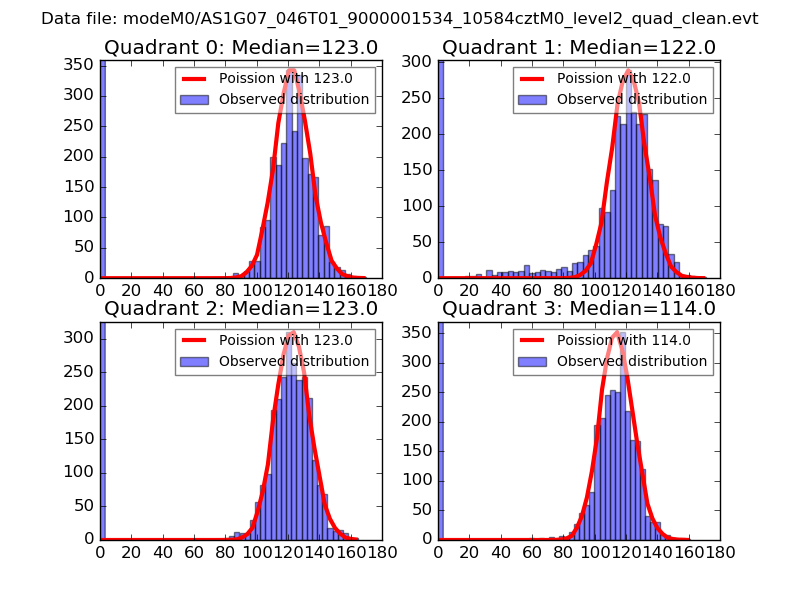 |
 |
| Quadrant-wise count rates Data is divided into 100 sec bins |
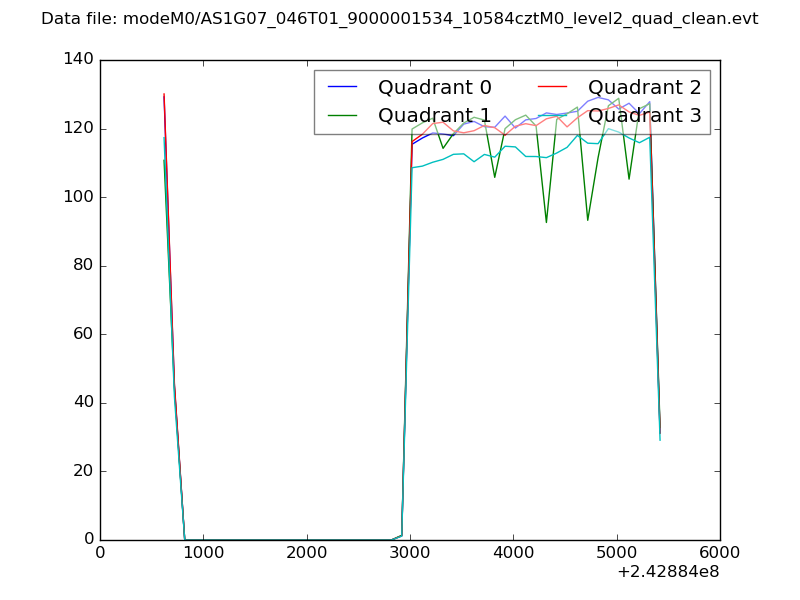 |
|
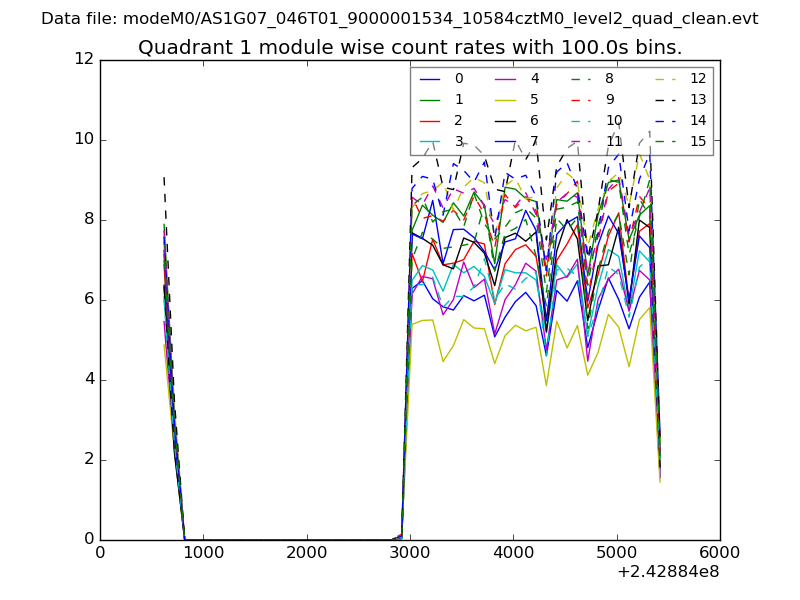
| Module-wise count rates for Quadrant A Data is divided into 100 sec bins |
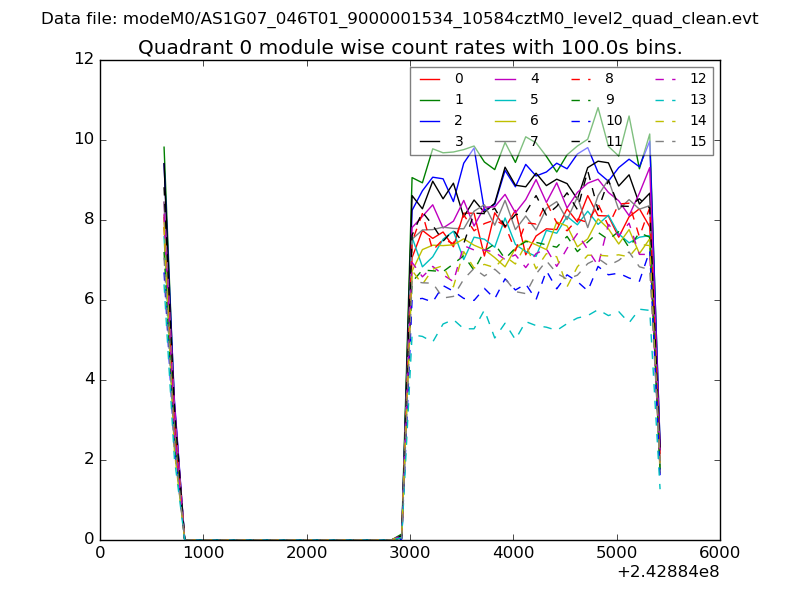 |
 |
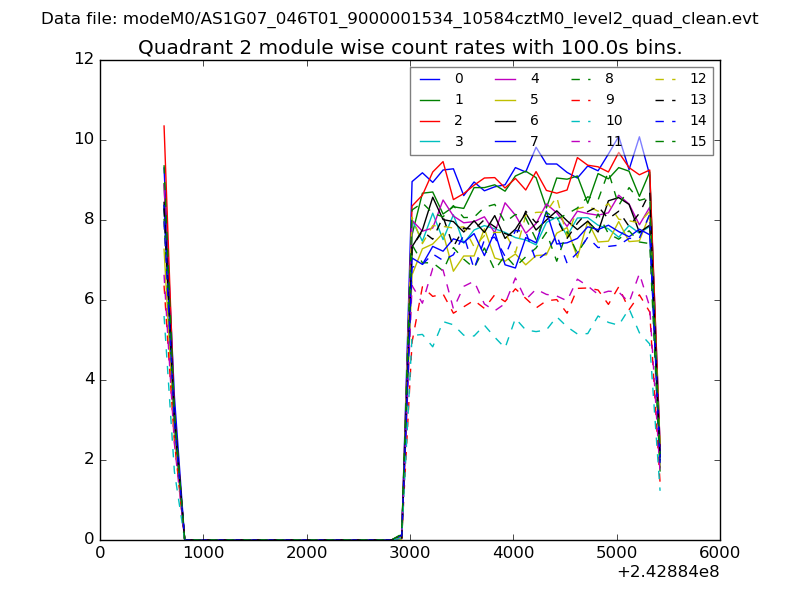
| Module-wise count rates for Quadrant B Data is divided into 100 sec bins |
 |
 |
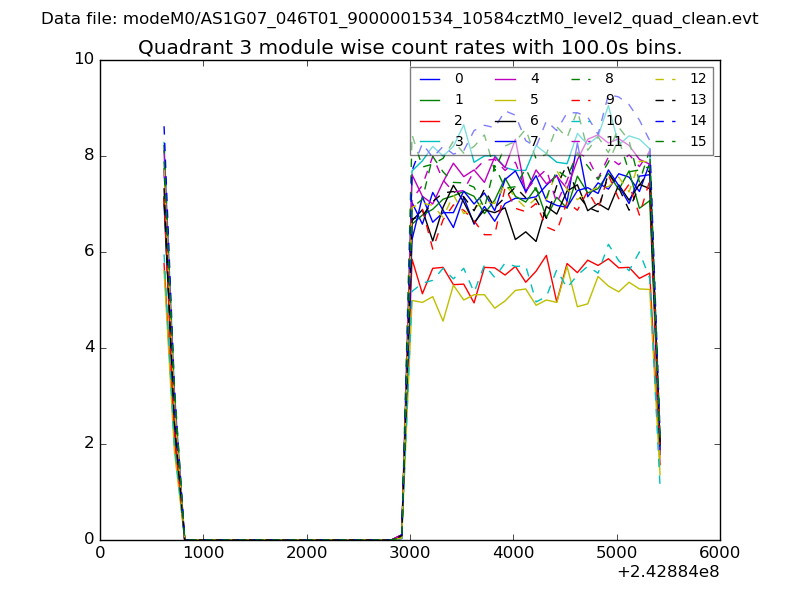
| Module-wise count rates for Quadrant C Data is divided into 100 sec bins |
 |
 |
| Module-wise count rates for Quadrant D Data is divided into 100 sec bins |
 |
 |
| Parameter | Plot |
|---|---|
| CZT HV Monitor | 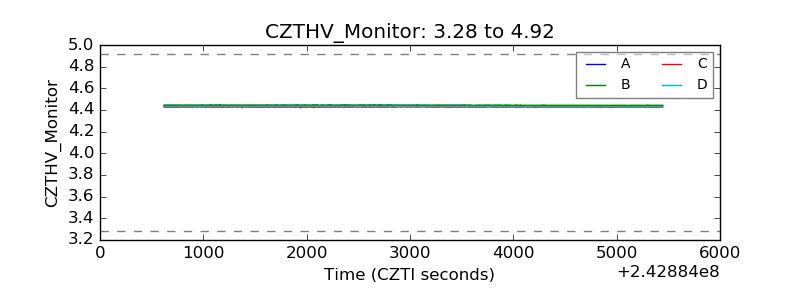 |
| D_VDD | 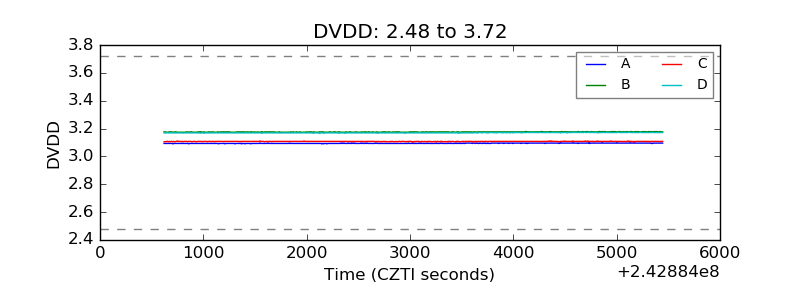 |
| Temperature 1 | 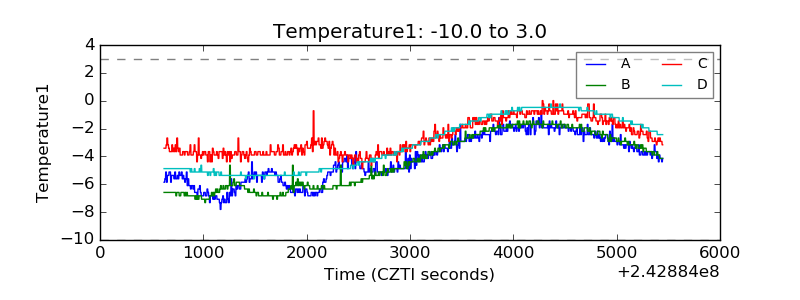 |
| Veto HV Monitor | 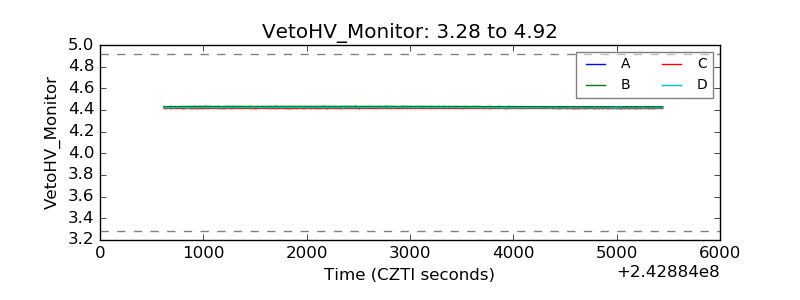 |
| Veto LLD | 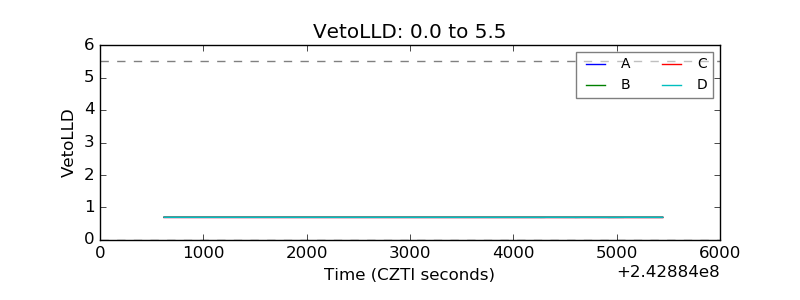 |
| Alpha Counter | 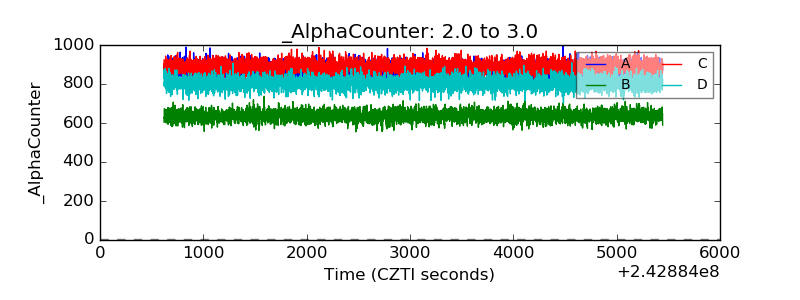 |
| _CPM_Rate | 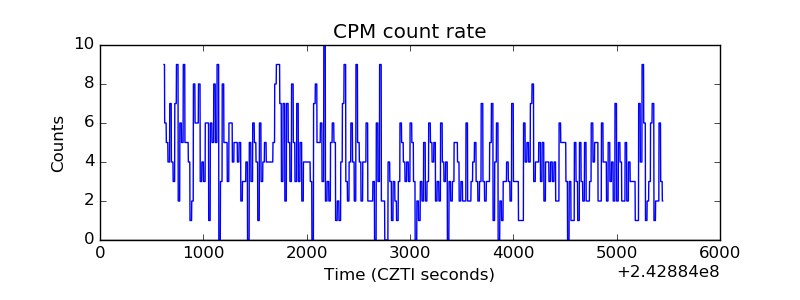 |
| CZT Counter | 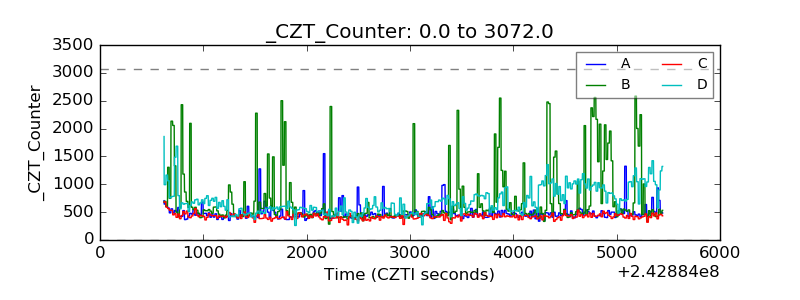 |
| +2.5 Volts monitor |  |
| +5 Volts monitor |  |
| _ROLL_ROT | 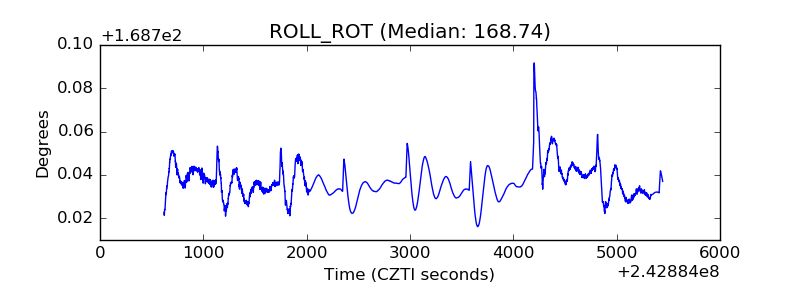 |
| _Roll_DEC | 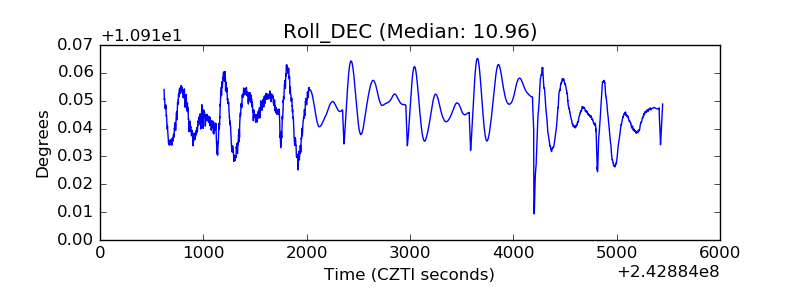 |
| _Roll_RA | 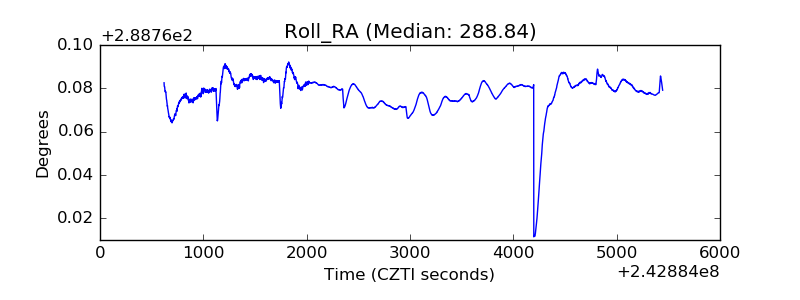 |
| Veto Counter | 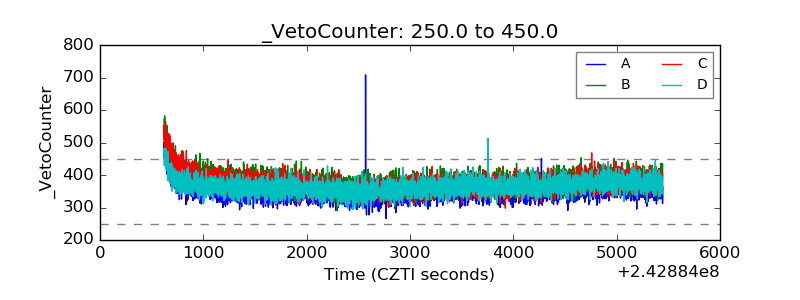 |