| Param | Original file | Final file |
|---|---|---|
| Filename | modeM0/AS1T01_191T01_9000001536cztM0_level2.fits | modeM0/AS1T01_191T01_9000001536cztM0_level2_quad_clean.evt |
| Size (bytes) | 3,409,629,120 | 3,872,698,560 |
| Size | 3.2 GB | 3.6 GB |
| Events in quadrant A | 20,652,214 | 24,381,462 |
| Events in quadrant B | 19,482,960 | 23,068,986 |
| Events in quadrant C | 20,382,186 | 23,493,533 |
| Events in quadrant D | 17,427,686 | 21,053,492 |
| Mode SS | |||
|---|---|---|---|
| Quadrant | BADHDUFLAG | Total packets | Discarded packets |
| A | 0 | 7514 | 0 |
| B | 0 | 7518 | 0 |
| C | 0 | 7516 | 0 |
| D | 0 | 7522 | 0 |
| Mode M9 | |||
|---|---|---|---|
| Quadrant | BADHDUFLAG | Total packets | Discarded packets |
| A | 0 | 556 | 0 |
| B | 0 | 556 | 0 |
| C | 0 | 556 | 0 |
| D | 0 | 556 | 0 |
| Mode M0 | |||
|---|---|---|---|
| Quadrant | BADHDUFLAG | Total packets | Discarded packets |
| A | 0 | 791580 | 0 |
| B | 0 | 1010231 | 0 |
| C | 0 | 804576 | 0 |
| D | 0 | 973782 | 0 |
| Quadrant | Total seconds | Saturated seconds | Saturation percentage |
|---|---|---|---|
| A | 369414 | 6149 | 1.664528% |
| B | 369431 | 25917 | 7.015383% |
| C | 369468 | 6476 | 1.752790% |
| D | 369435 | 9801 | 2.652970% |
Noise dominated data is calculated using 1-second bins in cleaned event files. If a bin has >2000 counts, and if more than 50% of those come from <1% of pixels, then it is considered to be noise-dominated and hence unusable.
| Quadrant | # 1 sec bins | Bins with >0 counts | Bins with >2000 counts | High rate bins dominated by noise | Noise dominated (total time) | Noise dominated (detector-on time) | Marked lightcurve |
|---|---|---|---|---|---|---|---|
| A | 425403 | 369221 | 0 | 0 | 0.00% | 0.00% | 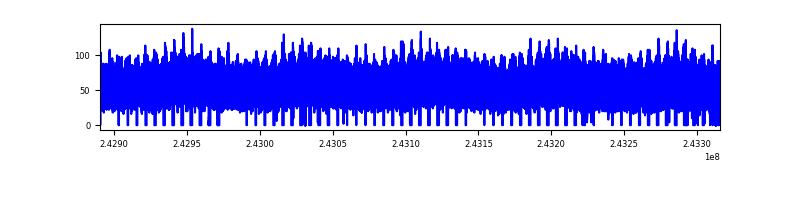 |
| B | 425403 | 369446 | 0 | 0 | 0.00% | 0.00% | 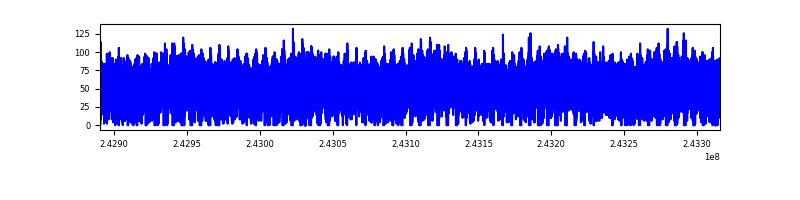 |
| C | 425403 | 369407 | 0 | 0 | 0.00% | 0.00% | 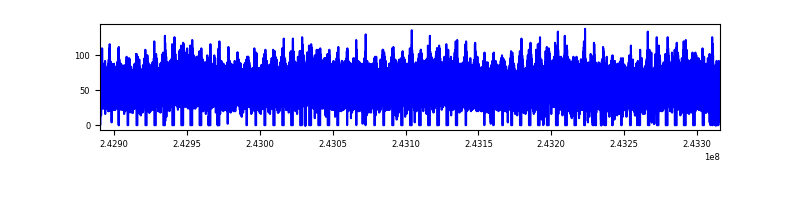 |
| D | 425402 | 369282 | 0 | 0 | 0.00% | 0.00% | 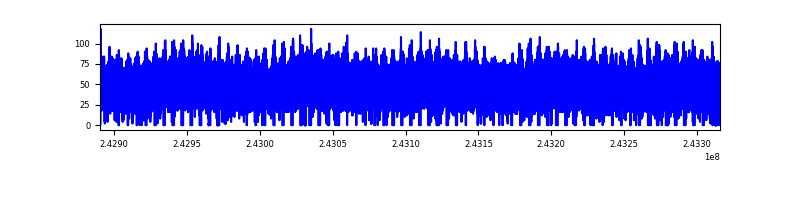 |
Top three noisy pixels from each quadrant. If the there are fewer than three noisy pixels in the level2.evt file, extra rows are filled as -1
| Pixel properties | Quadrant properties | ||||||
|---|---|---|---|---|---|---|---|
| Quadrant | DetID | PixID | Counts | Sigma | Mean | Median | Sigma |
| A | 14 | 188 | 21491 | 12.36 | 5359 | 5020 | 1332.5 |
| A | 0 | 29 | 20236 | 11.42 | 5359 | 5020 | 1332.5 |
| A | 14 | 204 | 17837 | 9.62 | 5359 | 5020 | 1332.5 |
| B | 2 | 9 | 16972 | 12.01 | 5145 | 4913 | 1004.2 |
| B | 12 | 226 | 13638 | 8.69 | 5145 | 4913 | 1004.2 |
| B | 14 | 254 | 12859 | 7.91 | 5145 | 4913 | 1004.2 |
| C | 1 | 81 | 16683 | 8.44 | 5374 | 4994 | 1385.6 |
| C | 1 | 80 | 16623 | 8.39 | 5374 | 4994 | 1385.6 |
| C | 12 | 250 | 15356 | 7.48 | 5374 | 4994 | 1385.6 |
| D | 4 | 246 | 14539 | 7.53 | 4969 | 4518 | 1331.6 |
| D | 3 | 14 | 12678 | 6.13 | 4969 | 4518 | 1331.6 |
| D | 6 | 231 | 12580 | 6.05 | 4969 | 4518 | 1331.6 |
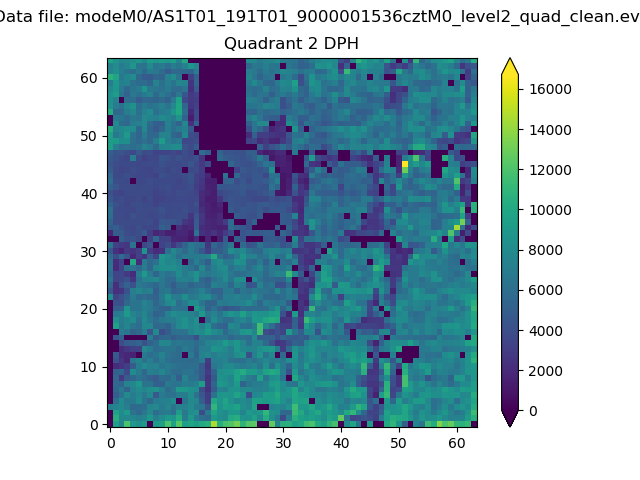
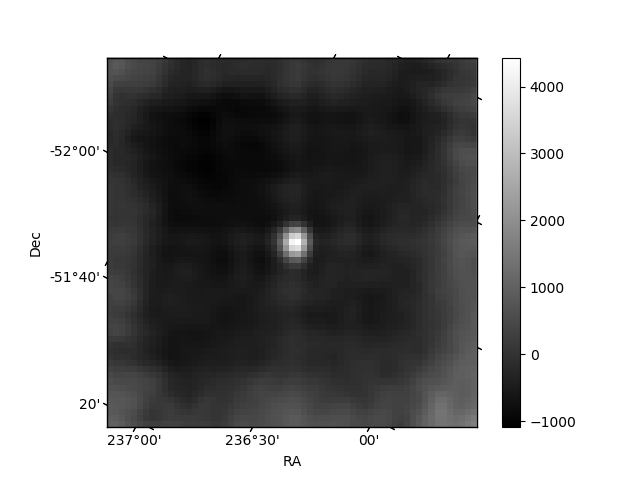
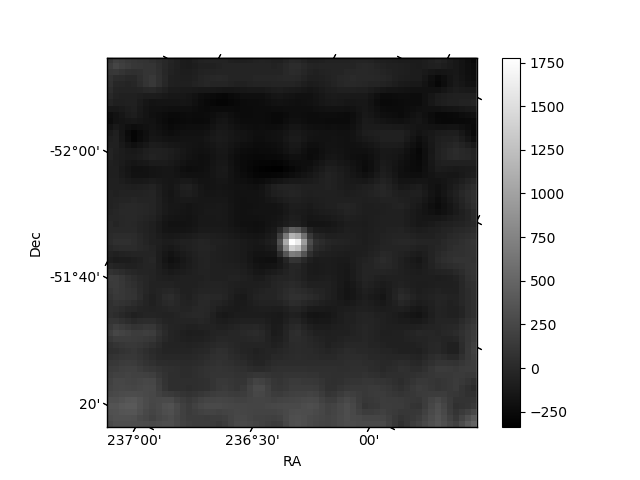
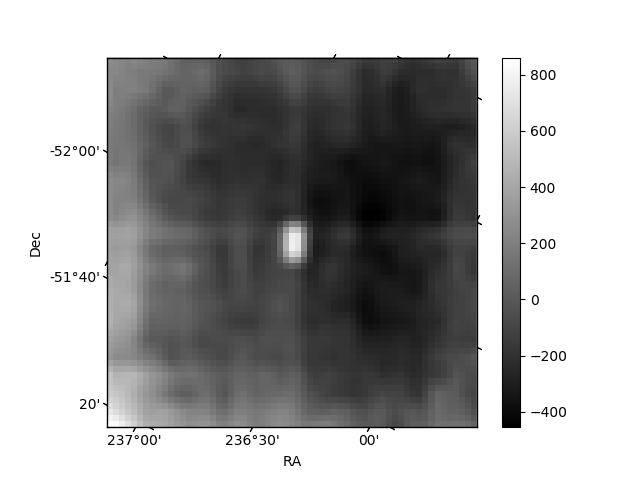
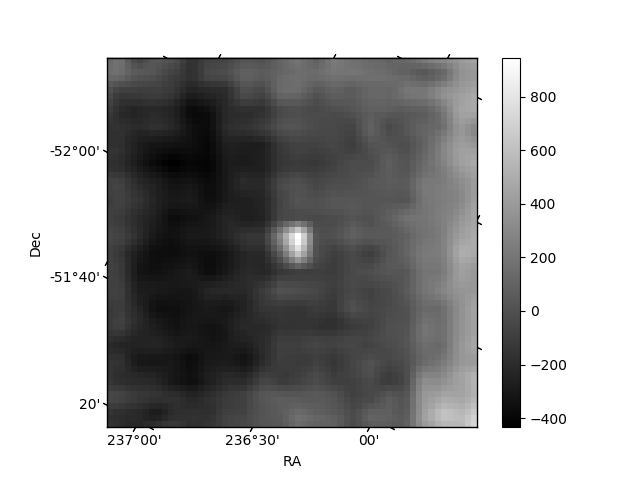
Histogram calculated using DETX and DETY for each event in the final _common_clean file
| Quadrant A | 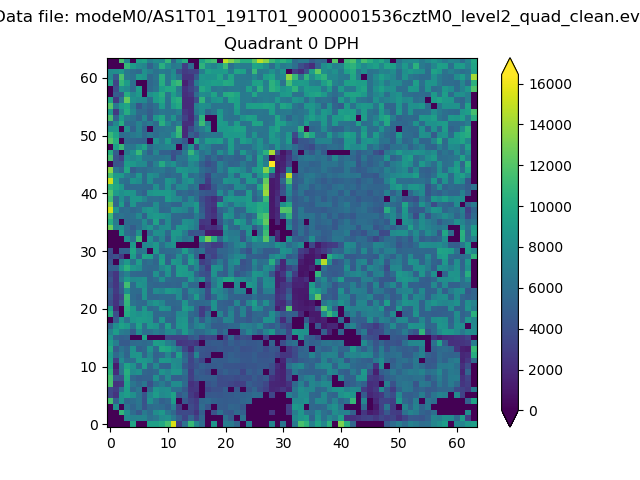 |
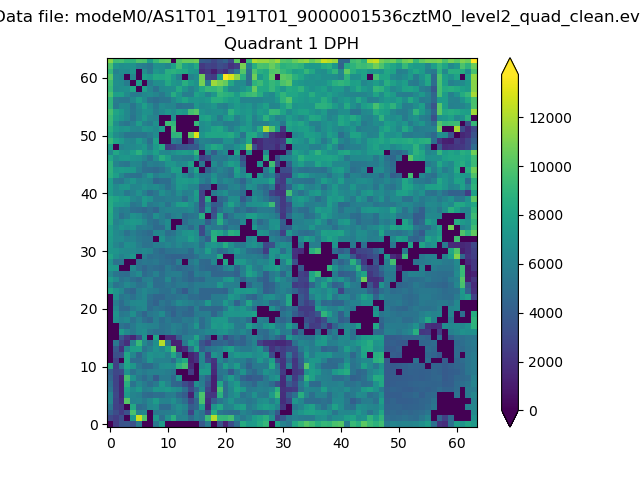 |
Quadrant B |
|---|---|---|---|
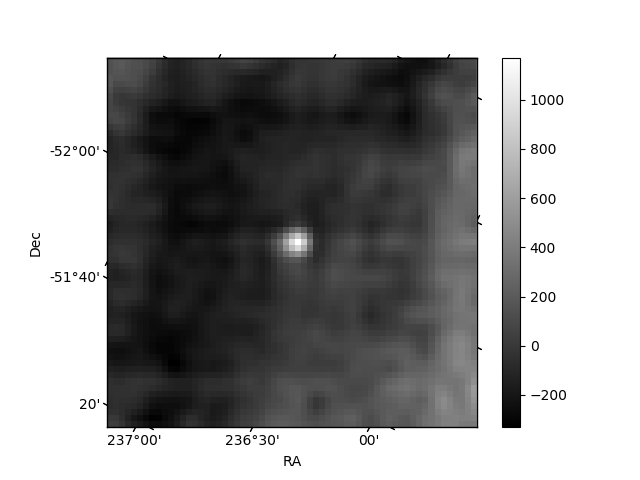
| Quadrant D | 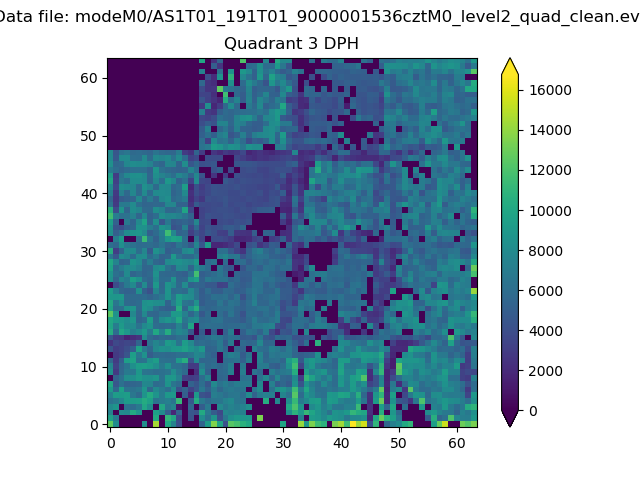 |
 |
Quadrant C |
| Plot type | Count rate plots | Images |
|---|---|---|
| Comparison with Poisson distribution Blue bars denote a histogram of data divided into 1 sec bins. Red curve is a Poisson curve with rate = median count rate of data. |
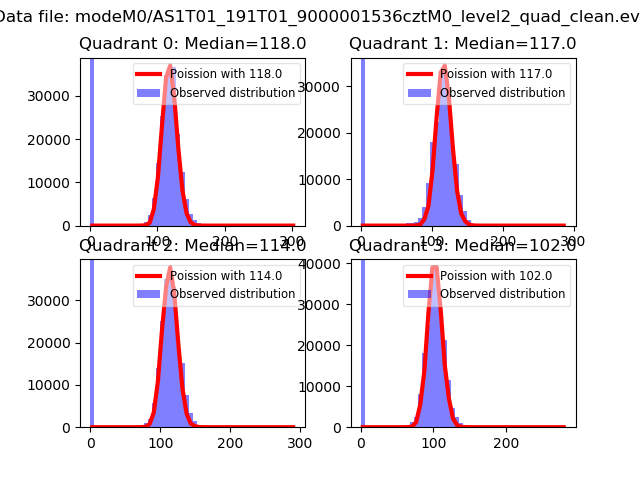 |
 |
| Quadrant-wise count rates Data is divided into 100 sec bins |
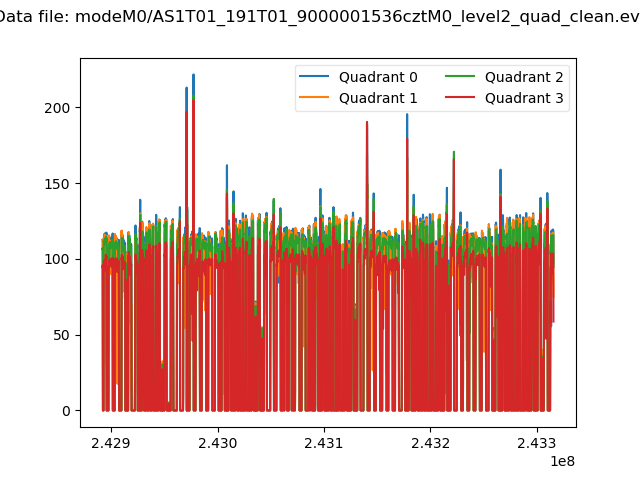 |
|
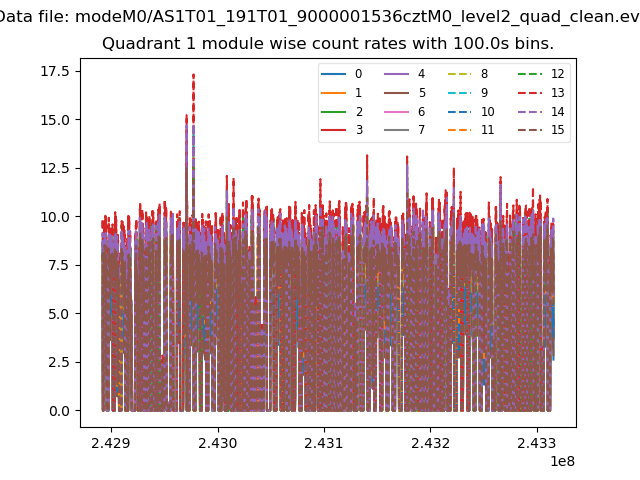
| Module-wise count rates for Quadrant A Data is divided into 100 sec bins |
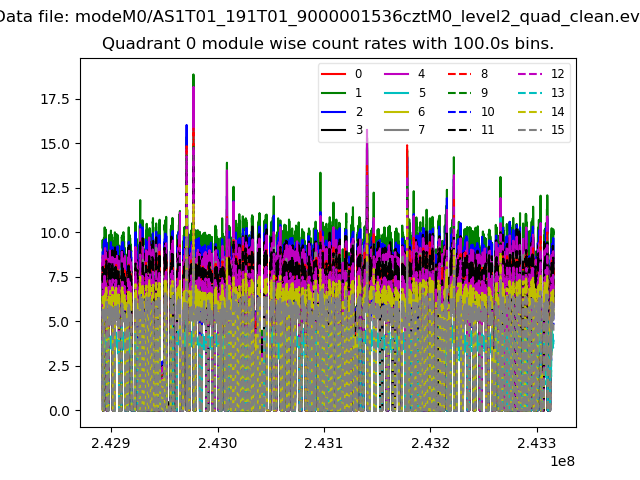 |
 |
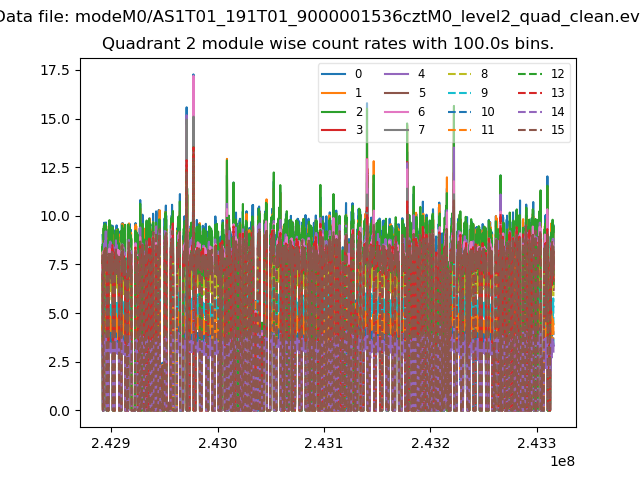
| Module-wise count rates for Quadrant B Data is divided into 100 sec bins |
 |
 |
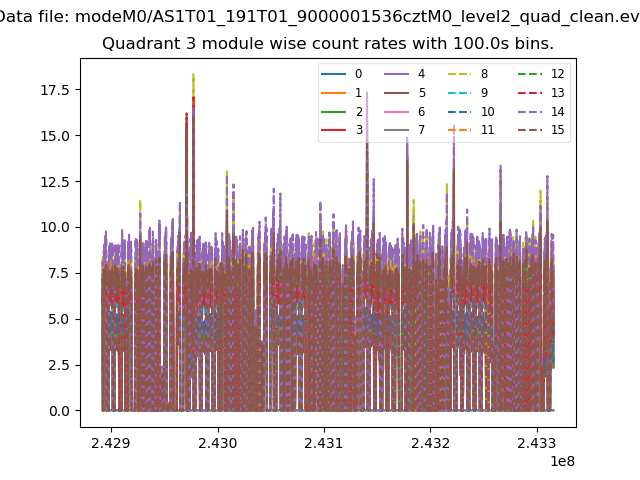
| Module-wise count rates for Quadrant C Data is divided into 100 sec bins |
 |
 |
| Module-wise count rates for Quadrant D Data is divided into 100 sec bins |
 |
 |
| Parameter | Plot |
|---|---|
| CZT HV Monitor | 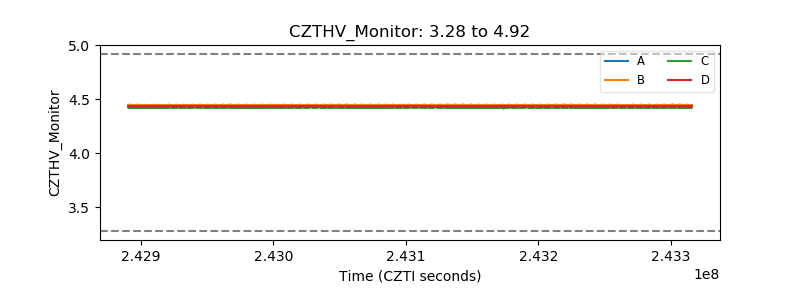 |
| D_VDD | 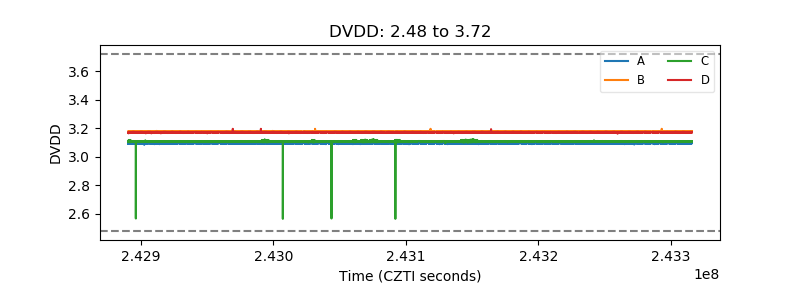 |
| Temperature 1 | 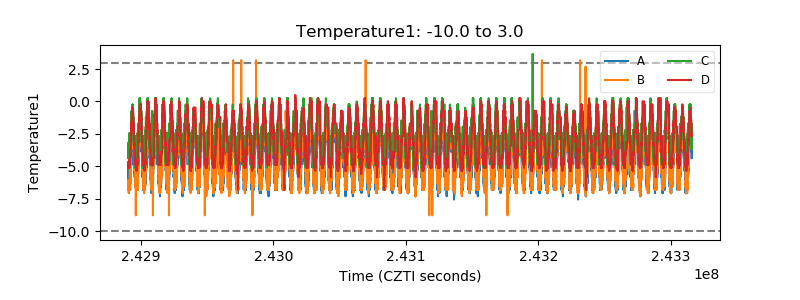 |
| Veto HV Monitor | 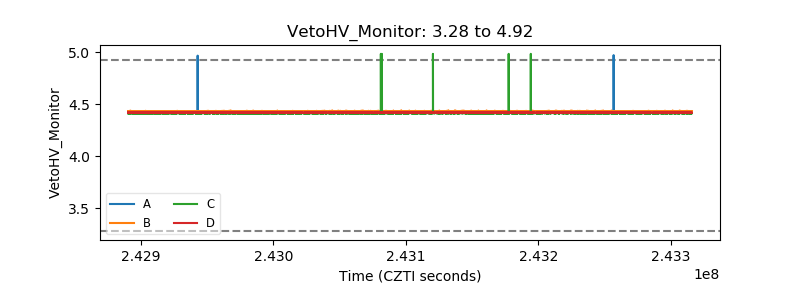 |
| Veto LLD | 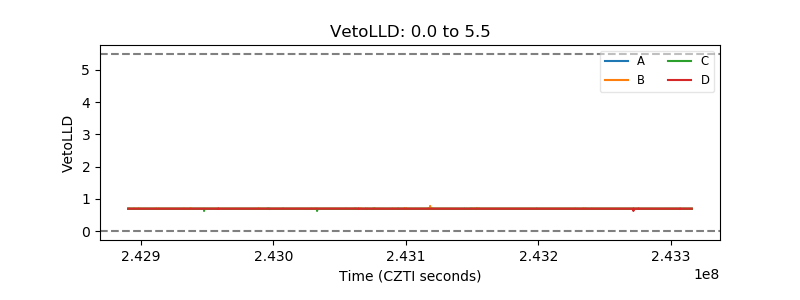 |
| Alpha Counter | 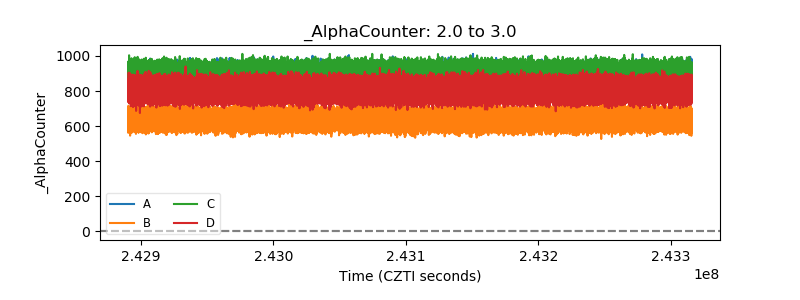 |
| _CPM_Rate | 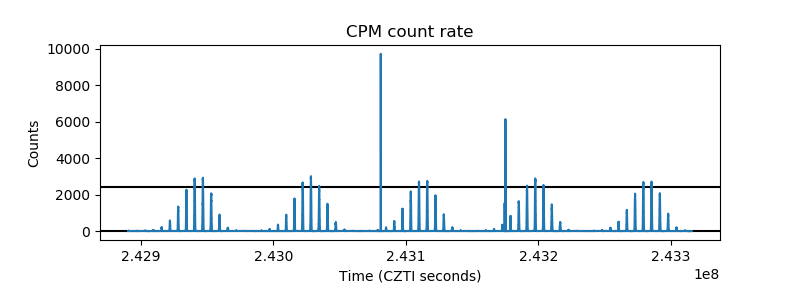 |
| CZT Counter | 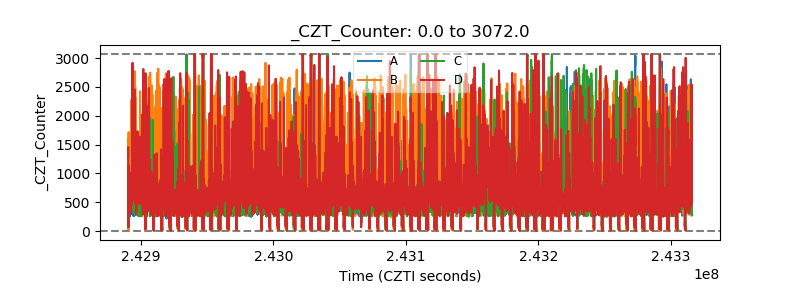 |
| +2.5 Volts monitor | 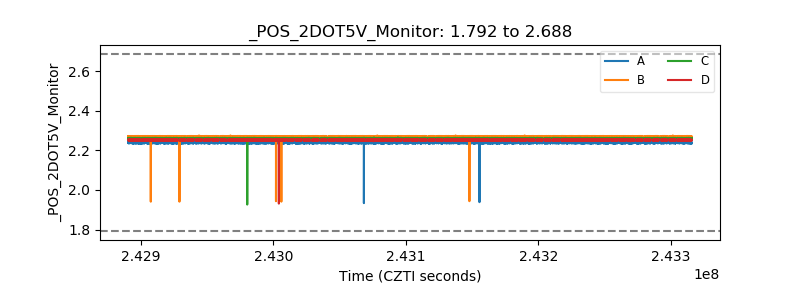 |
| +5 Volts monitor | 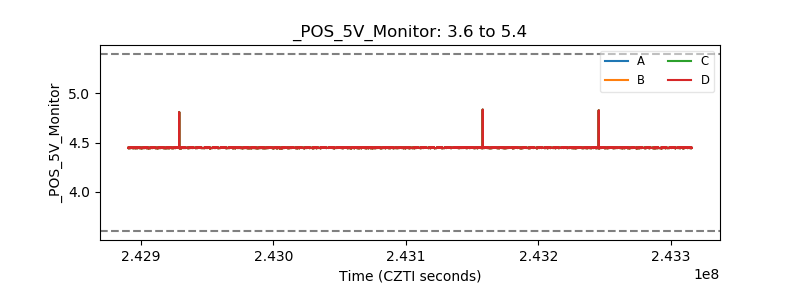 |
| _ROLL_ROT | 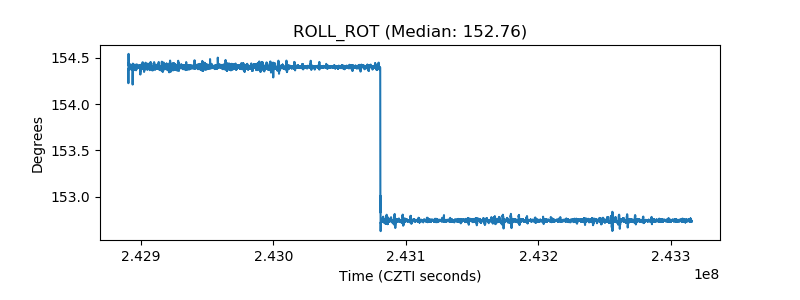 |
| _Roll_DEC | 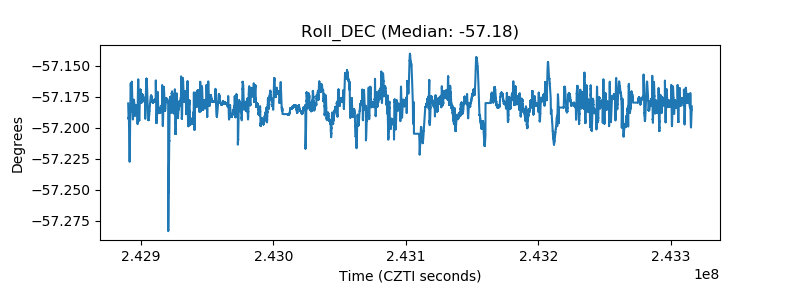 |
| _Roll_RA | 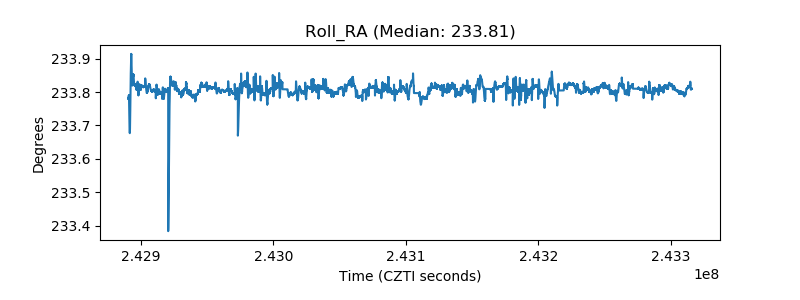 |
| Veto Counter | 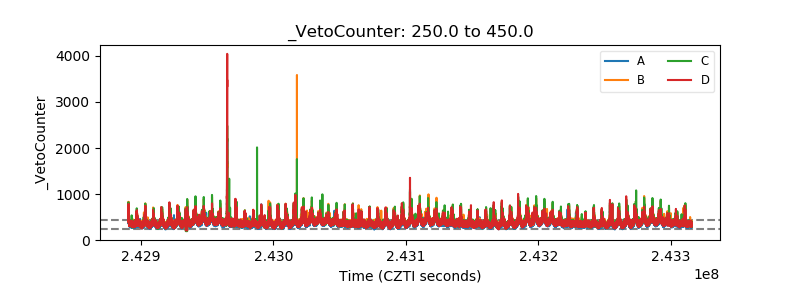 |