| Param | Original file | Final file |
|---|---|---|
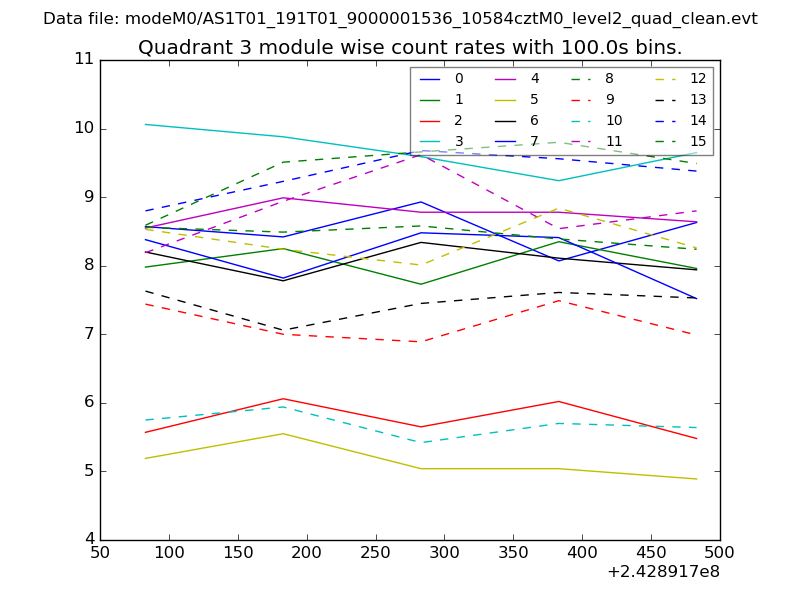
| Filename | modeM0/AS1T01_191T01_9000001536_10584cztM0_level2.evt | modeM0/AS1T01_191T01_9000001536_10584cztM0_level2_quad_clean.evt |
| Size (bytes) | 144,567,360 | 13,285,440 |
| Size | 137.9 MB | 12.7 MB |
| Events in quadrant A | 970,065 | 68,289 |
| Events in quadrant B | 1,020,374 | 69,837 |
| Events in quadrant C | 954,853 | 67,491 |
| Events in quadrant D | 1,306,841 | 63,399 |
| Mode SS | |||
|---|---|---|---|
| Quadrant | BADHDUFLAG | Total packets | Discarded packets |
| A | 0 | 38 | 0 |
| B | 0 | 38 | 0 |
| C | 0 | 38 | 0 |
| D | 0 | 38 | 0 |
| Mode M9 | |||
|---|---|---|---|
| Quadrant | BADHDUFLAG | Total packets | Discarded packets |
| A | 0 | 1 | 0 |
| B | 0 | 1 | 0 |
| C | 0 | 1 | 0 |
| D | 0 | 1 | 0 |
| Mode M0 | |||
|---|---|---|---|
| Quadrant | BADHDUFLAG | Total packets | Discarded packets |
| A | 0 | 4070 | 2 |
| B | 0 | 4202 | 1 |
| C | 0 | 4004 | 1 |
| D | 0 | 5126 | 1 |
| Quadrant | Total seconds | Saturated seconds | Saturation percentage |
|---|---|---|---|
| A | 1811 | 262 | 14.467145% |
| B | 1811 | 315 | 17.393705% |
| C | 1811 | 249 | 13.749310% |
| D | 1811 | 290 | 16.013252% |
Noise dominated data is calculated using 1-second bins in cleaned event files. If a bin has >2000 counts, and if more than 50% of those come from <1% of pixels, then it is considered to be noise-dominated and hence unusable.
| Quadrant | # 1 sec bins | Bins with >0 counts | Bins with >2000 counts | High rate bins dominated by noise | Noise dominated (total time) | Noise dominated (detector-on time) | Marked lightcurve |
|---|---|---|---|---|---|---|---|
| A | 1931 | 1813 | 0 | 0 | 0.00% | 0.00% | 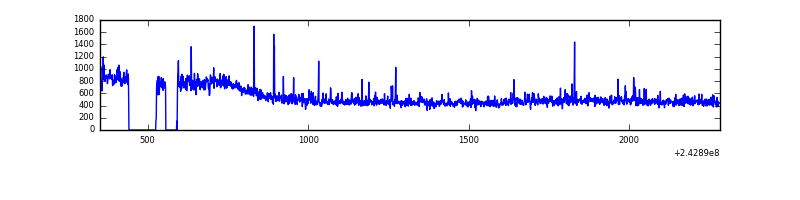 |
| B | 1931 | 1813 | 6 | 6 | 0.31% | 0.33% | 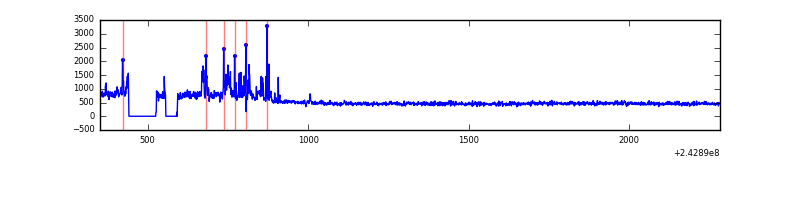 |
| C | 1931 | 1813 | 0 | 0 | 0.00% | 0.00% | 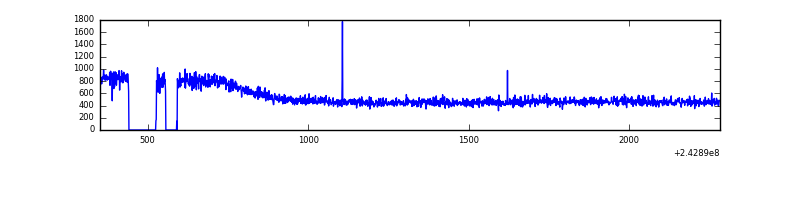 |
| D | 1931 | 1812 | 0 | 0 | 0.00% | 0.00% | 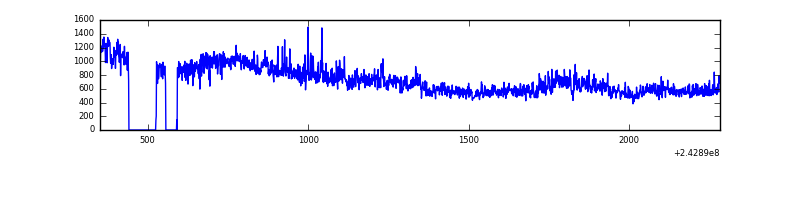 |
Top three noisy pixels from each quadrant. If the there are fewer than three noisy pixels in the level2.evt file, extra rows are filled as -1
| Pixel properties | Quadrant properties | ||||||
|---|---|---|---|---|---|---|---|
| Quadrant | DetID | PixID | Counts | Sigma | Mean | Median | Sigma |
| A | 13 | 251 | 38222 | 733.9 | 240 | 233 | 51.8 |
| A | 1 | 162 | 2586 | 45.46 | 240 | 233 | 51.8 |
| A | 0 | 226 | 2191 | 37.83 | 240 | 233 | 51.8 |
| B | 4 | 239 | 92869 | 1926.28 | 236 | 229 | 48.1 |
| B | 12 | 111 | 5296 | 105.36 | 236 | 229 | 48.1 |
| B | 11 | 111 | 4281 | 84.25 | 236 | 229 | 48.1 |
| C | 8 | 128 | 3715 | 59.83 | 242 | 241 | 58.1 |
| C | 14 | 234 | 3030 | 48.03 | 242 | 241 | 58.1 |
| C | 13 | 61 | 1803 | 26.9 | 242 | 241 | 58.1 |
| D | 2 | 16 | 284085 | 4878.0 | 234 | 225 | 58.2 |
| D | 8 | 195 | 133059 | 2282.69 | 234 | 225 | 58.2 |
| D | 1 | 52 | 9579 | 160.74 | 234 | 225 | 58.2 |
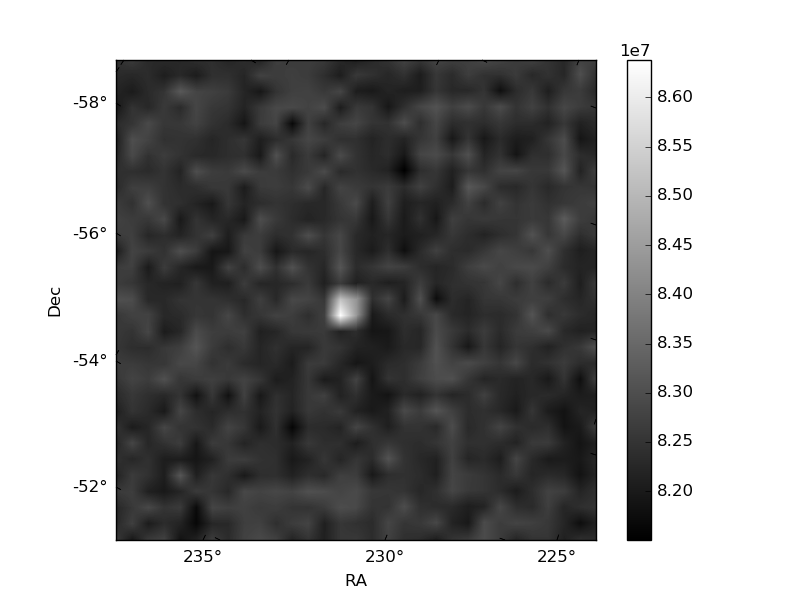
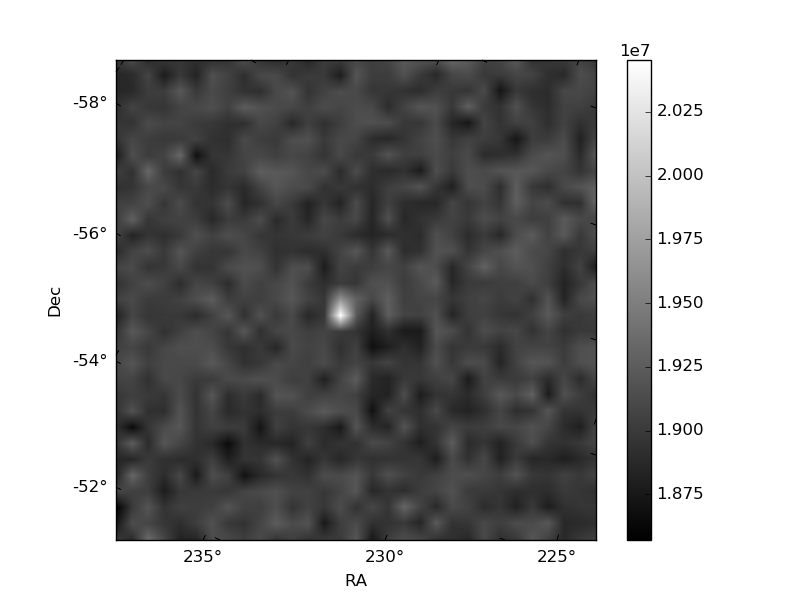
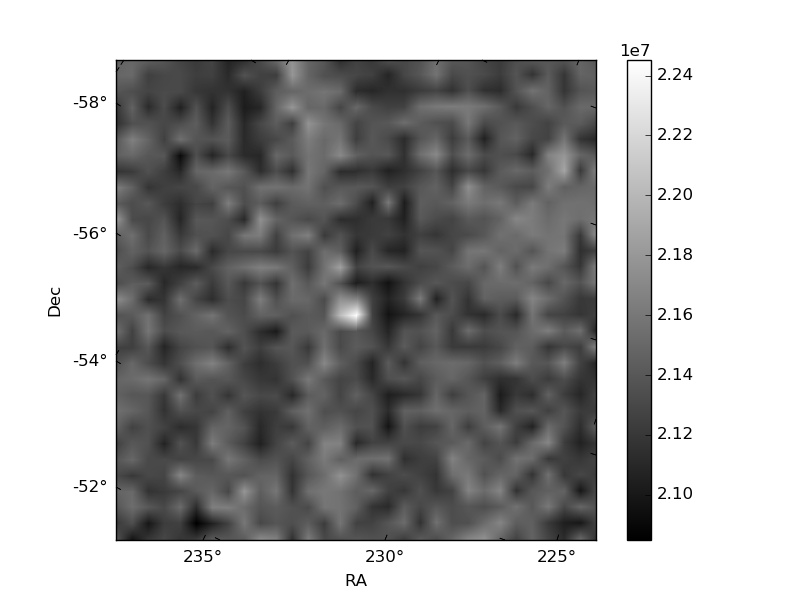
Histogram calculated using DETX and DETY for each event in the final _common_clean file
| Quadrant A | 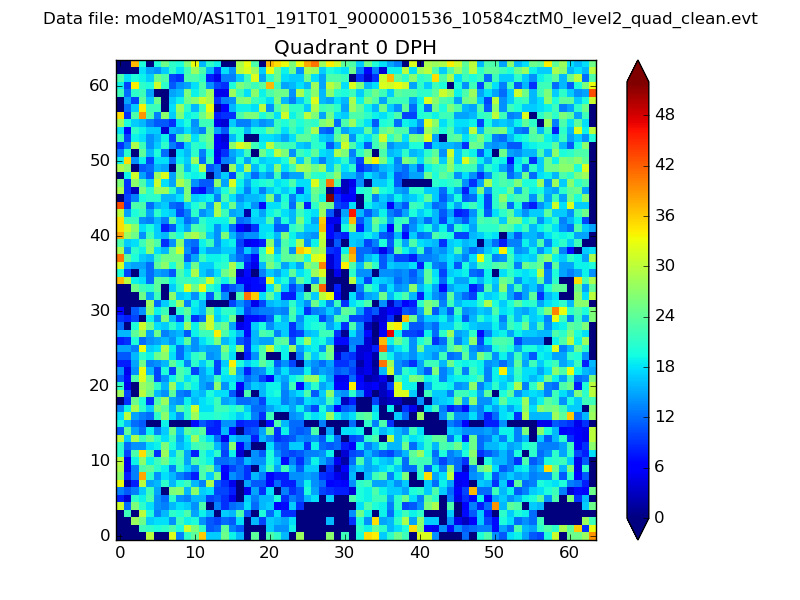 |
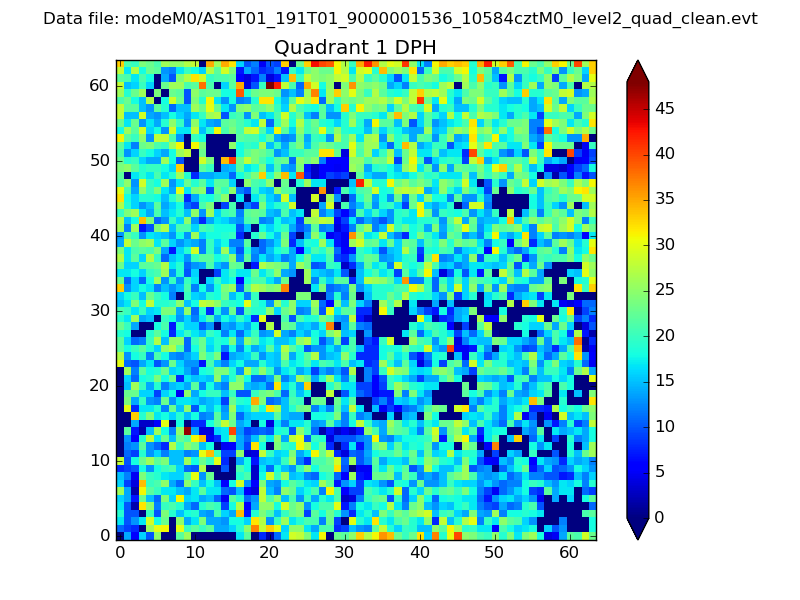 |
Quadrant B |
|---|---|---|---|
| Quadrant D | 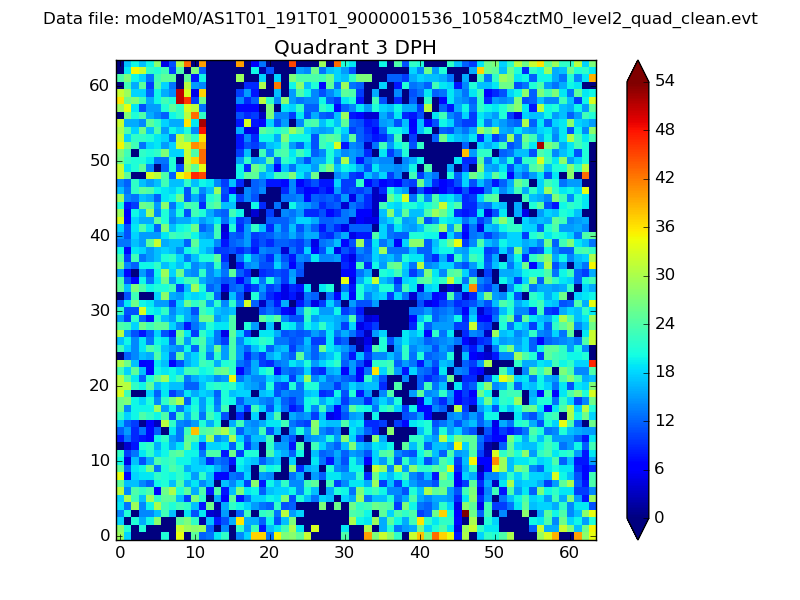 |
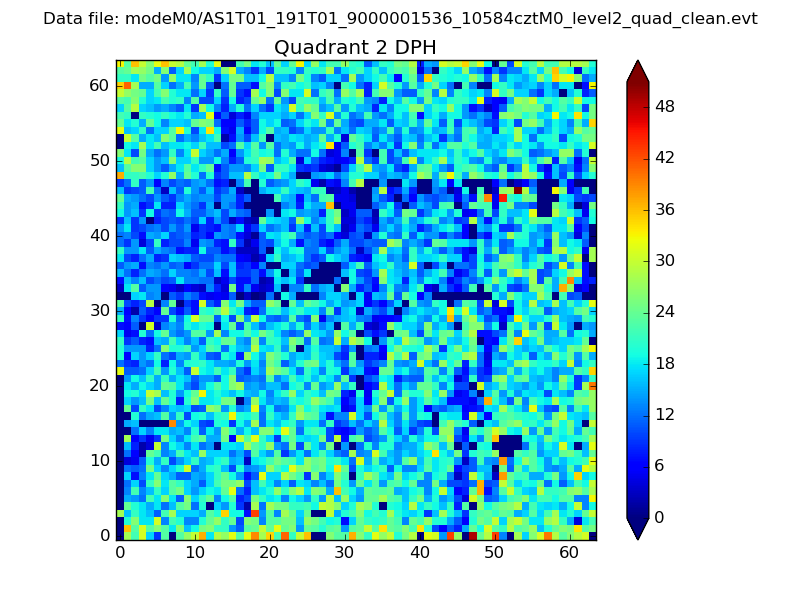 |
Quadrant C |
| Plot type | Count rate plots | Images |
|---|---|---|
| Comparison with Poisson distribution Blue bars denote a histogram of data divided into 1 sec bins. Red curve is a Poisson curve with rate = median count rate of data. |
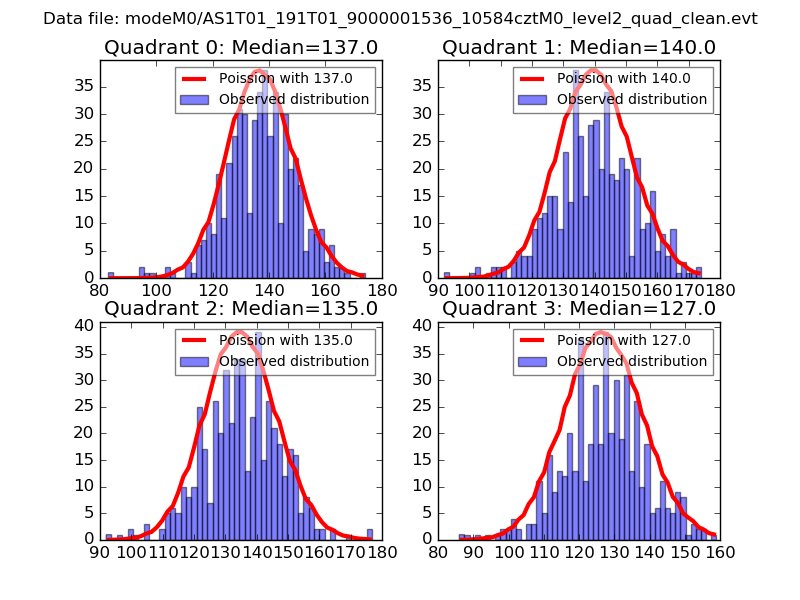 |
 |
| Quadrant-wise count rates Data is divided into 100 sec bins |
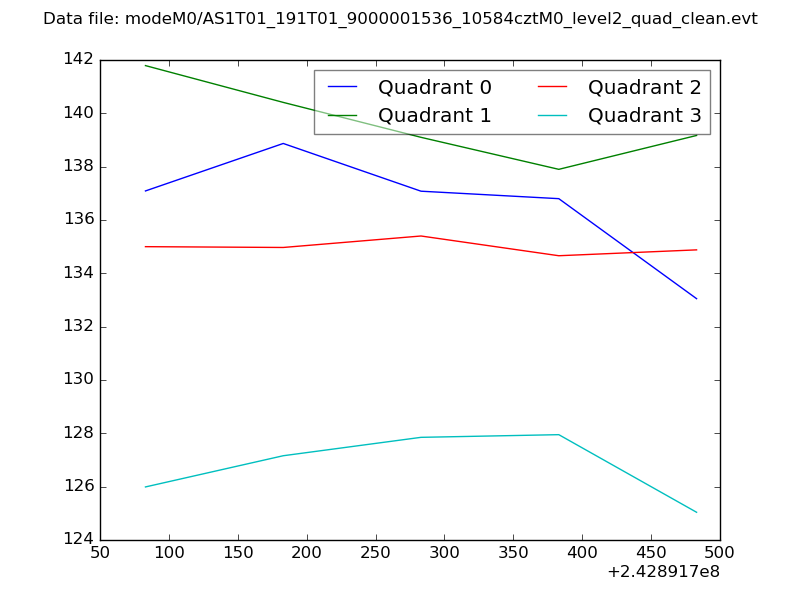 |
|
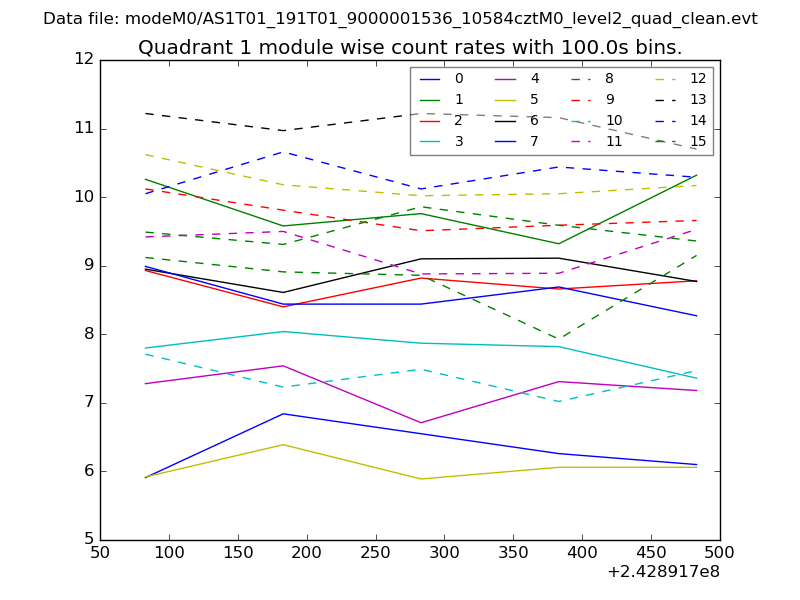
| Module-wise count rates for Quadrant A Data is divided into 100 sec bins |
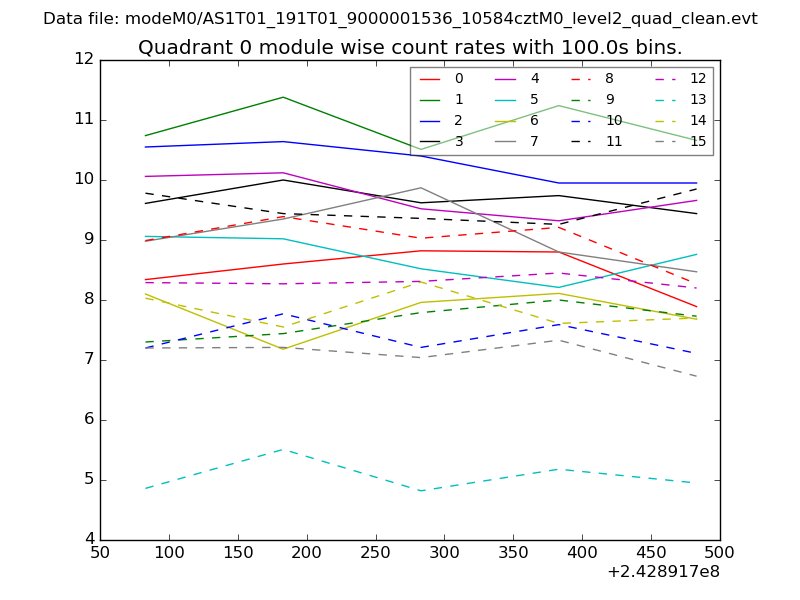 |
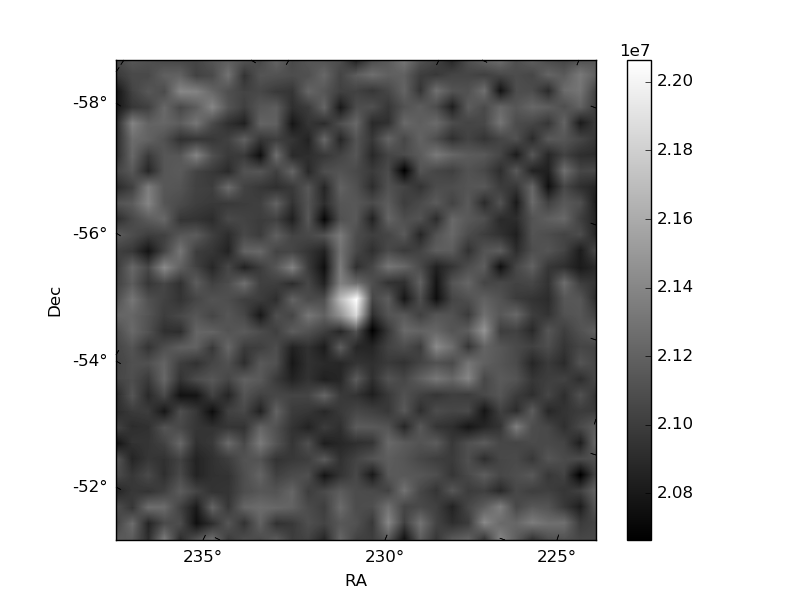 |
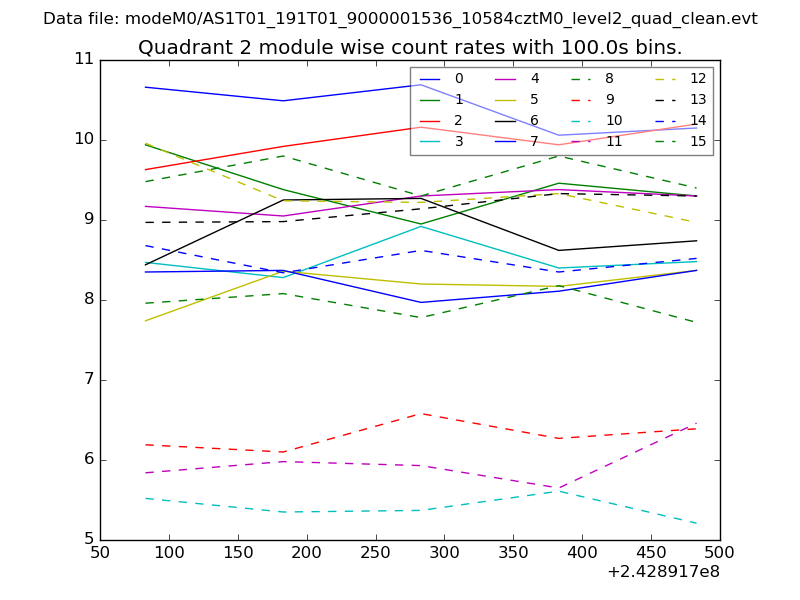
| Module-wise count rates for Quadrant B Data is divided into 100 sec bins |
 |
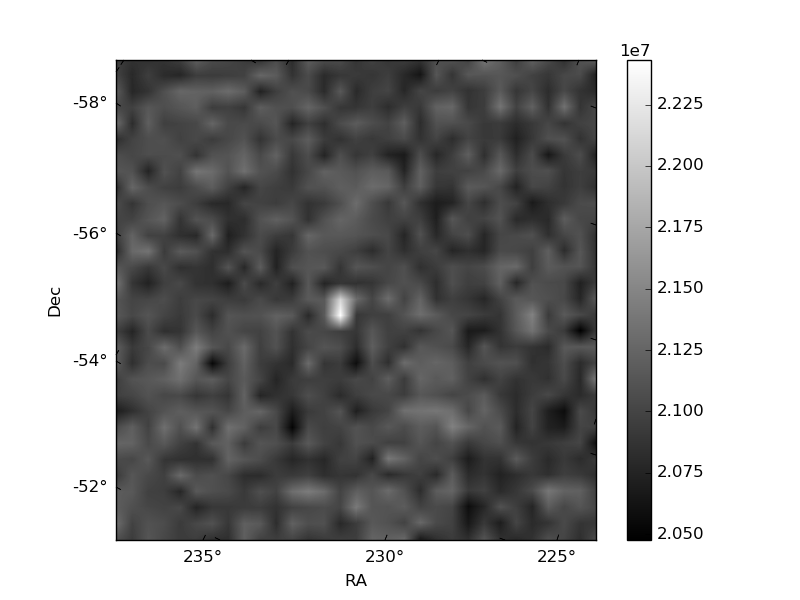 |
| Module-wise count rates for Quadrant C Data is divided into 100 sec bins |
 |
 |
| Module-wise count rates for Quadrant D Data is divided into 100 sec bins |
 |
 |
| Parameter | Plot |
|---|---|
| CZT HV Monitor | 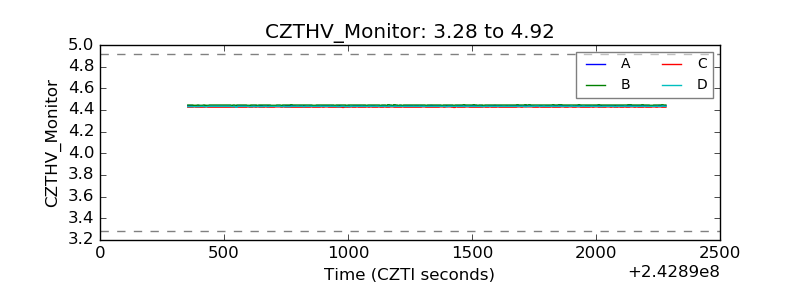 |
| D_VDD | 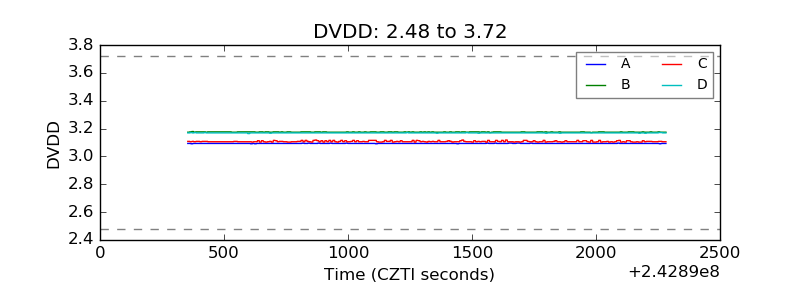 |
| Temperature 1 | 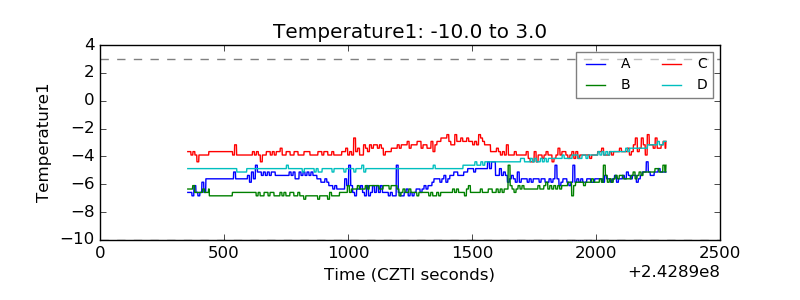 |
| Veto HV Monitor | 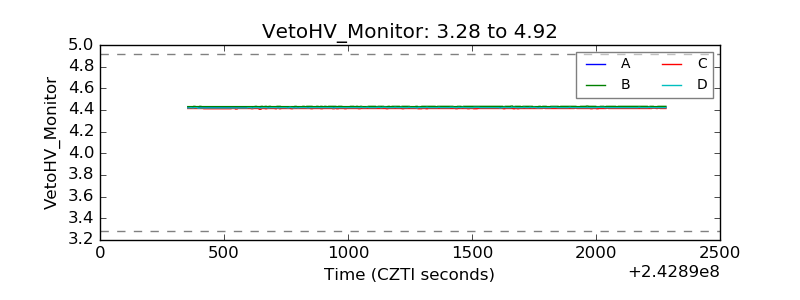 |
| Veto LLD | 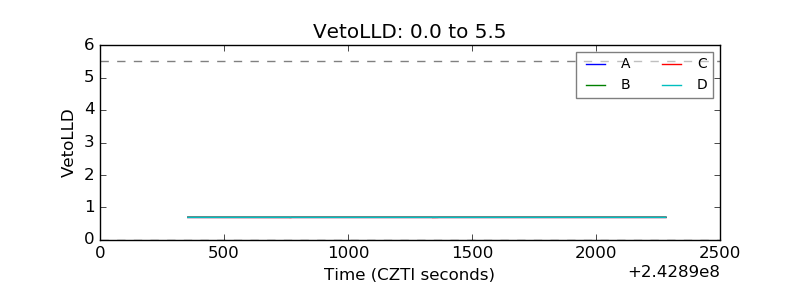 |
| Alpha Counter | 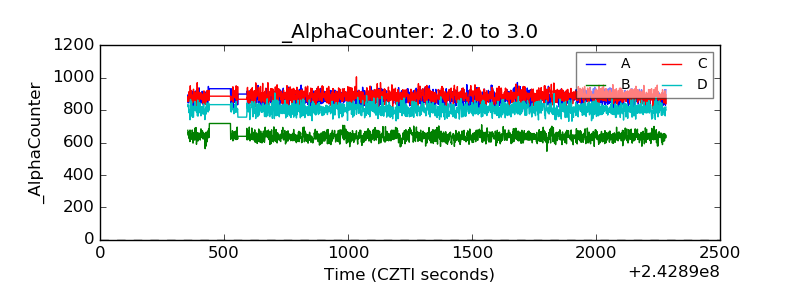 |
| _CPM_Rate | 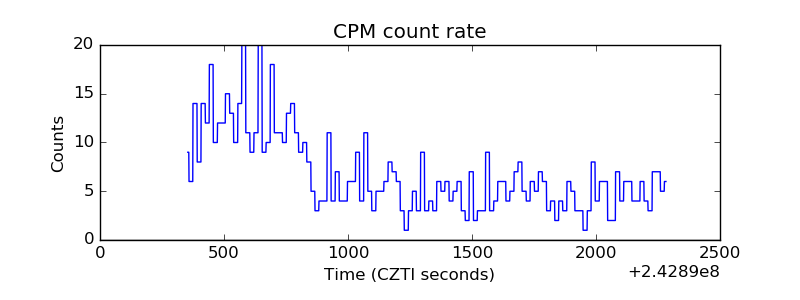 |
| CZT Counter | 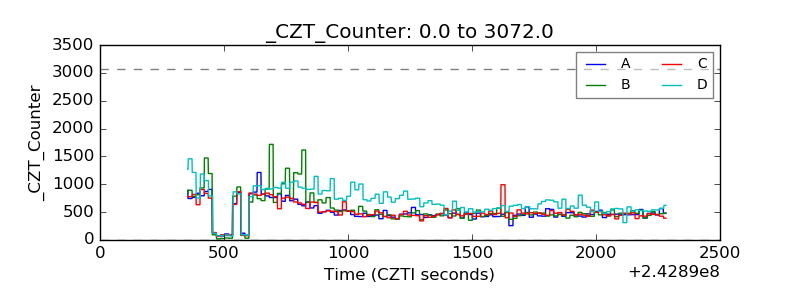 |
| +2.5 Volts monitor | 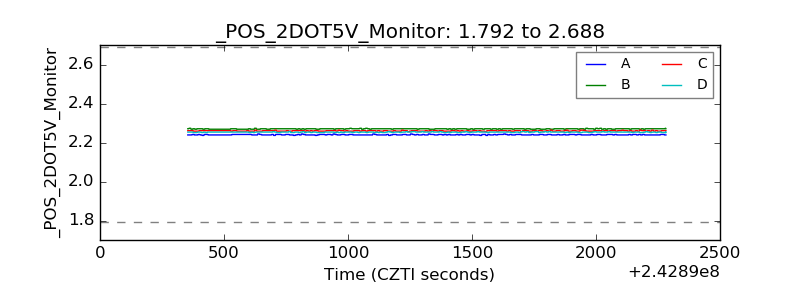 |
| +5 Volts monitor |  |
| _ROLL_ROT | 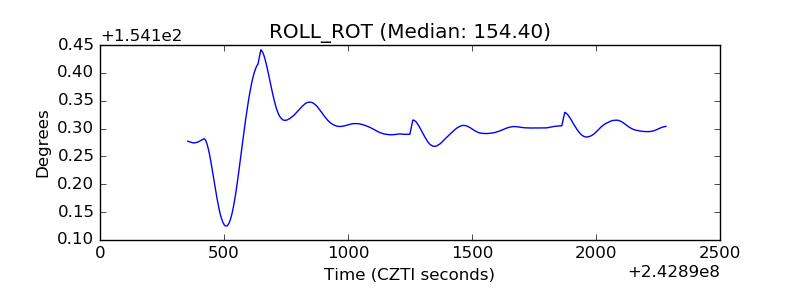 |
| _Roll_DEC | 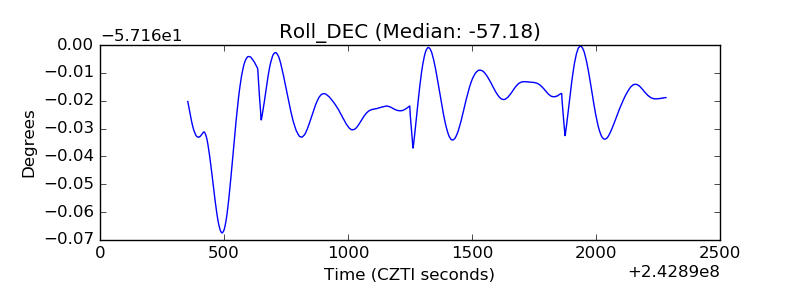 |
| _Roll_RA | 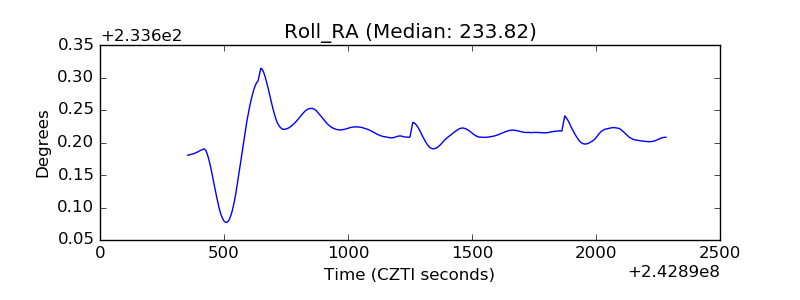 |
| Veto Counter | 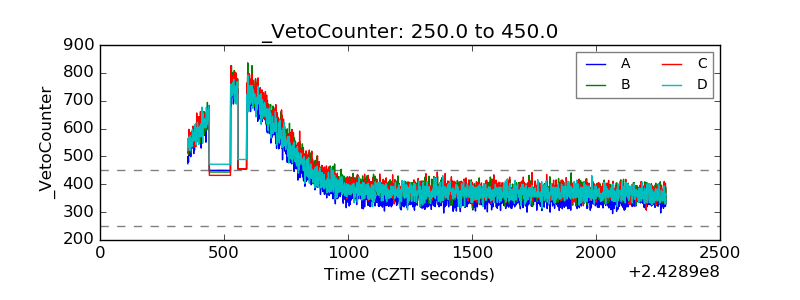 |