| Param | Original file | Final file |
|---|---|---|
| Filename | modeM0/AS1T01_191T01_9000001536_10585cztM0_level2.evt | modeM0/AS1T01_191T01_9000001536_10585cztM0_level2_quad_clean.evt |
| Size (bytes) | 541,748,160 | 104,362,560 |
| Size | 516.7 MB | 99.5 MB |
| Events in quadrant A | 3,310,604 | 682,328 |
| Events in quadrant B | 4,312,839 | 672,405 |
| Events in quadrant C | 3,235,150 | 687,952 |
| Events in quadrant D | 5,080,872 | 637,993 |
| Mode SS | |||
|---|---|---|---|
| Quadrant | BADHDUFLAG | Total packets | Discarded packets |
| A | 0 | 138 | 0 |
| B | 0 | 138 | 0 |
| C | 0 | 138 | 0 |
| D | 0 | 138 | 0 |
| Mode M0 | |||
|---|---|---|---|
| Quadrant | BADHDUFLAG | Total packets | Discarded packets |
| A | 0 | 14265 | 1 |
| B | 0 | 17191 | 0 |
| C | 0 | 14324 | 0 |
| D | 0 | 19907 | 0 |
| Quadrant | Total seconds | Saturated seconds | Saturation percentage |
|---|---|---|---|
| A | 6888 | 220 | 3.193961% |
| B | 6888 | 493 | 7.157375% |
| C | 6888 | 157 | 2.279326% |
| D | 6888 | 223 | 3.237515% |
Noise dominated data is calculated using 1-second bins in cleaned event files. If a bin has >2000 counts, and if more than 50% of those come from <1% of pixels, then it is considered to be noise-dominated and hence unusable.
| Quadrant | # 1 sec bins | Bins with >0 counts | Bins with >2000 counts | High rate bins dominated by noise | Noise dominated (total time) | Noise dominated (detector-on time) | Marked lightcurve |
|---|---|---|---|---|---|---|---|
| A | 6888 | 6888 | 0 | 0 | 0.00% | 0.00% | 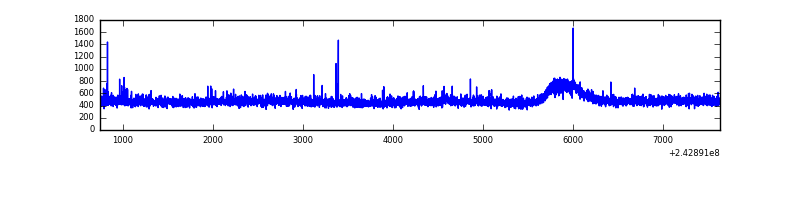 |
| B | 6888 | 6888 | 195 | 195 | 2.83% | 2.83% | 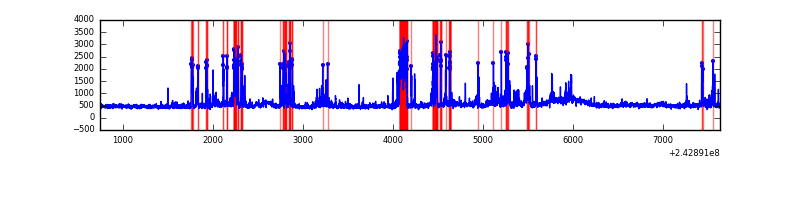 |
| C | 6888 | 6888 | 8 | 8 | 0.12% | 0.12% | 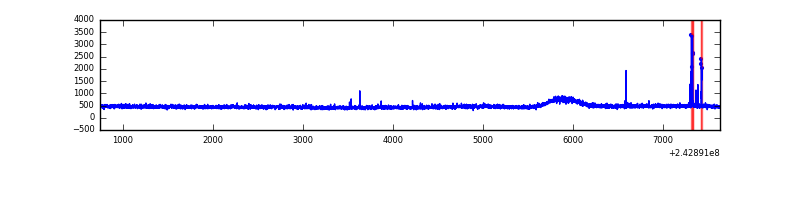 |
| D | 6888 | 6888 | 23 | 23 | 0.33% | 0.33% | 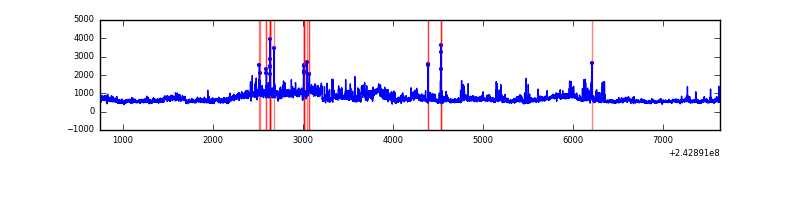 |
Top three noisy pixels from each quadrant. If the there are fewer than three noisy pixels in the level2.evt file, extra rows are filled as -1
| Pixel properties | Quadrant properties | ||||||
|---|---|---|---|---|---|---|---|
| Quadrant | DetID | PixID | Counts | Sigma | Mean | Median | Sigma |
| A | 13 | 251 | 73391 | 417.34 | 836 | 818 | 173.9 |
| A | 1 | 162 | 10800 | 57.4 | 836 | 818 | 173.9 |
| A | 0 | 226 | 7603 | 39.02 | 836 | 818 | 173.9 |
| B | 4 | 239 | 908323 | 5737.67 | 822 | 801 | 158.2 |
| B | 0 | 219 | 114751 | 720.43 | 822 | 801 | 158.2 |
| B | 11 | 51 | 48467 | 301.36 | 822 | 801 | 158.2 |
| C | 14 | 234 | 47815 | 244.1 | 817 | 822 | 192.5 |
| C | 13 | 61 | 6026 | 27.03 | 817 | 822 | 192.5 |
| C | 4 | 175 | 3744 | 15.18 | 817 | 822 | 192.5 |
| D | 2 | 16 | 1174760 | 6031.66 | 803 | 781 | 194.6 |
| D | 8 | 195 | 508332 | 2607.69 | 803 | 781 | 194.6 |
| D | 1 | 52 | 128287 | 655.1 | 803 | 781 | 194.6 |
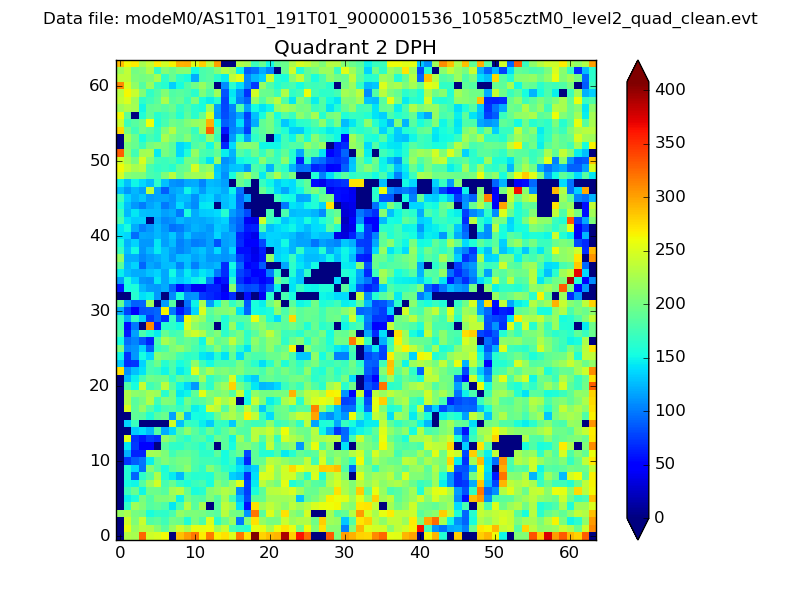
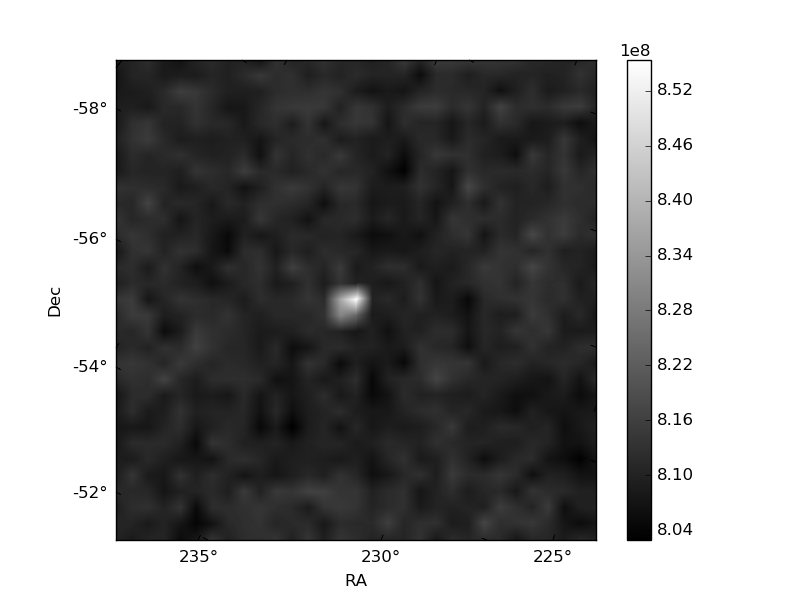
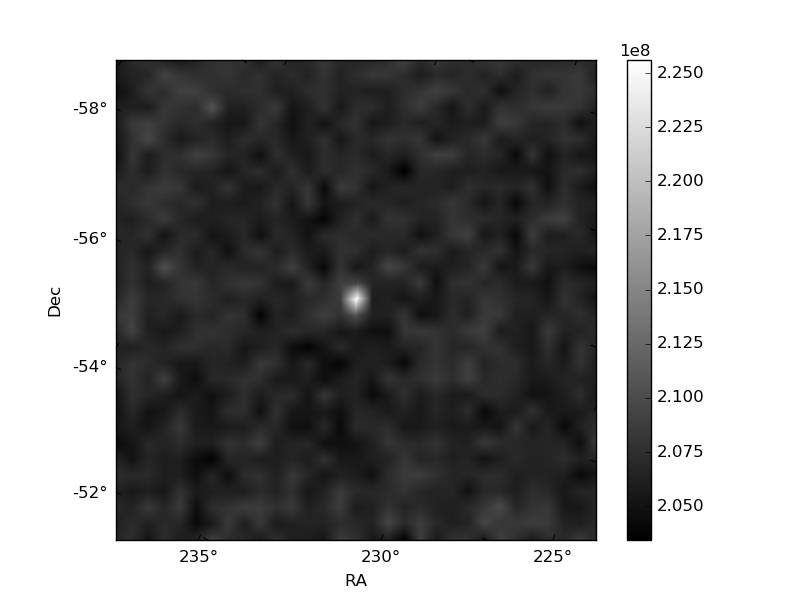
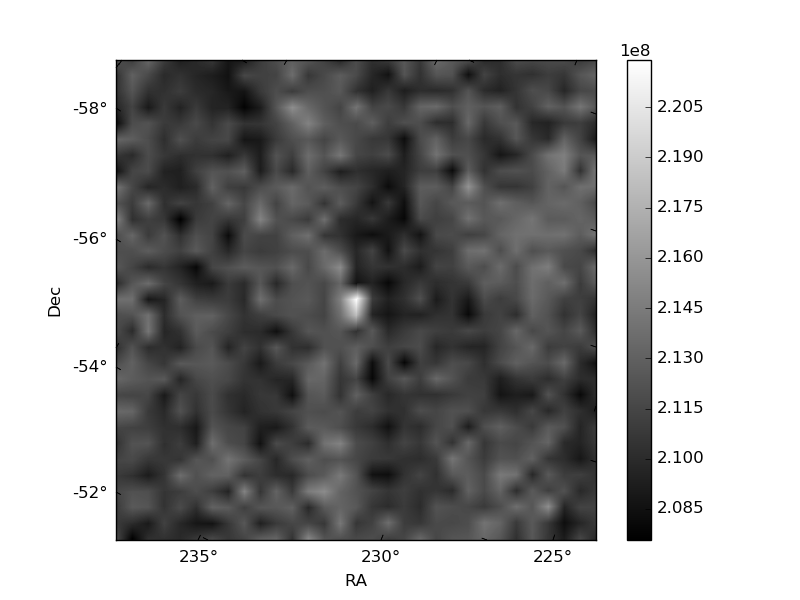
Histogram calculated using DETX and DETY for each event in the final _common_clean file
| Quadrant A | 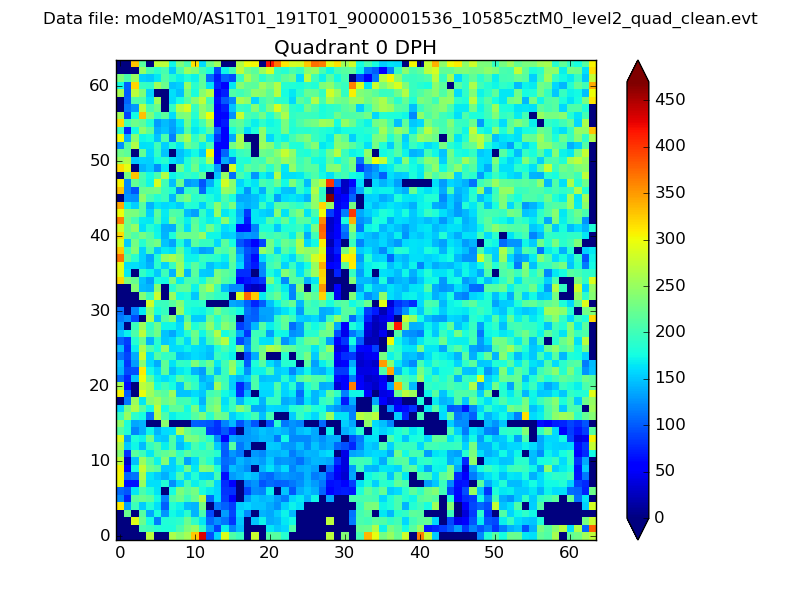 |
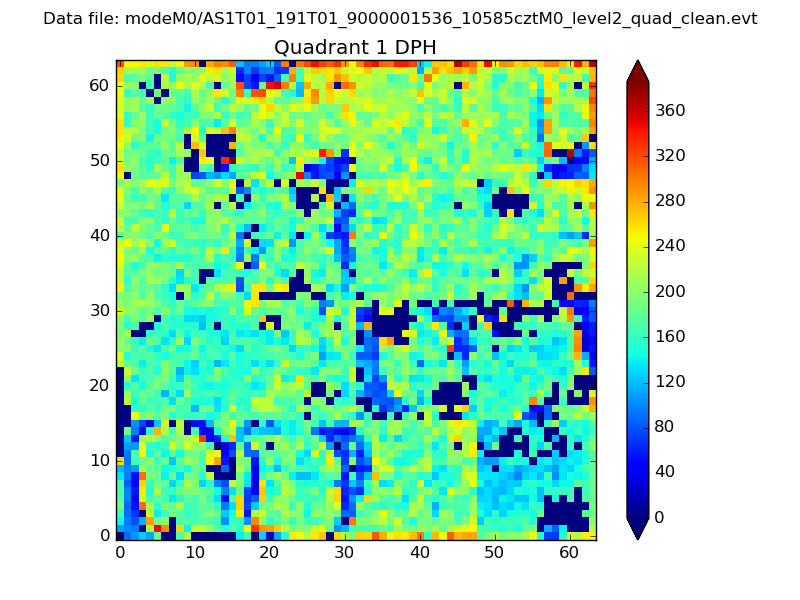 |
Quadrant B |
|---|---|---|---|
| Quadrant D | 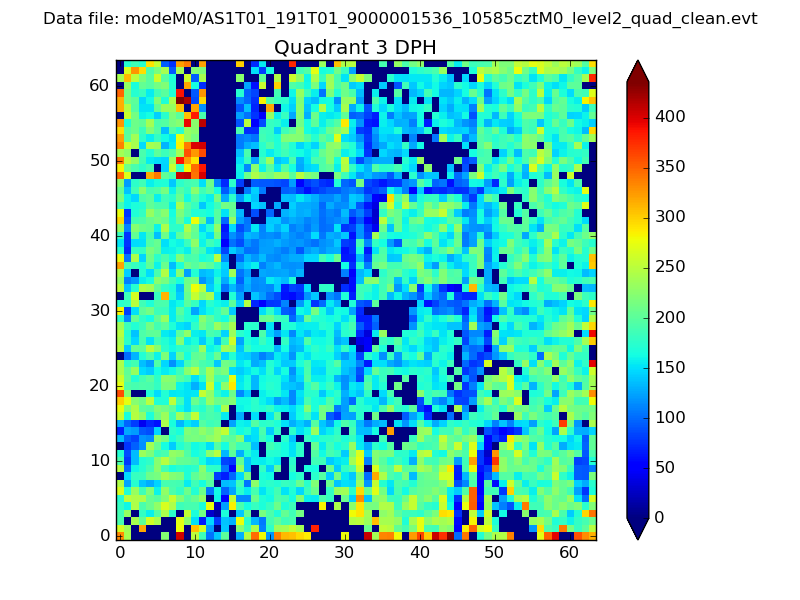 |
 |
Quadrant C |
| Plot type | Count rate plots | Images |
|---|---|---|
| Comparison with Poisson distribution Blue bars denote a histogram of data divided into 1 sec bins. Red curve is a Poisson curve with rate = median count rate of data. |
 |
 |
| Quadrant-wise count rates Data is divided into 100 sec bins |
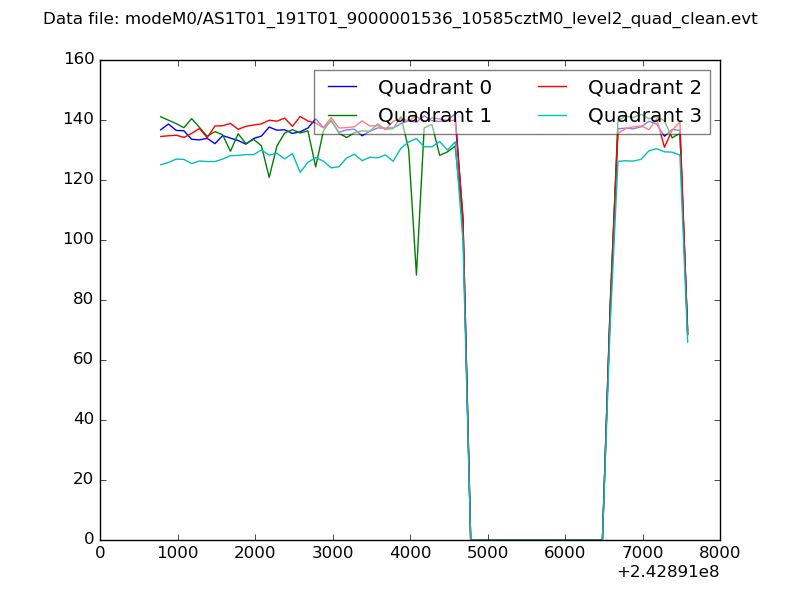 |
|
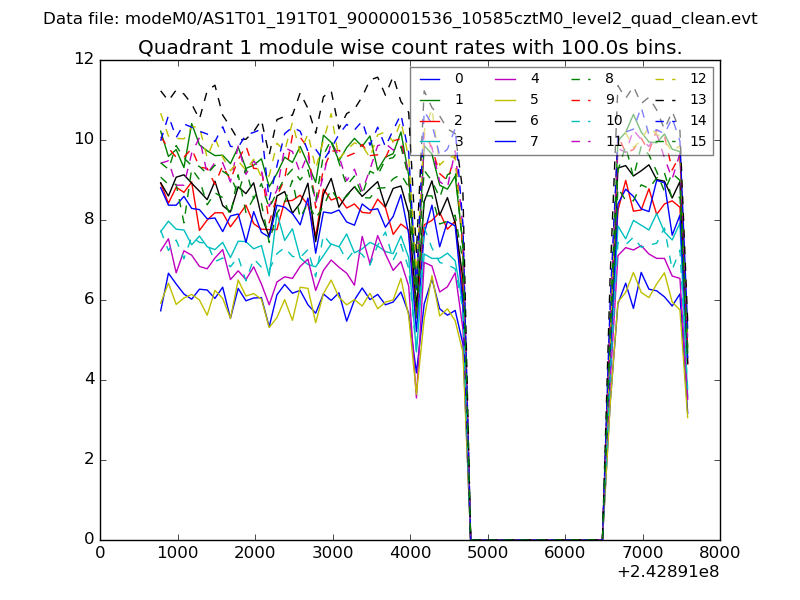
| Module-wise count rates for Quadrant A Data is divided into 100 sec bins |
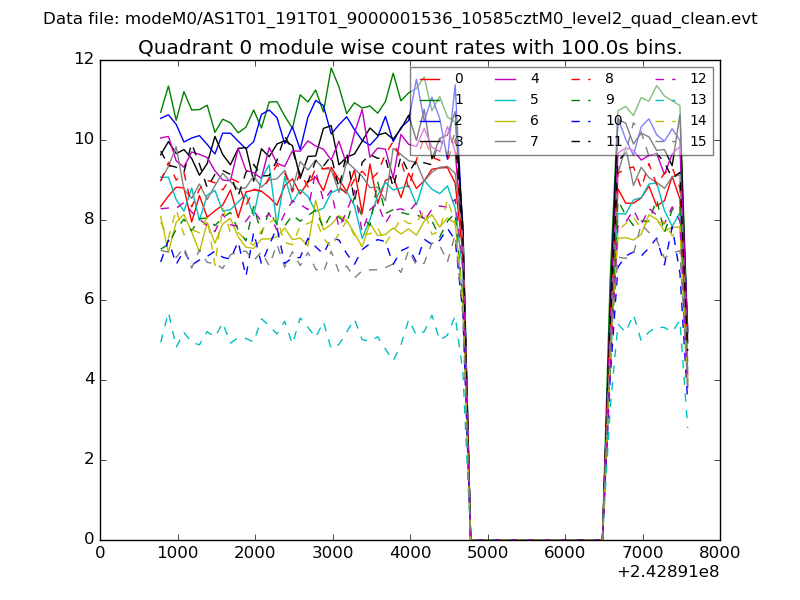 |
 |
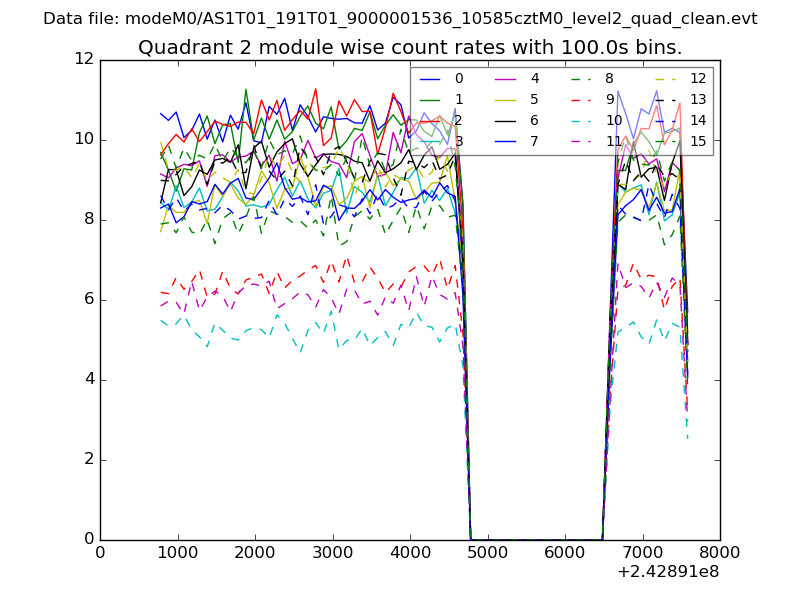
| Module-wise count rates for Quadrant B Data is divided into 100 sec bins |
 |
 |
| Module-wise count rates for Quadrant C Data is divided into 100 sec bins |
 |
 |
| Module-wise count rates for Quadrant D Data is divided into 100 sec bins |
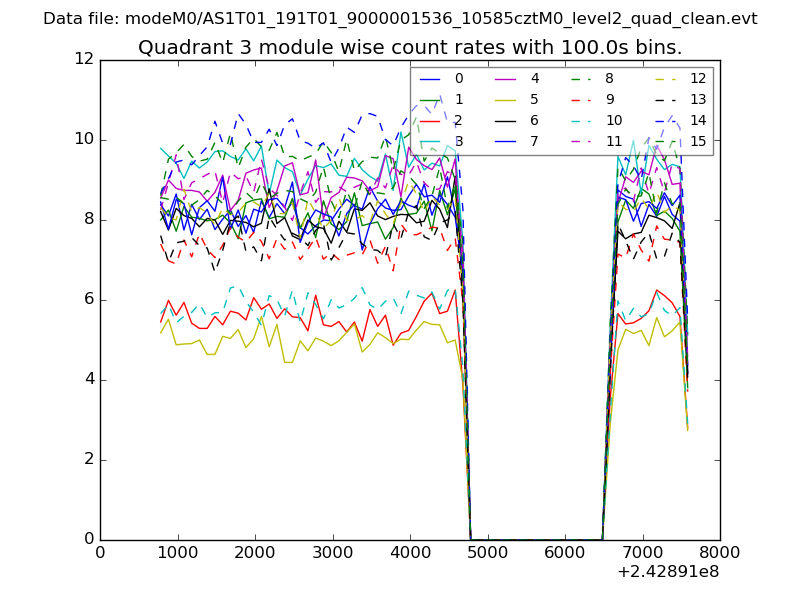 |
 |
| Parameter | Plot |
|---|---|
| CZT HV Monitor | 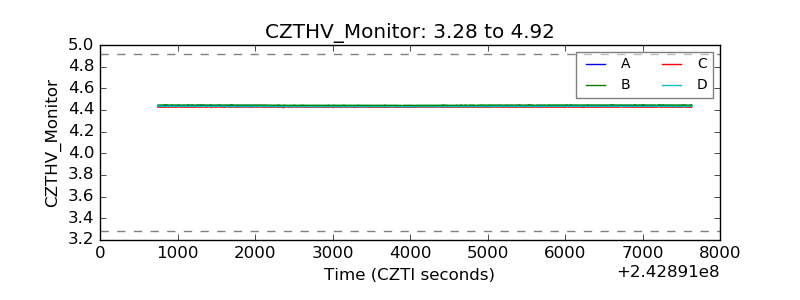 |
| D_VDD | 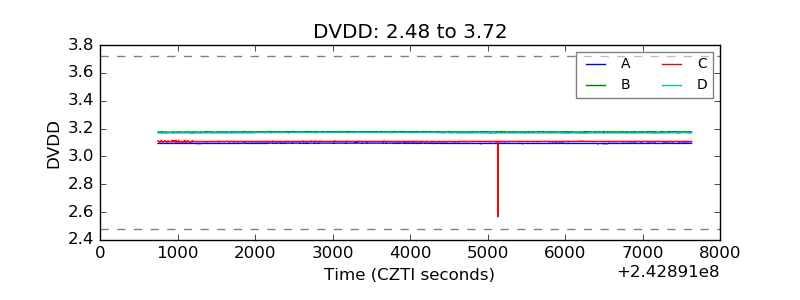 |
| Temperature 1 | 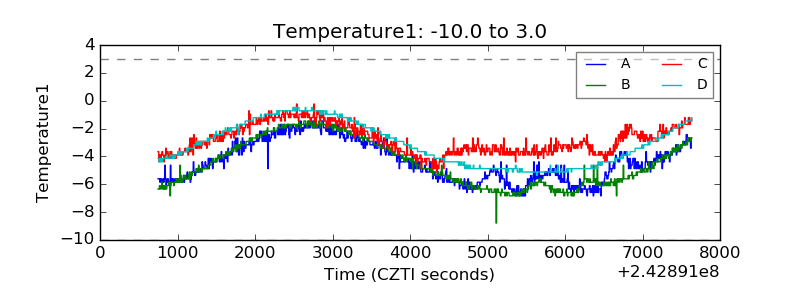 |
| Veto HV Monitor |  |
| Veto LLD |  |
| Alpha Counter | 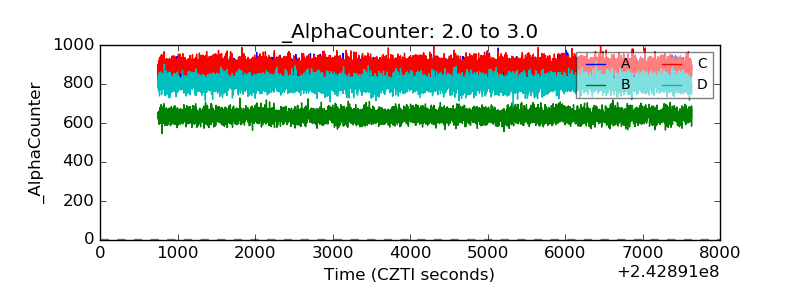 |
| _CPM_Rate | 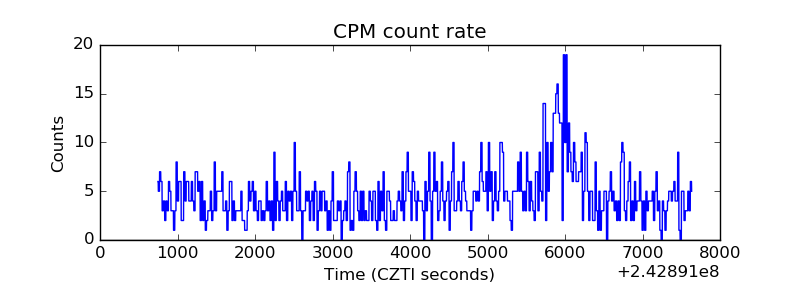 |
| CZT Counter | 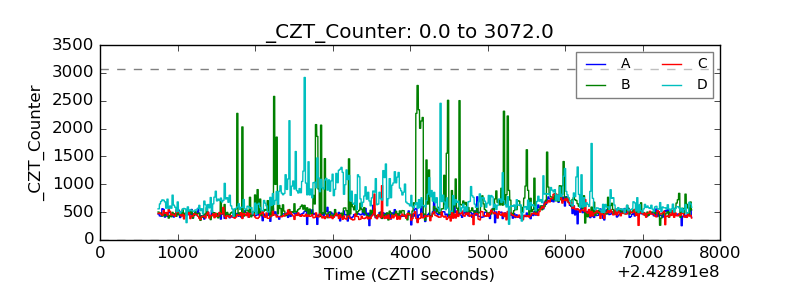 |
| +2.5 Volts monitor |  |
| +5 Volts monitor |  |
| _ROLL_ROT | 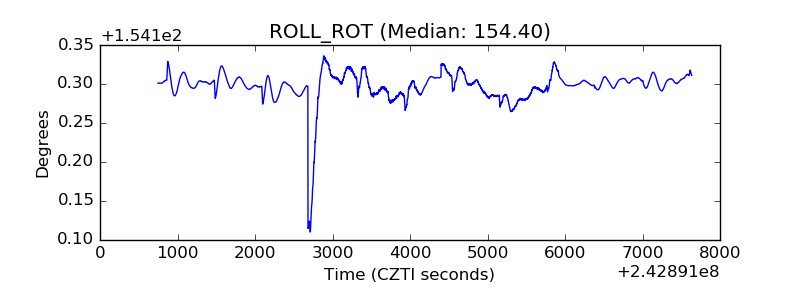 |
| _Roll_DEC | 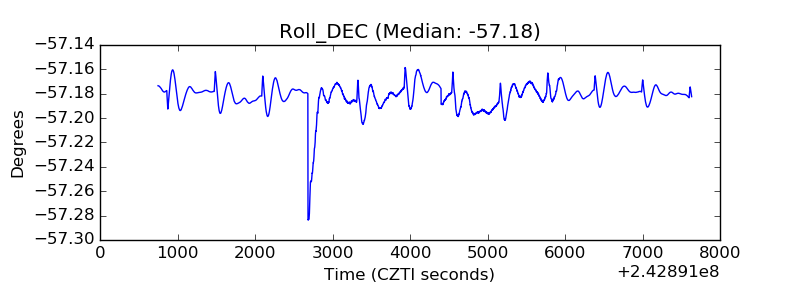 |
| _Roll_RA | 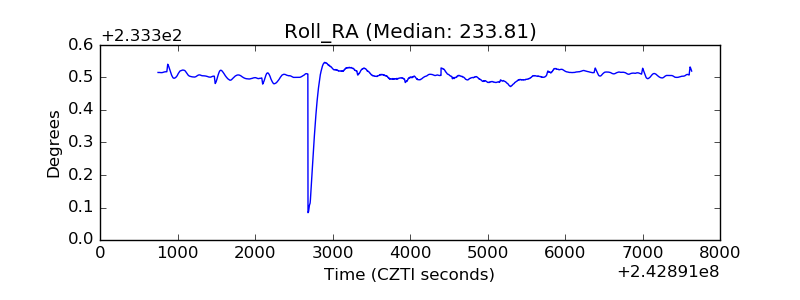 |
| Veto Counter | 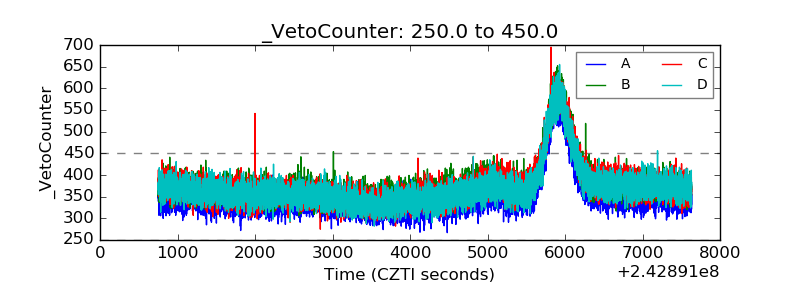 |