| Param | Original file | Final file |
|---|---|---|
| Filename | modeM0/AS1T01_191T01_9000001536_10586cztM0_level2.evt | modeM0/AS1T01_191T01_9000001536_10586cztM0_level2_quad_clean.evt |
| Size (bytes) | 544,973,760 | 112,158,720 |
| Size | 519.7 MB | 107.0 MB |
| Events in quadrant A | 3,333,633 | 738,158 |
| Events in quadrant B | 4,482,026 | 731,719 |
| Events in quadrant C | 3,349,203 | 741,695 |
| Events in quadrant D | 4,862,631 | 695,546 |
| Mode SS | |||
|---|---|---|---|
| Quadrant | BADHDUFLAG | Total packets | Discarded packets |
| A | 0 | 144 | 0 |
| B | 0 | 144 | 0 |
| C | 0 | 144 | 0 |
| D | 0 | 144 | 0 |
| Mode M9 | |||
|---|---|---|---|
| Quadrant | BADHDUFLAG | Total packets | Discarded packets |
| A | 0 | 2 | 0 |
| B | 0 | 2 | 0 |
| C | 0 | 2 | 0 |
| D | 0 | 2 | 0 |
| Mode M0 | |||
|---|---|---|---|
| Quadrant | BADHDUFLAG | Total packets | Discarded packets |
| A | 0 | 14418 | 3 |
| B | 0 | 17783 | 2 |
| C | 0 | 14660 | 2 |
| D | 0 | 19326 | 2 |
| Quadrant | Total seconds | Saturated seconds | Saturation percentage |
|---|---|---|---|
| A | 7028 | 146 | 2.077405% |
| B | 7028 | 328 | 4.667046% |
| C | 7028 | 131 | 1.863973% |
| D | 7028 | 282 | 4.012521% |
Noise dominated data is calculated using 1-second bins in cleaned event files. If a bin has >2000 counts, and if more than 50% of those come from <1% of pixels, then it is considered to be noise-dominated and hence unusable.
| Quadrant | # 1 sec bins | Bins with >0 counts | Bins with >2000 counts | High rate bins dominated by noise | Noise dominated (total time) | Noise dominated (detector-on time) | Marked lightcurve |
|---|---|---|---|---|---|---|---|
| A | 7263 | 7030 | 0 | 0 | 0.00% | 0.00% | 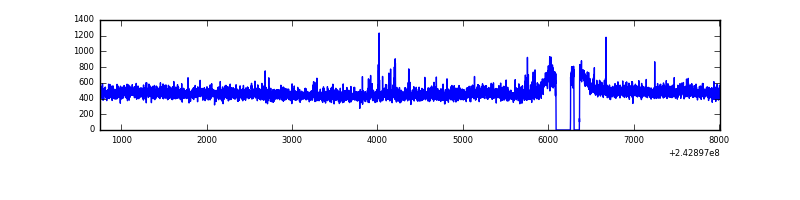 |
| B | 7263 | 7030 | 100 | 100 | 1.38% | 1.42% | 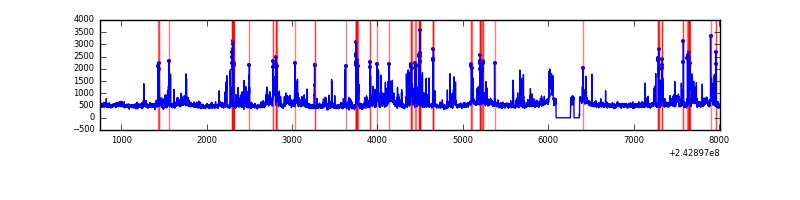 |
| C | 7263 | 7030 | 17 | 17 | 0.23% | 0.24% | 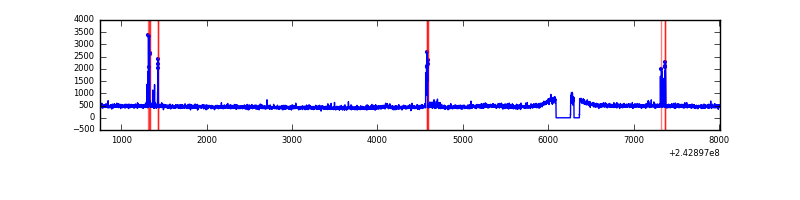 |
| D | 7263 | 7030 | 165 | 165 | 2.27% | 2.35% | 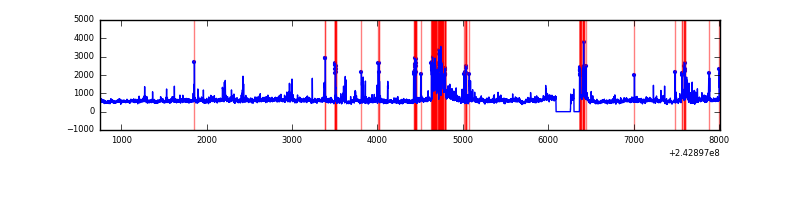 |
Top three noisy pixels from each quadrant. If the there are fewer than three noisy pixels in the level2.evt file, extra rows are filled as -1
| Pixel properties | Quadrant properties | ||||||
|---|---|---|---|---|---|---|---|
| Quadrant | DetID | PixID | Counts | Sigma | Mean | Median | Sigma |
| A | 13 | 251 | 51891 | 291.07 | 845 | 829 | 175.4 |
| A | 1 | 162 | 17818 | 96.84 | 845 | 829 | 175.4 |
| A | 0 | 226 | 7921 | 40.43 | 845 | 829 | 175.4 |
| B | 4 | 239 | 906202 | 5584.81 | 838 | 819 | 162.1 |
| B | 0 | 219 | 111760 | 684.33 | 838 | 819 | 162.1 |
| B | 0 | 168 | 76391 | 466.16 | 838 | 819 | 162.1 |
| C | 4 | 254 | 82572 | 424.19 | 825 | 835 | 192.7 |
| C | 14 | 234 | 44979 | 229.09 | 825 | 835 | 192.7 |
| C | 13 | 61 | 6136 | 27.51 | 825 | 835 | 192.7 |
| D | 1 | 52 | 577059 | 2859.78 | 814 | 792 | 201.5 |
| D | 8 | 195 | 506981 | 2512.01 | 814 | 792 | 201.5 |
| D | 2 | 16 | 425873 | 2109.5 | 814 | 792 | 201.5 |
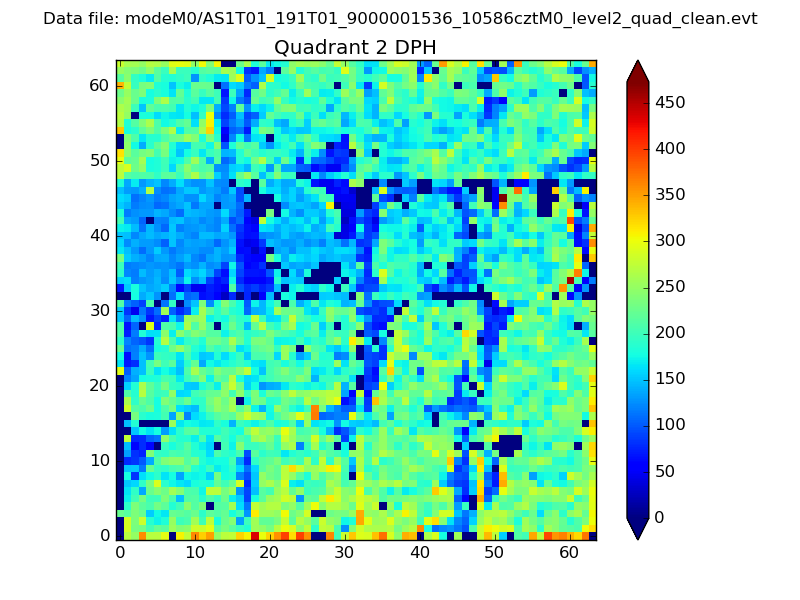
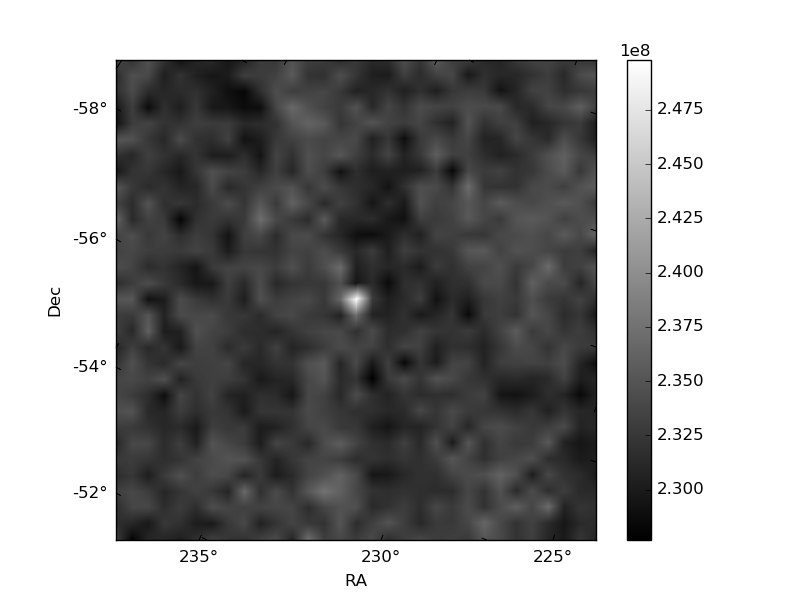
Histogram calculated using DETX and DETY for each event in the final _common_clean file
| Quadrant A | 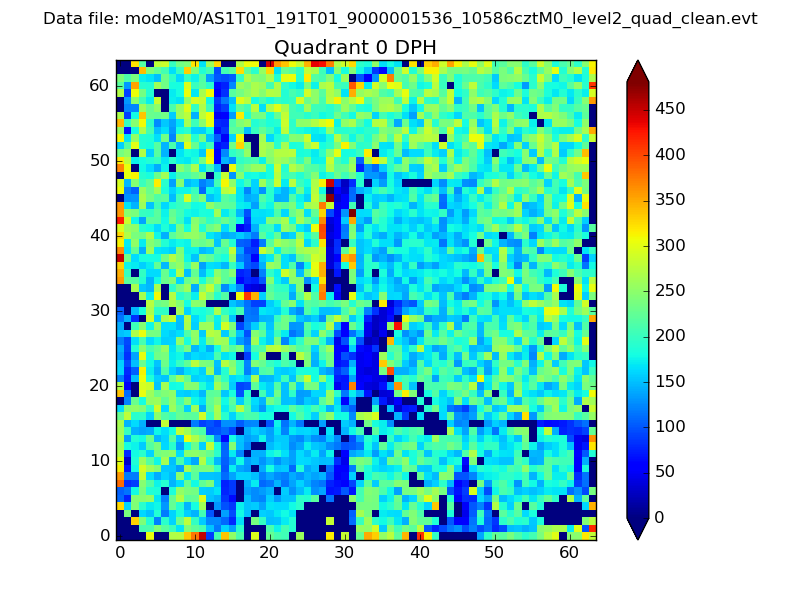 |
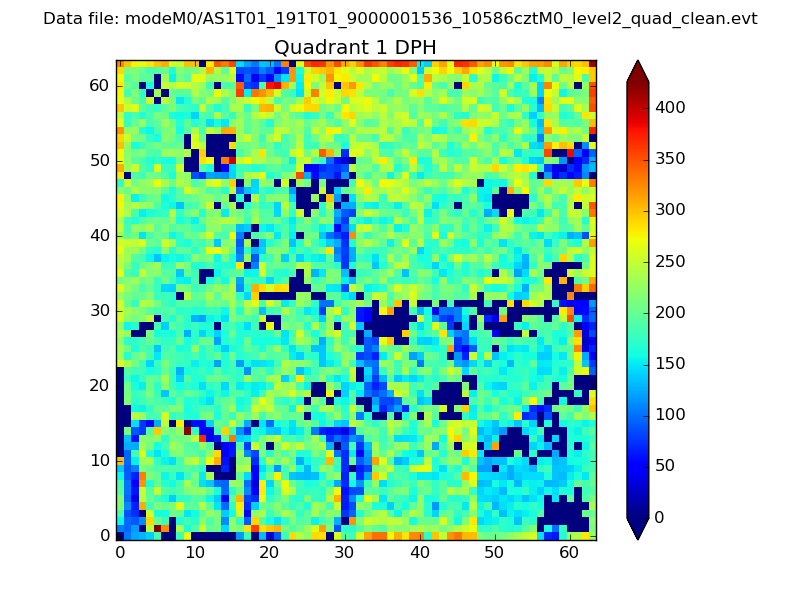 |
Quadrant B |
|---|---|---|---|
| Quadrant D | 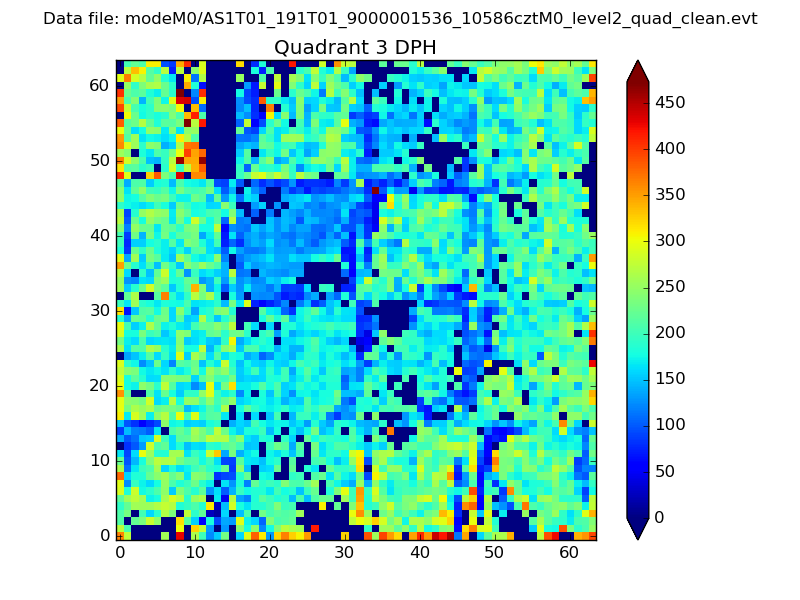 |
 |
Quadrant C |
| Plot type | Count rate plots | Images |
|---|---|---|
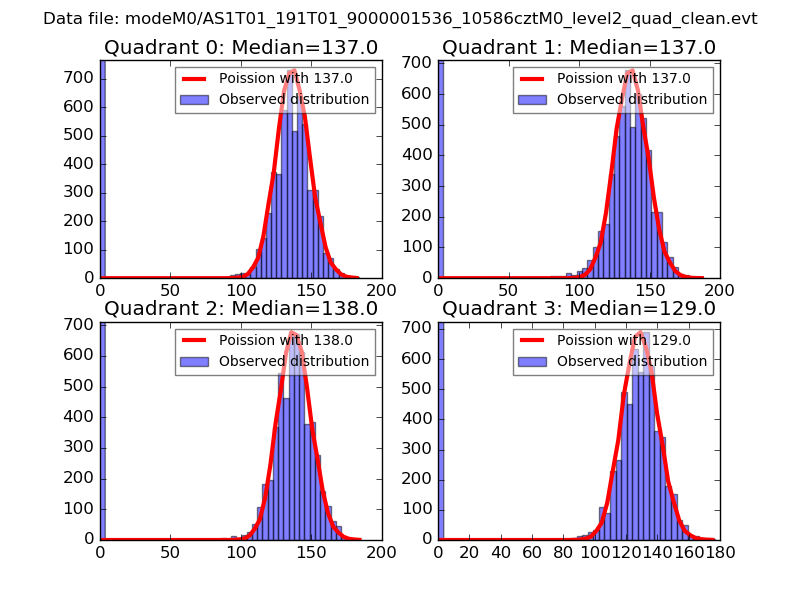
| Comparison with Poisson distribution Blue bars denote a histogram of data divided into 1 sec bins. Red curve is a Poisson curve with rate = median count rate of data. |
 |
 |
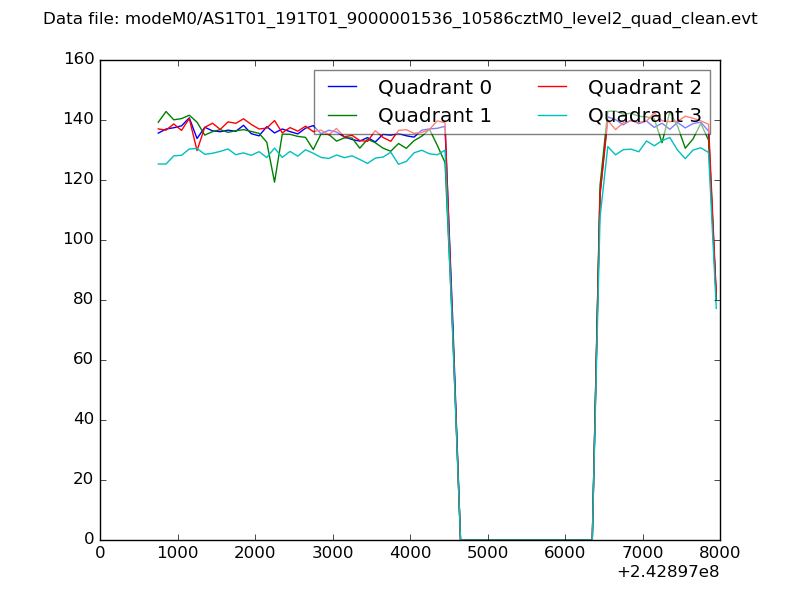
| Quadrant-wise count rates Data is divided into 100 sec bins |
 |
|
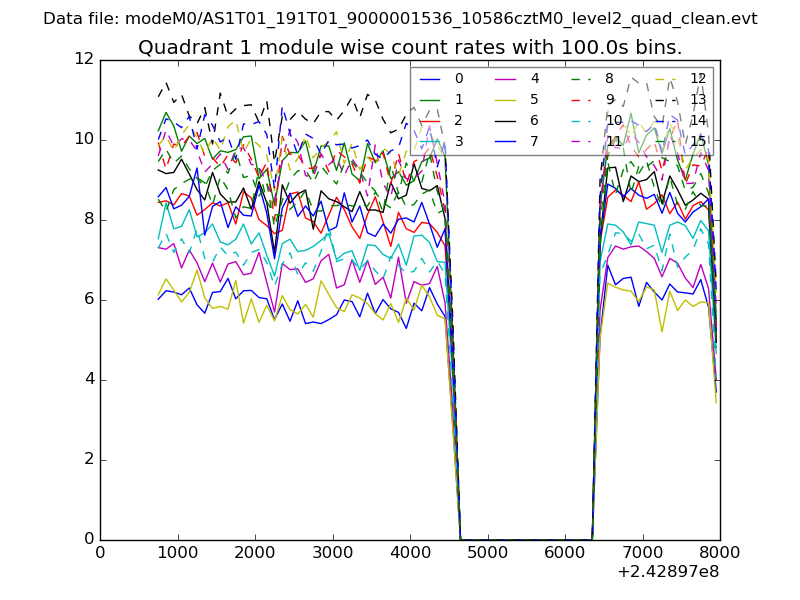
| Module-wise count rates for Quadrant A Data is divided into 100 sec bins |
 |
 |
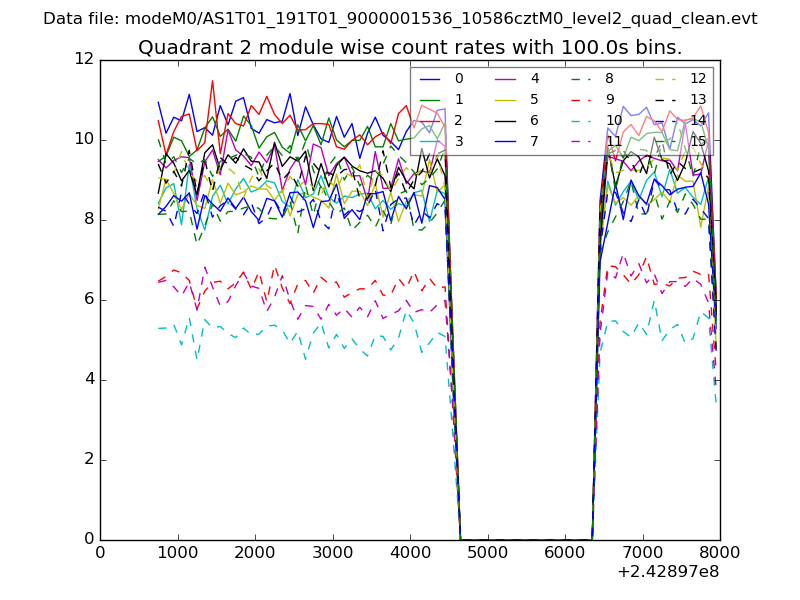
| Module-wise count rates for Quadrant B Data is divided into 100 sec bins |
 |
 |
| Module-wise count rates for Quadrant C Data is divided into 100 sec bins |
 |
 |
| Module-wise count rates for Quadrant D Data is divided into 100 sec bins |
 |
 |
| Parameter | Plot |
|---|---|
| CZT HV Monitor |  |
| D_VDD | 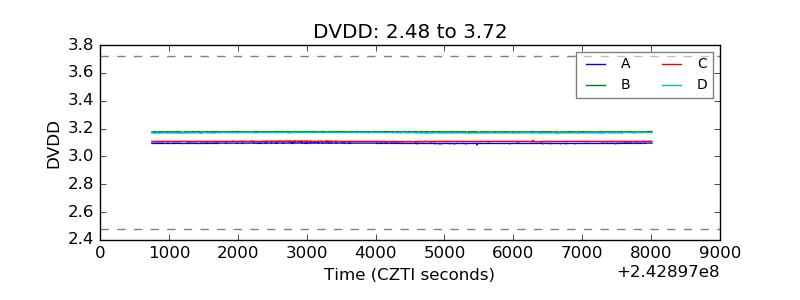 |
| Temperature 1 | 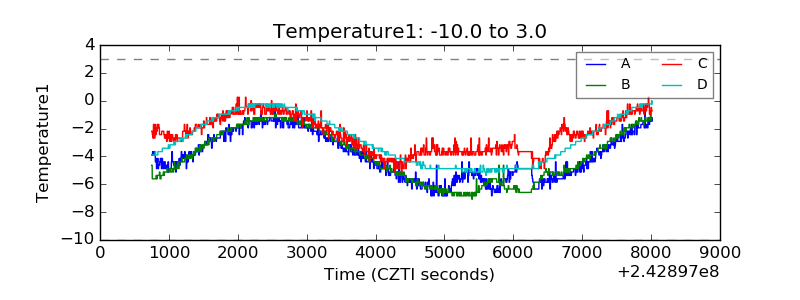 |
| Veto HV Monitor |  |
| Veto LLD | 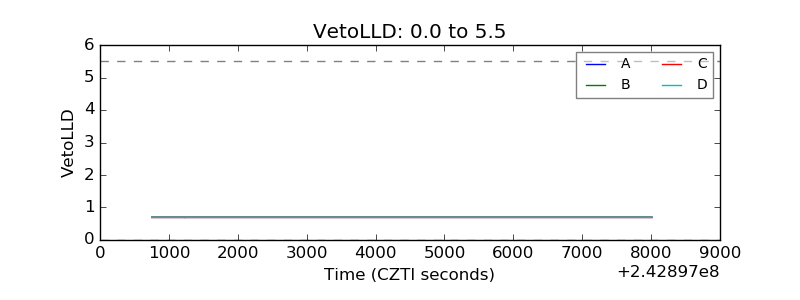 |
| Alpha Counter | 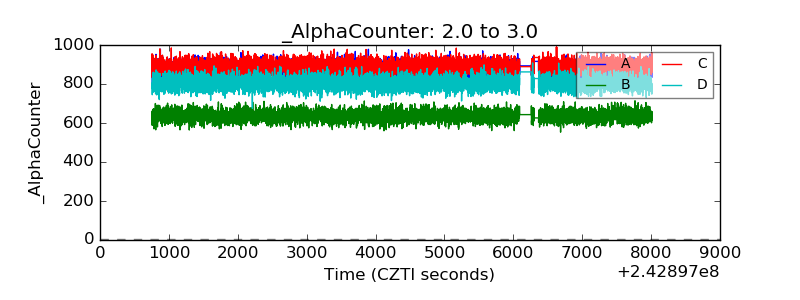 |
| _CPM_Rate | 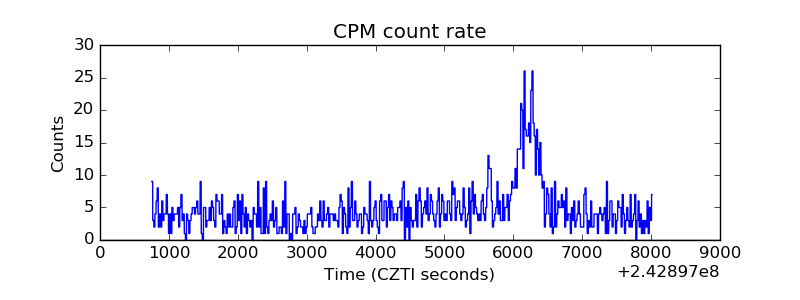 |
| CZT Counter | 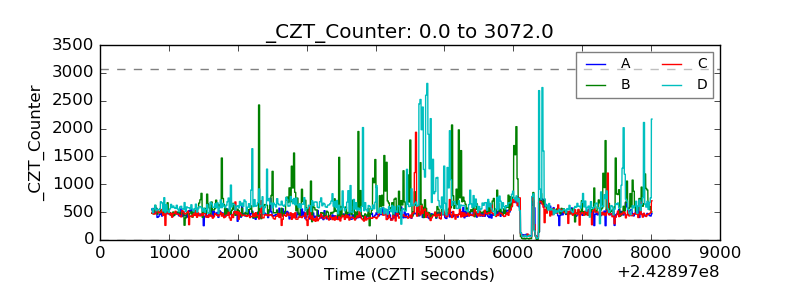 |
| +2.5 Volts monitor |  |
| +5 Volts monitor |  |
| _ROLL_ROT |  |
| _Roll_DEC | 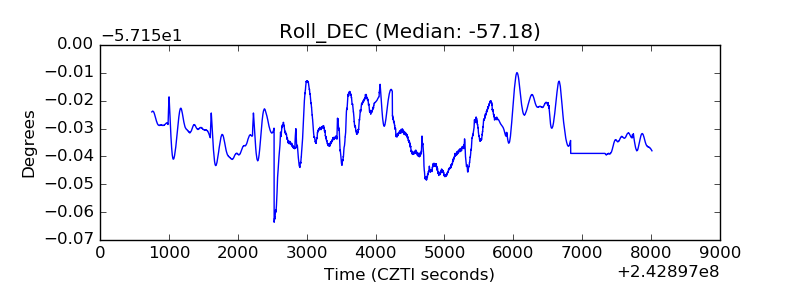 |
| _Roll_RA |  |
| Veto Counter | 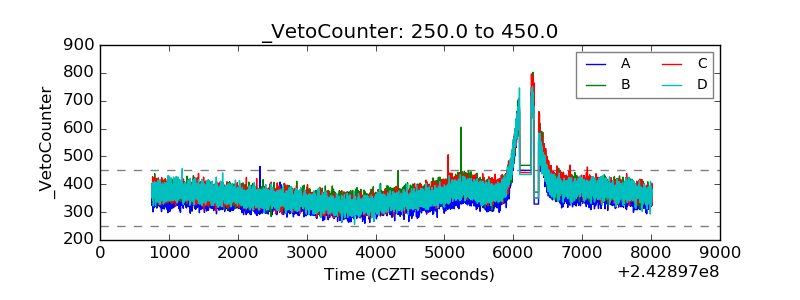 |