| Param | Original file | Final file |
|---|---|---|
| Filename | modeM0/AS1T01_191T01_9000001536_10588cztM0_level2.evt | modeM0/AS1T01_191T01_9000001536_10588cztM0_level2_quad_clean.evt |
| Size (bytes) | 889,110,720 | 157,248,000 |
| Size | 847.9 MB | 150.0 MB |
| Events in quadrant A | 5,245,010 | 1,024,978 |
| Events in quadrant B | 9,033,225 | 963,490 |
| Events in quadrant C | 5,246,583 | 1,032,748 |
| Events in quadrant D | 6,650,026 | 971,588 |
| Mode SS | |||
|---|---|---|---|
| Quadrant | BADHDUFLAG | Total packets | Discarded packets |
| A | 0 | 226 | 0 |
| B | 0 | 226 | 0 |
| C | 0 | 226 | 0 |
| D | 0 | 226 | 0 |
| Mode M9 | |||
|---|---|---|---|
| Quadrant | BADHDUFLAG | Total packets | Discarded packets |
| A | 0 | 12 | 0 |
| B | 0 | 12 | 0 |
| C | 0 | 12 | 0 |
| D | 0 | 12 | 0 |
| Mode M0 | |||
|---|---|---|---|
| Quadrant | BADHDUFLAG | Total packets | Discarded packets |
| A | 0 | 22872 | 3 |
| B | 0 | 34154 | 2 |
| C | 0 | 23267 | 2 |
| D | 0 | 26703 | 2 |
| Quadrant | Total seconds | Saturated seconds | Saturation percentage |
|---|---|---|---|
| A | 11121 | 96 | 0.863232% |
| B | 11121 | 1161 | 10.439709% |
| C | 11121 | 52 | 0.467584% |
| D | 11121 | 144 | 1.294848% |
Noise dominated data is calculated using 1-second bins in cleaned event files. If a bin has >2000 counts, and if more than 50% of those come from <1% of pixels, then it is considered to be noise-dominated and hence unusable.
| Quadrant | # 1 sec bins | Bins with >0 counts | Bins with >2000 counts | High rate bins dominated by noise | Noise dominated (total time) | Noise dominated (detector-on time) | Marked lightcurve |
|---|---|---|---|---|---|---|---|
| A | 12297 | 11123 | 0 | 0 | 0.00% | 0.00% | 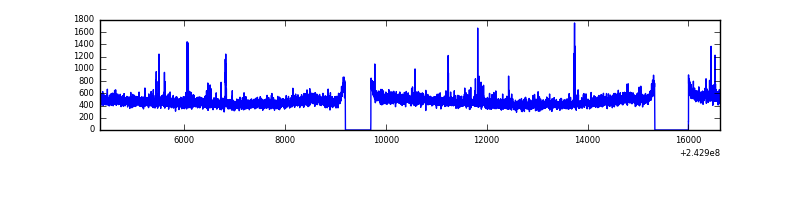 |
| B | 12297 | 11123 | 843 | 843 | 6.86% | 7.58% | 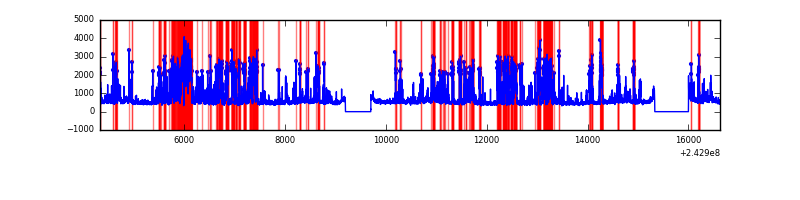 |
| C | 12297 | 11123 | 10 | 10 | 0.08% | 0.09% | 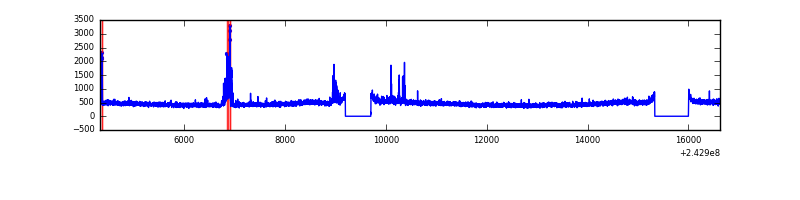 |
| D | 12297 | 11123 | 62 | 62 | 0.50% | 0.56% | 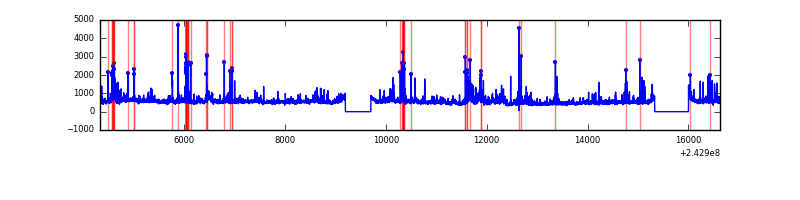 |
Top three noisy pixels from each quadrant. If the there are fewer than three noisy pixels in the level2.evt file, extra rows are filled as -1
| Pixel properties | Quadrant properties | ||||||
|---|---|---|---|---|---|---|---|
| Quadrant | DetID | PixID | Counts | Sigma | Mean | Median | Sigma |
| A | 13 | 251 | 92231 | 333.58 | 1323 | 1298 | 272.6 |
| A | 1 | 162 | 28737 | 100.66 | 1323 | 1298 | 272.6 |
| A | 1 | 178 | 12087 | 39.58 | 1323 | 1298 | 272.6 |
| B | 4 | 239 | 3451894 | 14033.72 | 1281 | 1254 | 245.9 |
| B | 15 | 185 | 232865 | 941.96 | 1281 | 1254 | 245.9 |
| B | 0 | 219 | 139417 | 561.91 | 1281 | 1254 | 245.9 |
| C | 4 | 254 | 217201 | 725.31 | 1283 | 1297 | 297.7 |
| C | 4 | 175 | 11964 | 35.83 | 1283 | 1297 | 297.7 |
| C | 14 | 234 | 9902 | 28.91 | 1283 | 1297 | 297.7 |
| D | 2 | 16 | 462295 | 1484.48 | 1272 | 1240 | 310.6 |
| D | 8 | 195 | 395641 | 1269.87 | 1272 | 1240 | 310.6 |
| D | 5 | 222 | 259999 | 833.14 | 1272 | 1240 | 310.6 |
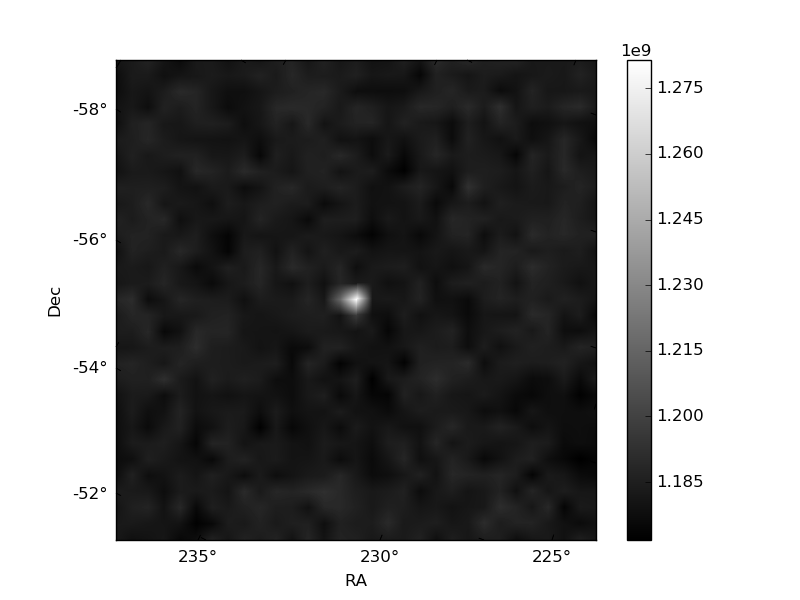
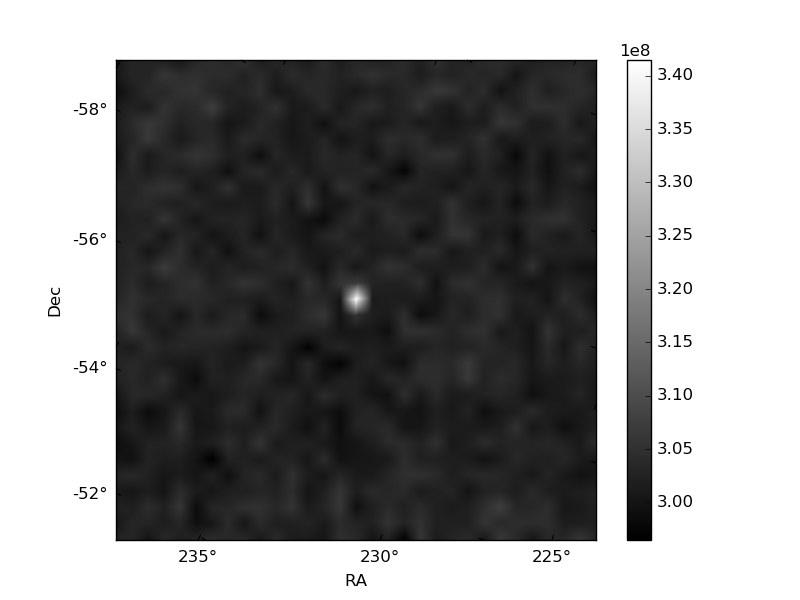
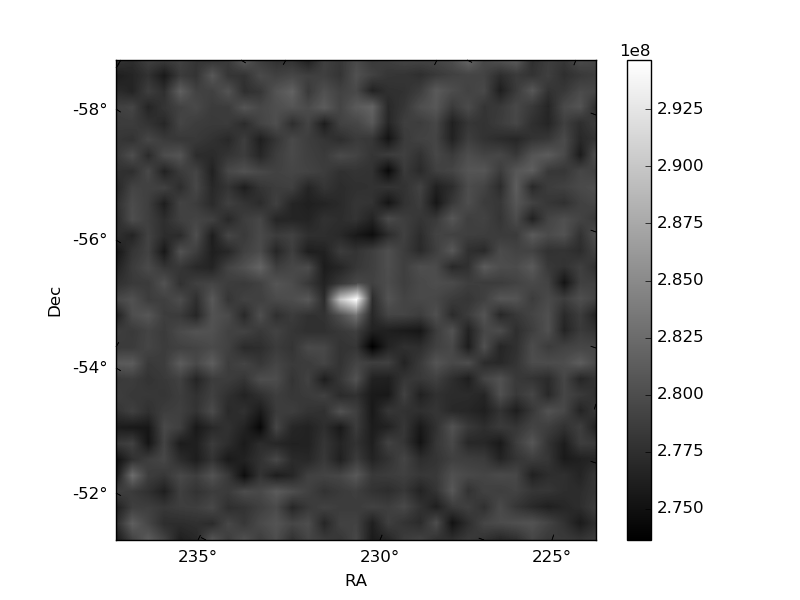
Histogram calculated using DETX and DETY for each event in the final _common_clean file
| Quadrant A | 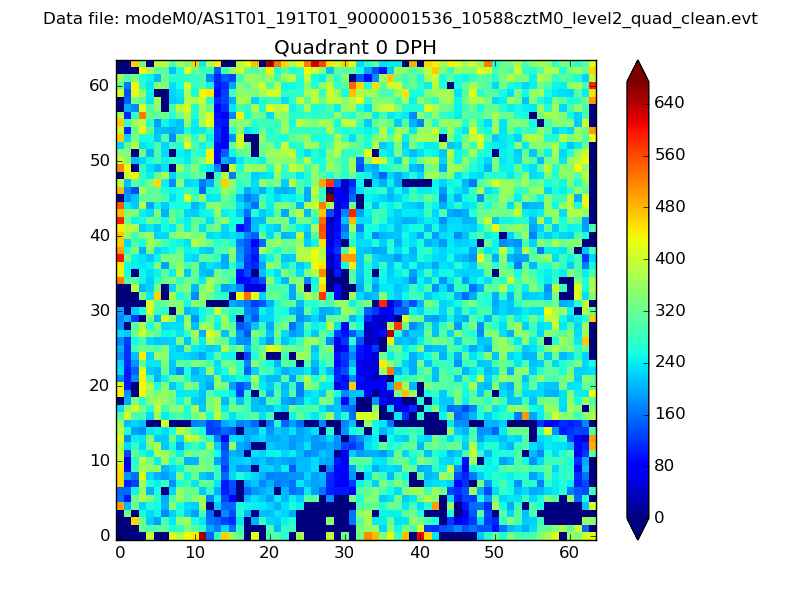 |
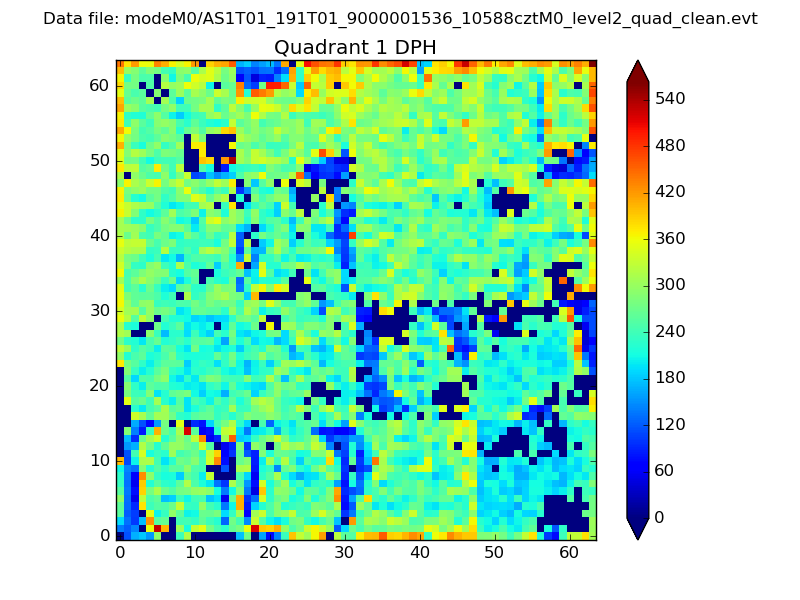 |
Quadrant B |
|---|---|---|---|
| Quadrant D | 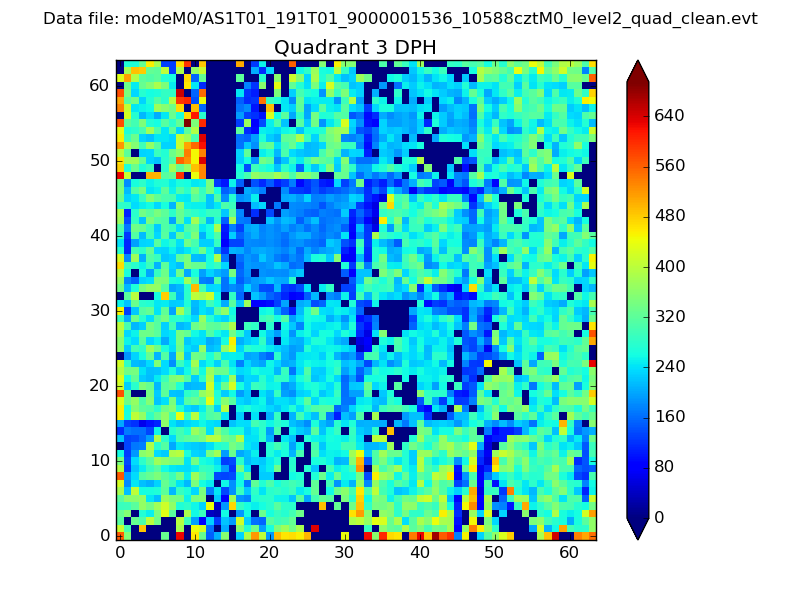 |
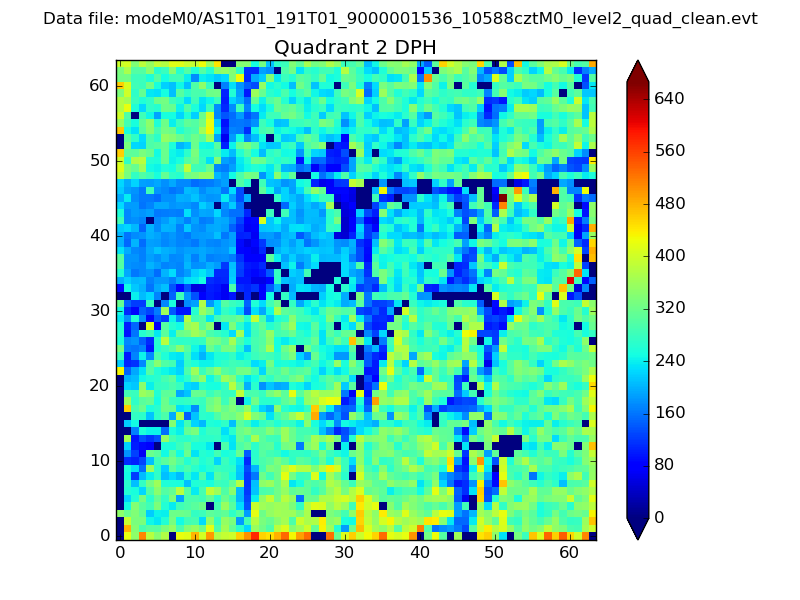 |
Quadrant C |
| Plot type | Count rate plots | Images |
|---|---|---|
| Comparison with Poisson distribution Blue bars denote a histogram of data divided into 1 sec bins. Red curve is a Poisson curve with rate = median count rate of data. |
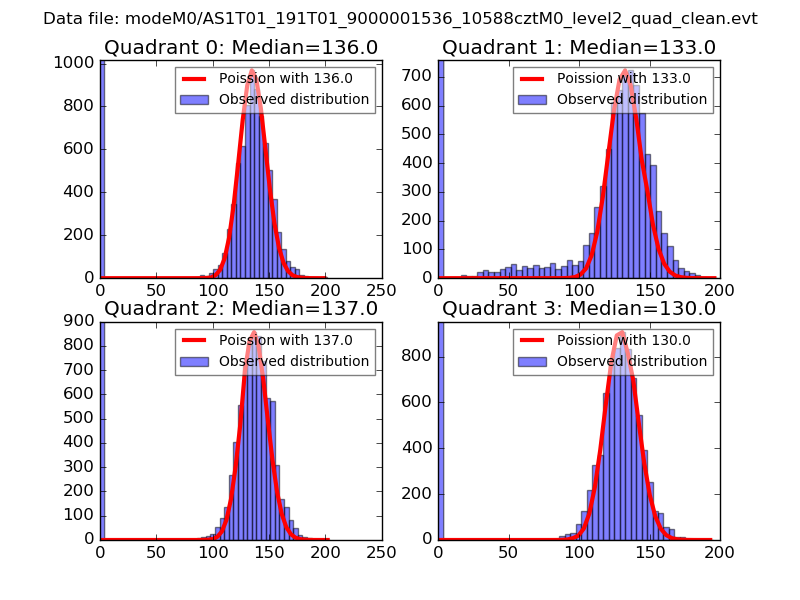 |
 |
| Quadrant-wise count rates Data is divided into 100 sec bins |
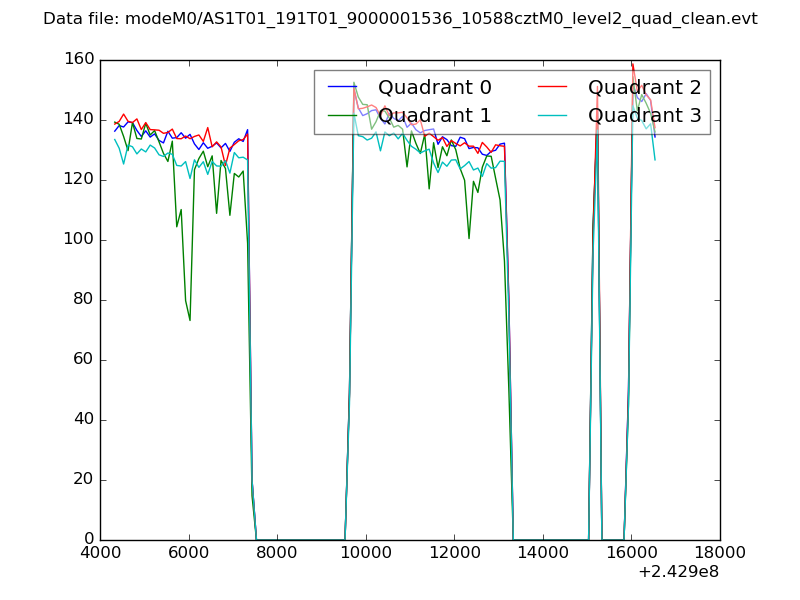 |
|
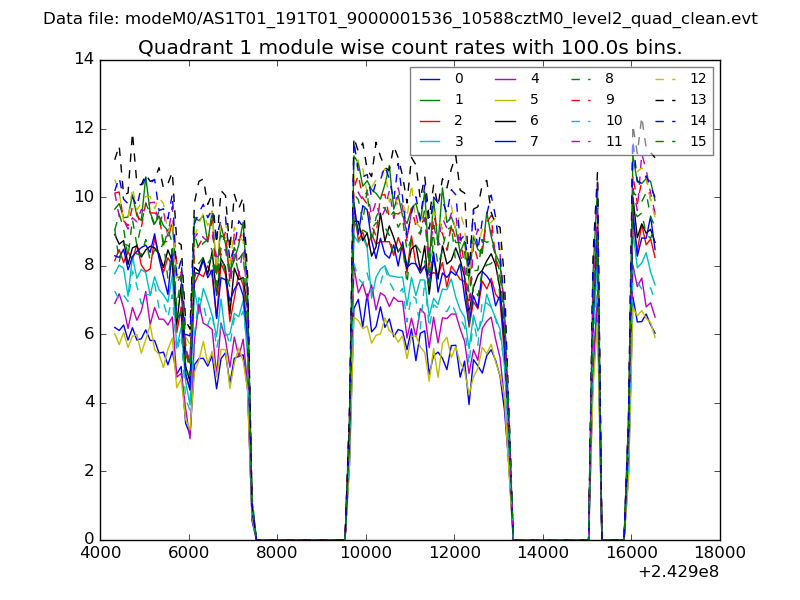
| Module-wise count rates for Quadrant A Data is divided into 100 sec bins |
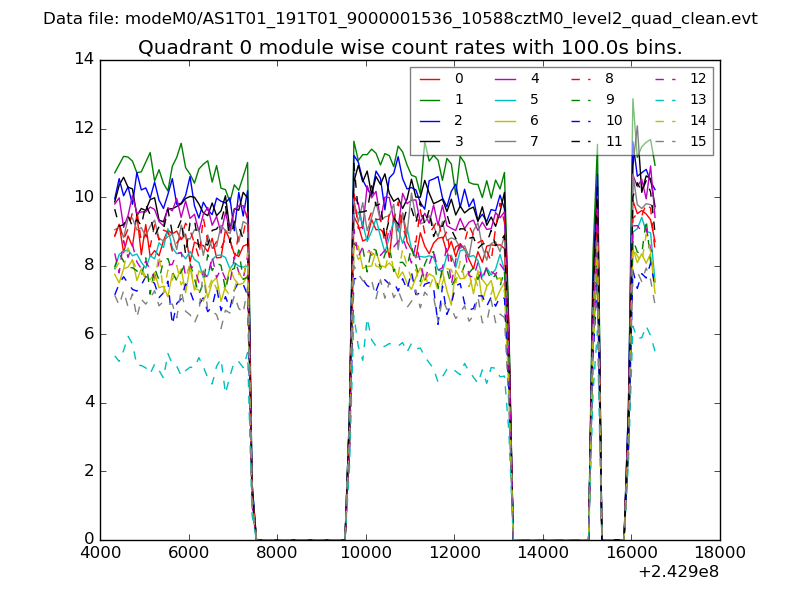 |
 |
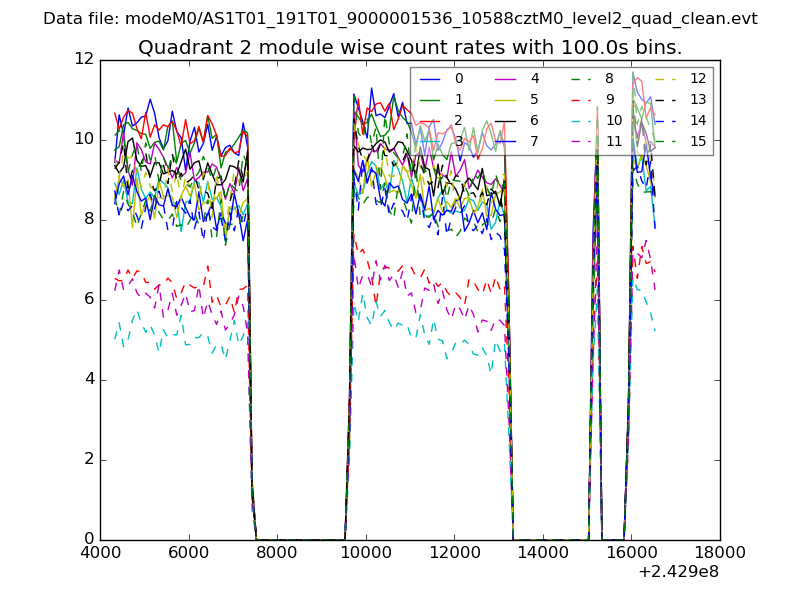
| Module-wise count rates for Quadrant B Data is divided into 100 sec bins |
 |
 |
| Module-wise count rates for Quadrant C Data is divided into 100 sec bins |
 |
 |
| Module-wise count rates for Quadrant D Data is divided into 100 sec bins |
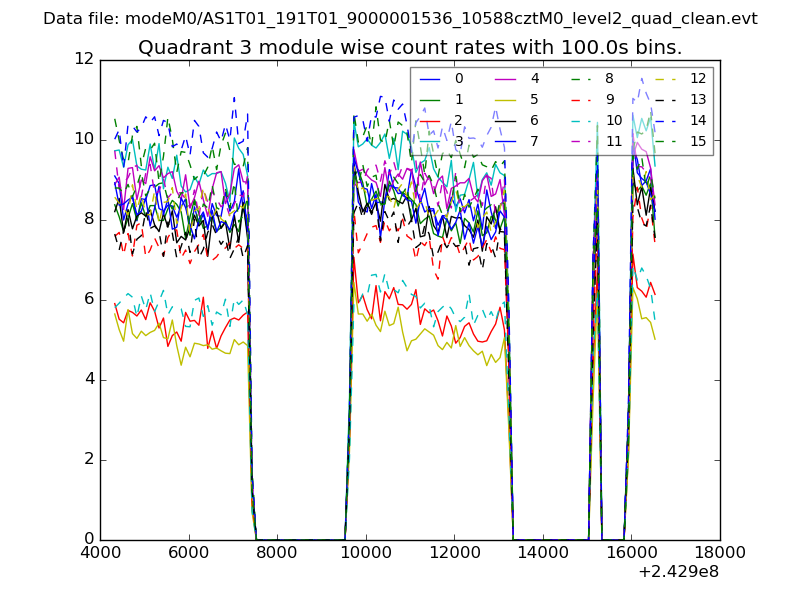 |
 |
| Parameter | Plot |
|---|---|
| CZT HV Monitor | 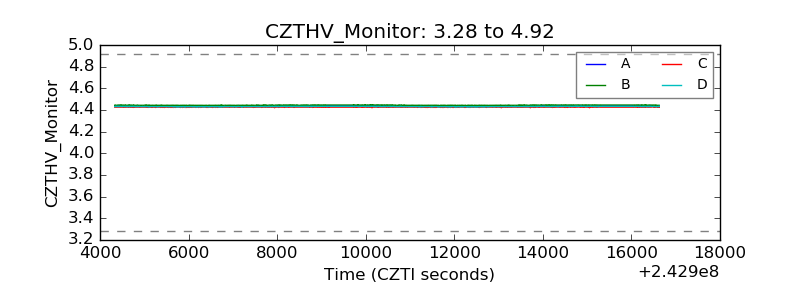 |
| D_VDD | 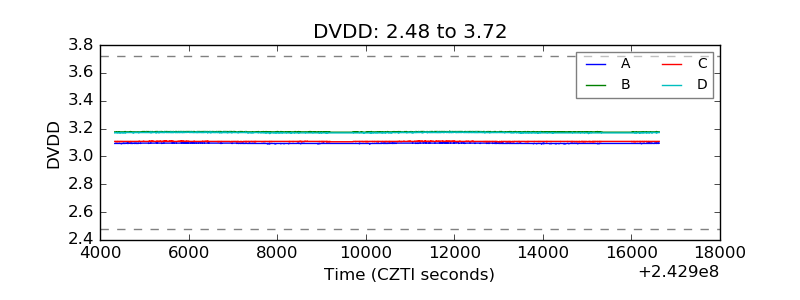 |
| Temperature 1 | 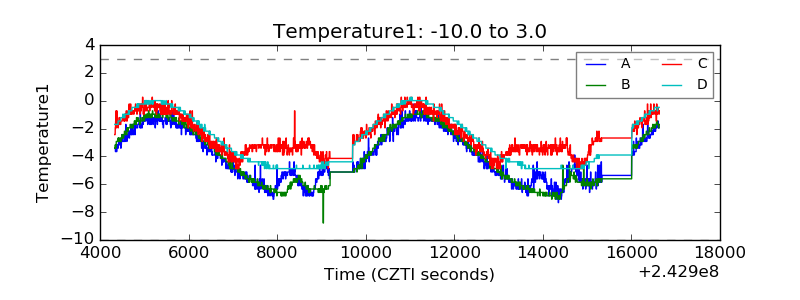 |
| Veto HV Monitor | 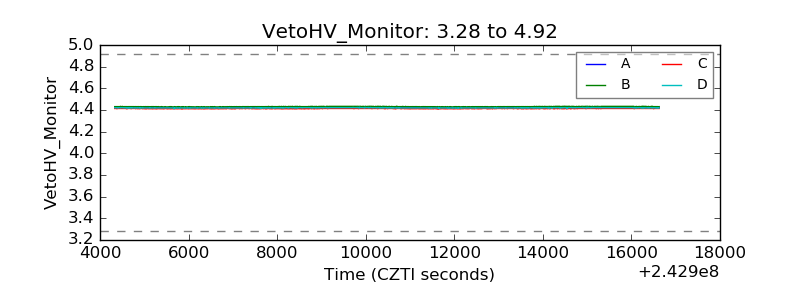 |
| Veto LLD | 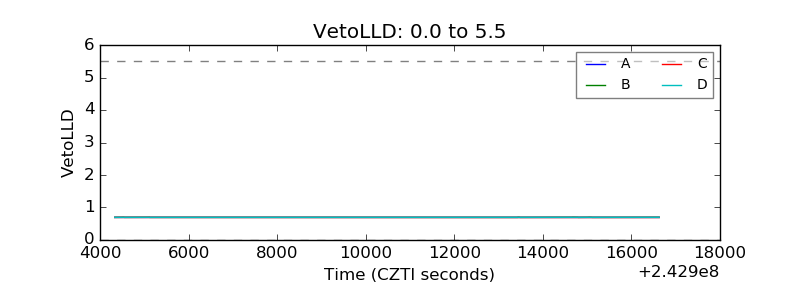 |
| Alpha Counter |  |
| _CPM_Rate | 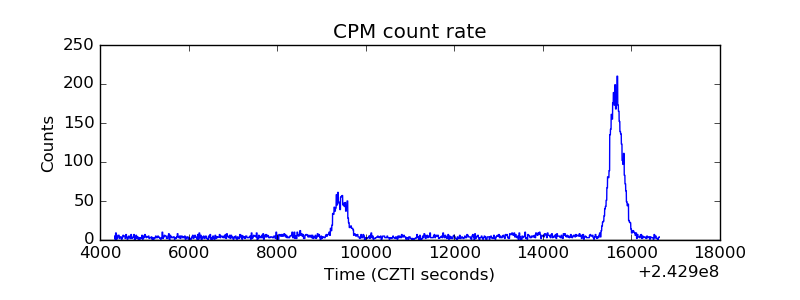 |
| CZT Counter | 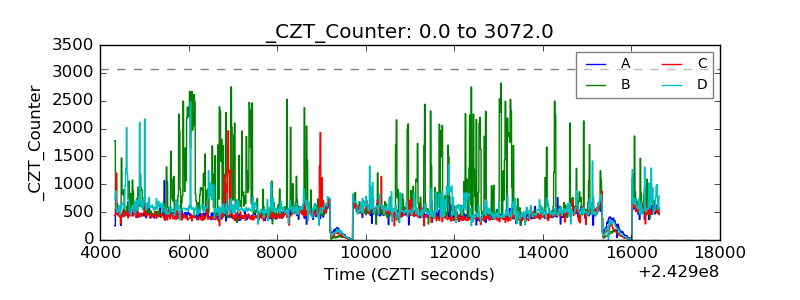 |
| +2.5 Volts monitor |  |
| +5 Volts monitor |  |
| _ROLL_ROT | 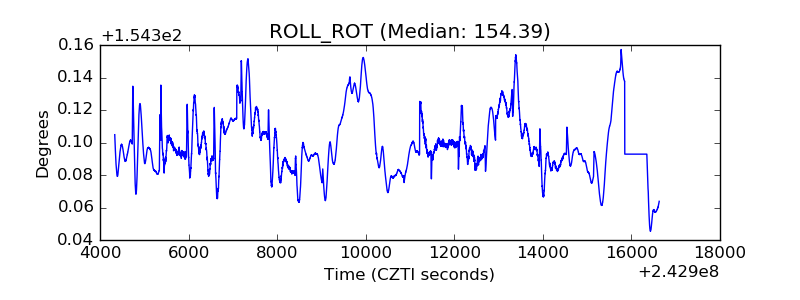 |
| _Roll_DEC | 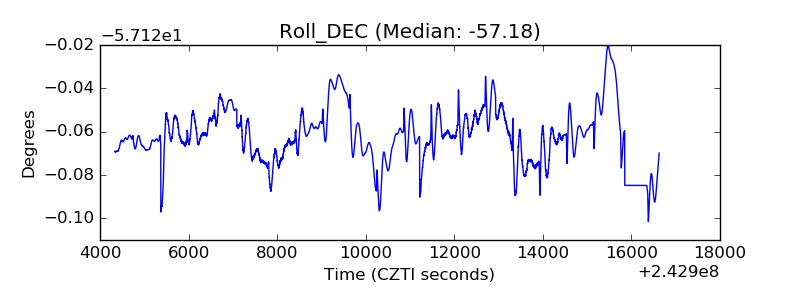 |
| _Roll_RA | 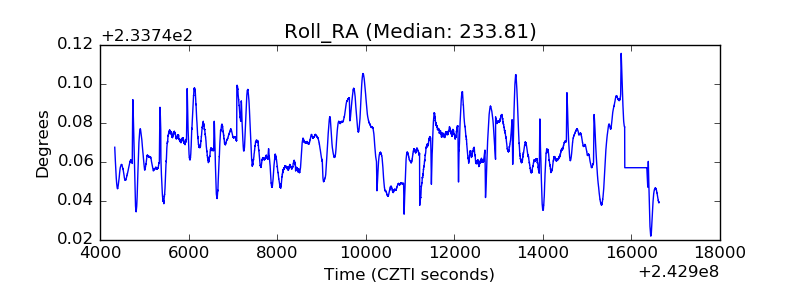 |
| Veto Counter | 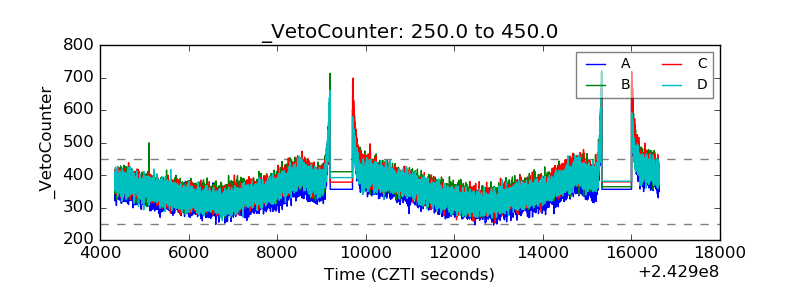 |