| Param | Original file | Final file |
|---|---|---|
| Filename | modeM0/AS1T01_191T01_9000001536_10590cztM0_level2.evt | modeM0/AS1T01_191T01_9000001536_10590cztM0_level2_quad_clean.evt |
| Size (bytes) | 482,368,320 | 89,412,480 |
| Size | 460.0 MB | 85.3 MB |
| Events in quadrant A | 2,797,443 | 589,827 |
| Events in quadrant B | 4,614,721 | 567,251 |
| Events in quadrant C | 3,291,228 | 581,706 |
| Events in quadrant D | 3,501,476 | 553,312 |
| Mode SS | |||
|---|---|---|---|
| Quadrant | BADHDUFLAG | Total packets | Discarded packets |
| A | 0 | 120 | 0 |
| B | 0 | 120 | 0 |
| C | 0 | 120 | 0 |
| D | 0 | 120 | 0 |
| Mode M9 | |||
|---|---|---|---|
| Quadrant | BADHDUFLAG | Total packets | Discarded packets |
| A | 0 | 11 | 0 |
| B | 0 | 11 | 0 |
| C | 0 | 11 | 0 |
| D | 0 | 11 | 0 |
| Mode M0 | |||
|---|---|---|---|
| Quadrant | BADHDUFLAG | Total packets | Discarded packets |
| A | 0 | 12312 | 2 |
| B | 0 | 17632 | 1 |
| C | 0 | 13876 | 1 |
| D | 0 | 14171 | 1 |
| Quadrant | Total seconds | Saturated seconds | Saturation percentage |
|---|---|---|---|
| A | 5950 | 28 | 0.470588% |
| B | 5950 | 494 | 8.302521% |
| C | 5950 | 65 | 1.092437% |
| D | 5950 | 68 | 1.142857% |
Noise dominated data is calculated using 1-second bins in cleaned event files. If a bin has >2000 counts, and if more than 50% of those come from <1% of pixels, then it is considered to be noise-dominated and hence unusable.
| Quadrant | # 1 sec bins | Bins with >0 counts | Bins with >2000 counts | High rate bins dominated by noise | Noise dominated (total time) | Noise dominated (detector-on time) | Marked lightcurve |
|---|---|---|---|---|---|---|---|
| A | 7005 | 5951 | 1 | 1 | 0.01% | 0.02% | 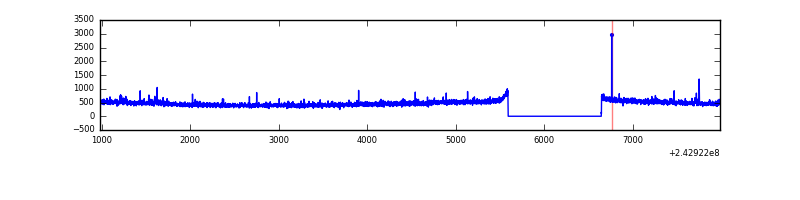 |
| B | 7005 | 5951 | 352 | 352 | 5.02% | 5.91% | 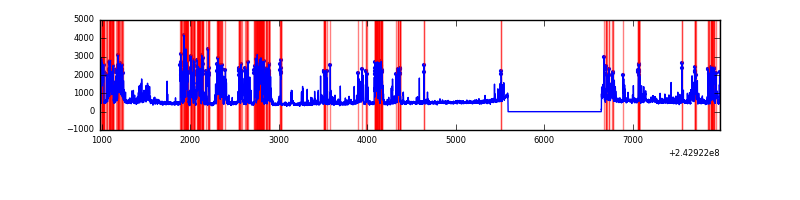 |
| C | 7005 | 5951 | 82 | 82 | 1.17% | 1.38% | 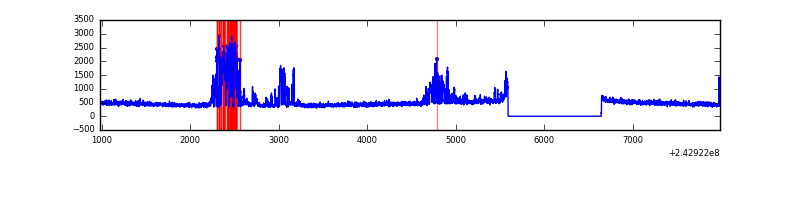 |
| D | 7005 | 5951 | 67 | 67 | 0.96% | 1.13% | 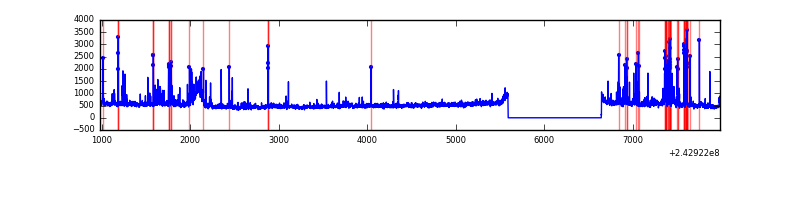 |
Top three noisy pixels from each quadrant. If the there are fewer than three noisy pixels in the level2.evt file, extra rows are filled as -1
| Pixel properties | Quadrant properties | ||||||
|---|---|---|---|---|---|---|---|
| Quadrant | DetID | PixID | Counts | Sigma | Mean | Median | Sigma |
| A | 13 | 251 | 24127 | 158.09 | 710 | 697 | 148.2 |
| A | 14 | 254 | 13913 | 89.17 | 710 | 697 | 148.2 |
| A | 1 | 162 | 13828 | 88.6 | 710 | 697 | 148.2 |
| B | 4 | 239 | 1731024 | 13056.95 | 695 | 681 | 132.5 |
| B | 11 | 51 | 63303 | 472.54 | 695 | 681 | 132.5 |
| B | 0 | 219 | 43815 | 325.48 | 695 | 681 | 132.5 |
| C | 4 | 254 | 638131 | 4021.85 | 678 | 685 | 158.5 |
| C | 4 | 175 | 5815 | 32.37 | 678 | 685 | 158.5 |
| C | 13 | 61 | 5221 | 28.62 | 678 | 685 | 158.5 |
| D | 8 | 195 | 334872 | 2048.06 | 673 | 656 | 163.2 |
| D | 12 | 233 | 183654 | 1121.4 | 673 | 656 | 163.2 |
| D | 5 | 222 | 131016 | 798.84 | 673 | 656 | 163.2 |
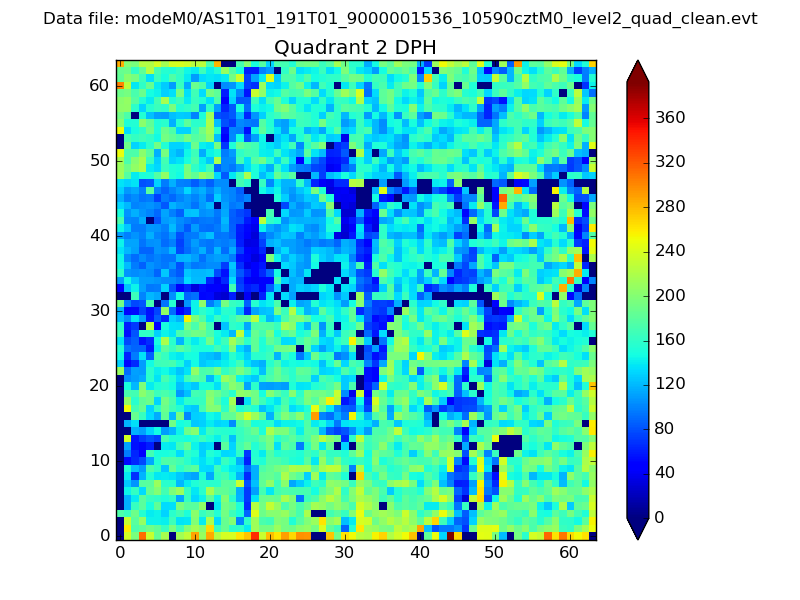
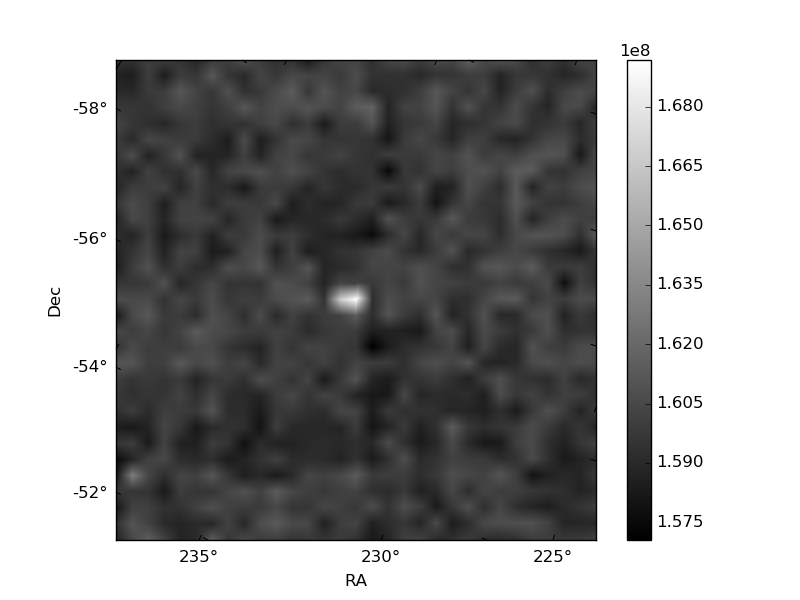
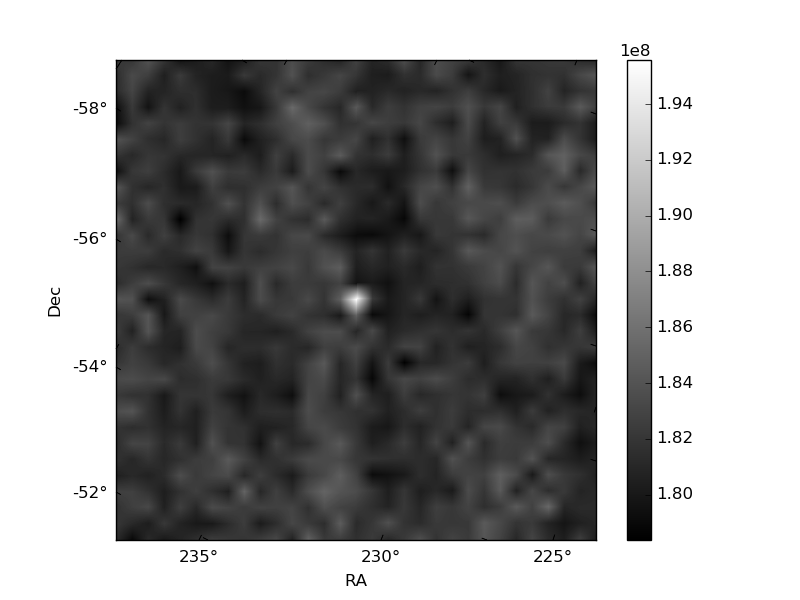
Histogram calculated using DETX and DETY for each event in the final _common_clean file
| Quadrant A | 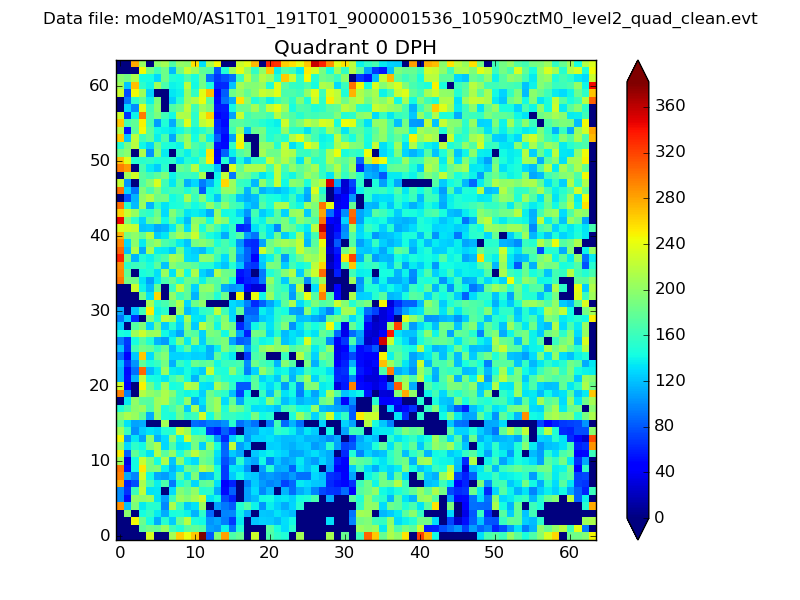 |
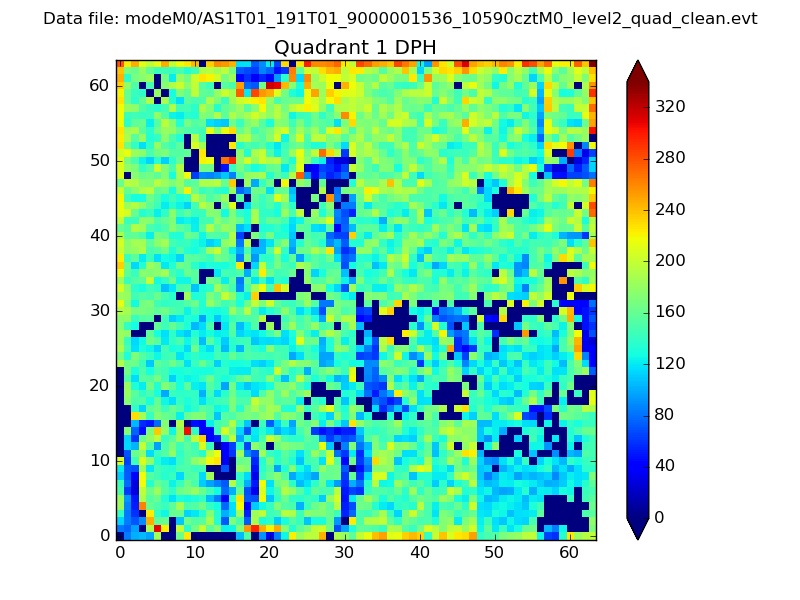 |
Quadrant B |
|---|---|---|---|
| Quadrant D | 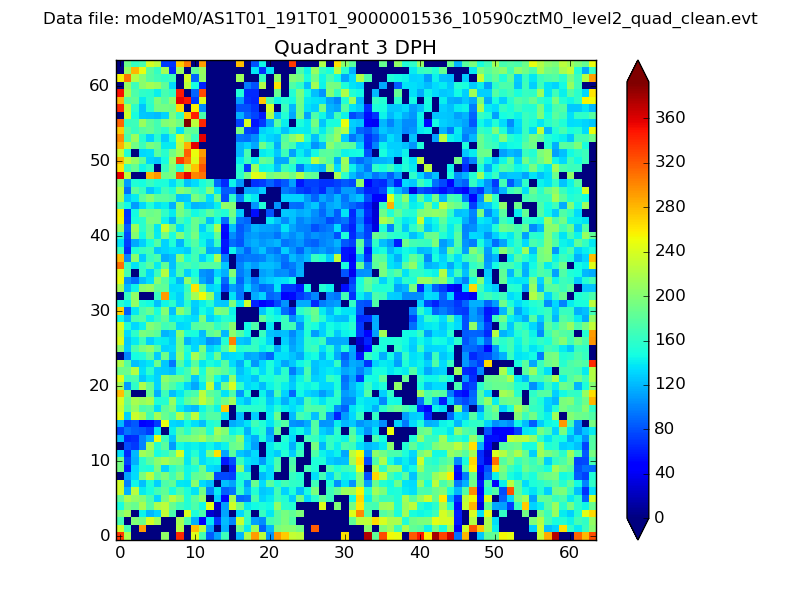 |
 |
Quadrant C |
| Plot type | Count rate plots | Images |
|---|---|---|
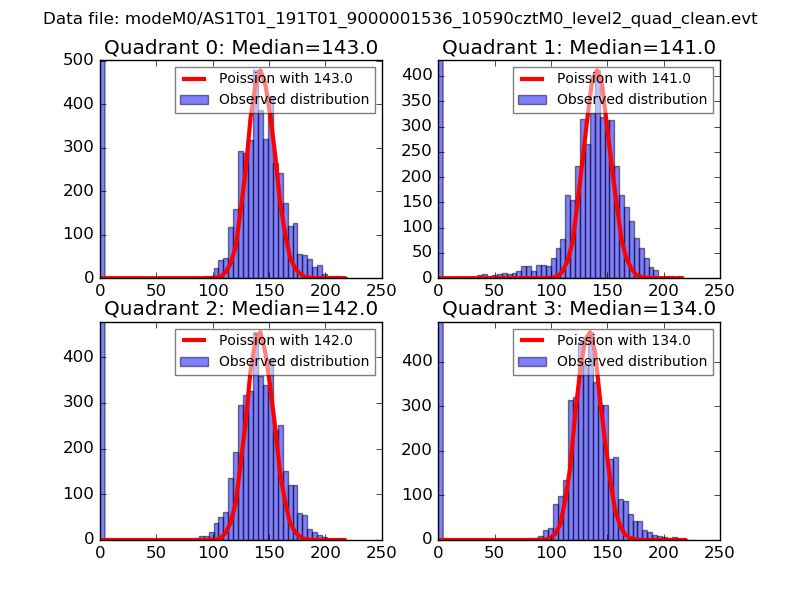
| Comparison with Poisson distribution Blue bars denote a histogram of data divided into 1 sec bins. Red curve is a Poisson curve with rate = median count rate of data. |
 |
 |
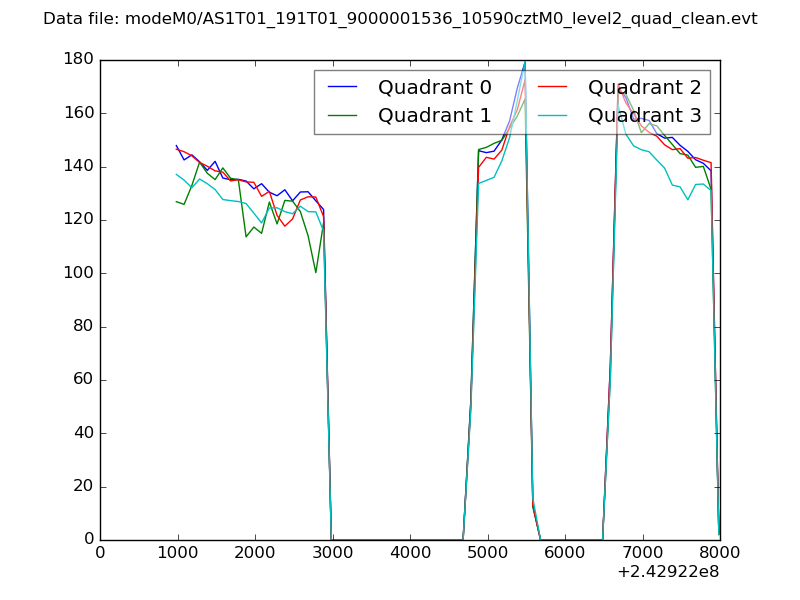
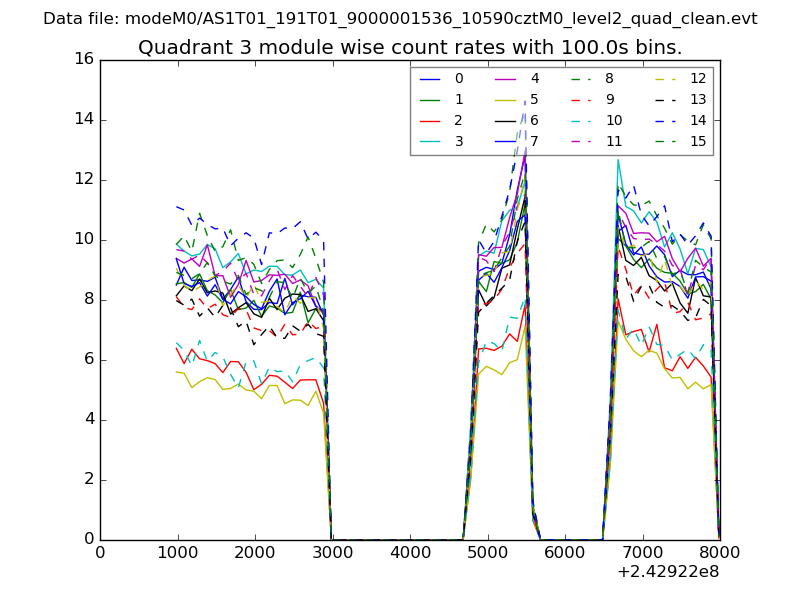
| Quadrant-wise count rates Data is divided into 100 sec bins |
 |
|
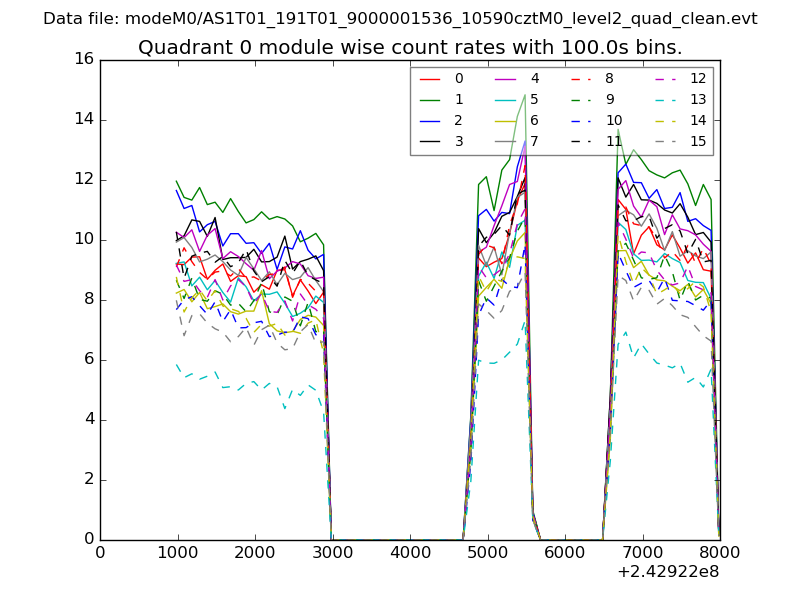
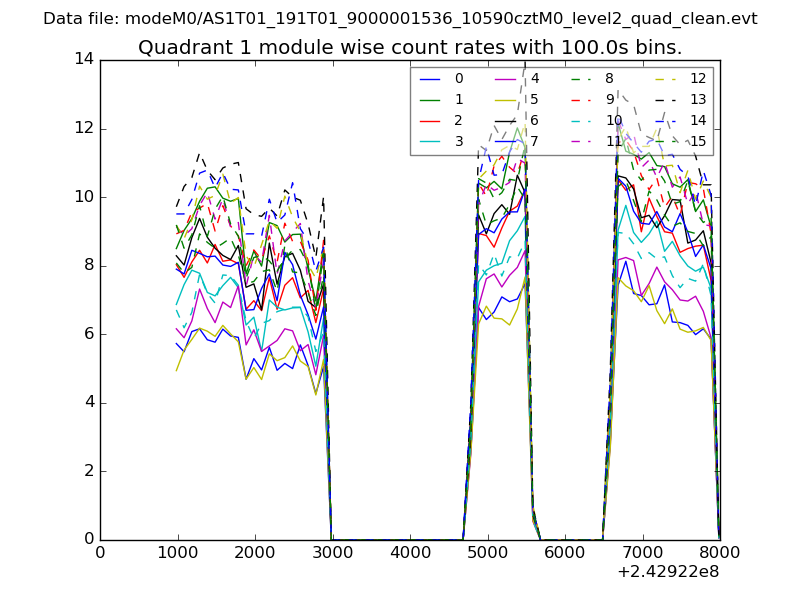
| Module-wise count rates for Quadrant A Data is divided into 100 sec bins |
 |
 |
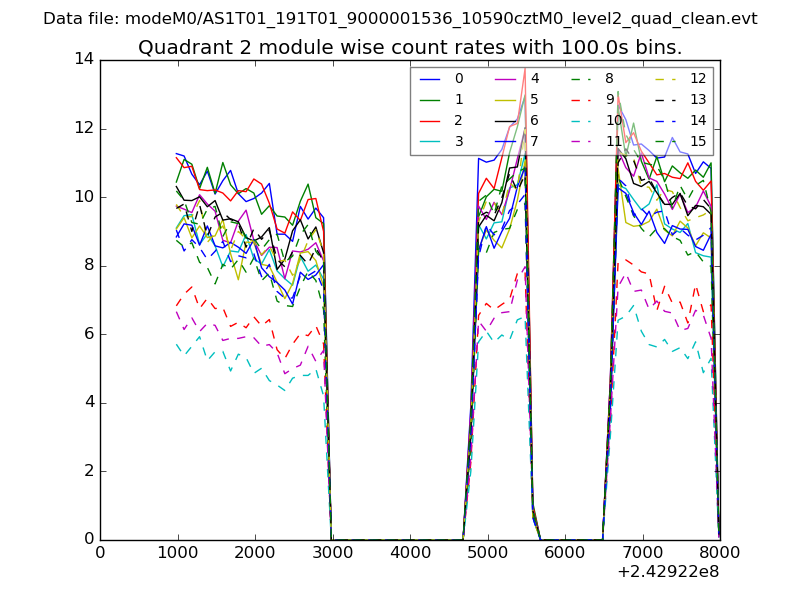
| Module-wise count rates for Quadrant B Data is divided into 100 sec bins |
 |
 |
| Module-wise count rates for Quadrant C Data is divided into 100 sec bins |
 |
 |
| Module-wise count rates for Quadrant D Data is divided into 100 sec bins |
 |
 |
| Parameter | Plot |
|---|---|
| CZT HV Monitor | 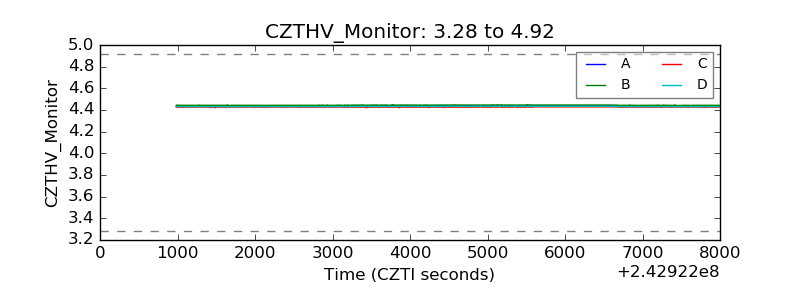 |
| D_VDD | 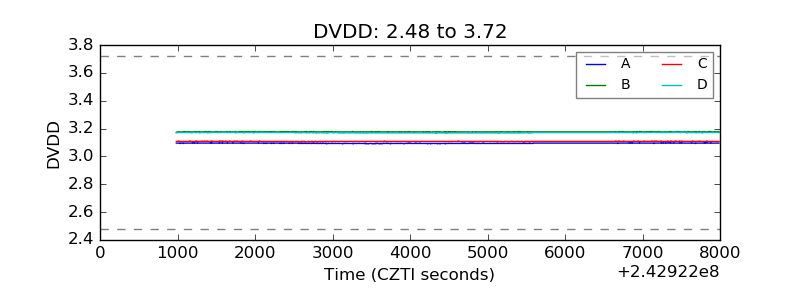 |
| Temperature 1 | 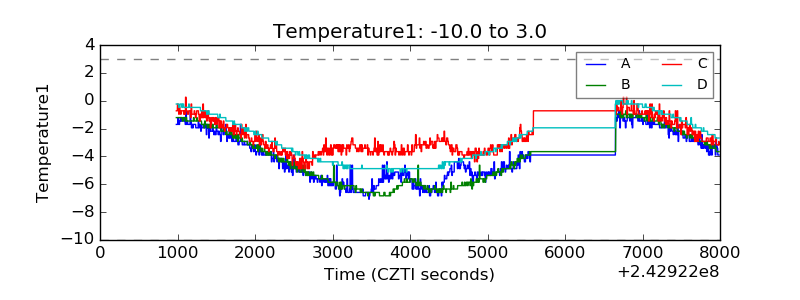 |
| Veto HV Monitor | 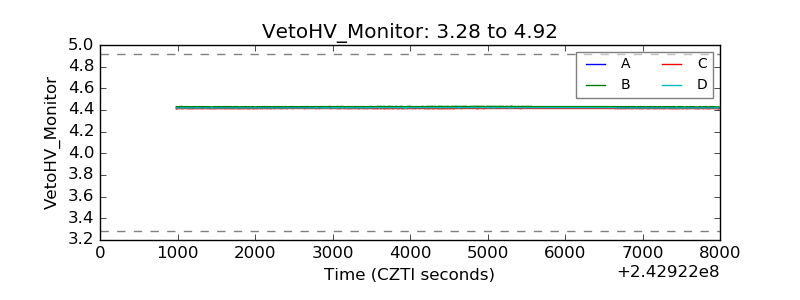 |
| Veto LLD | 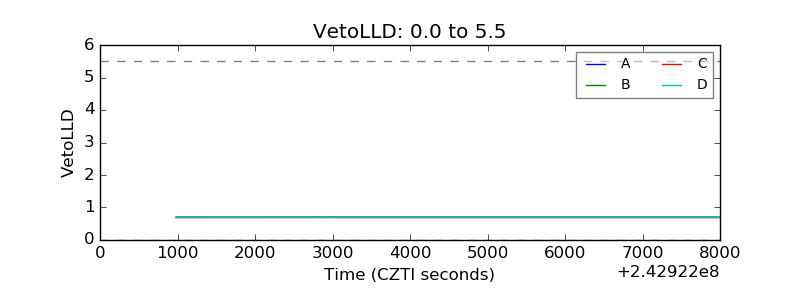 |
| Alpha Counter | 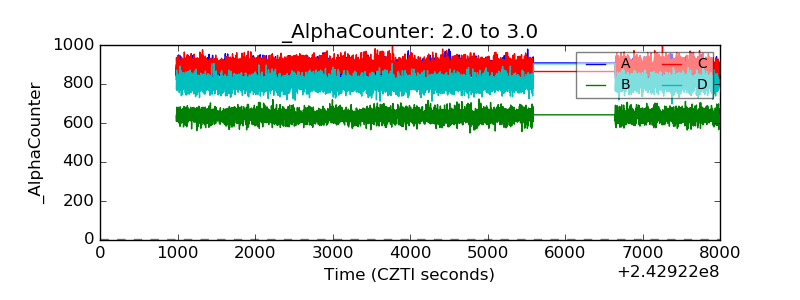 |
| _CPM_Rate | 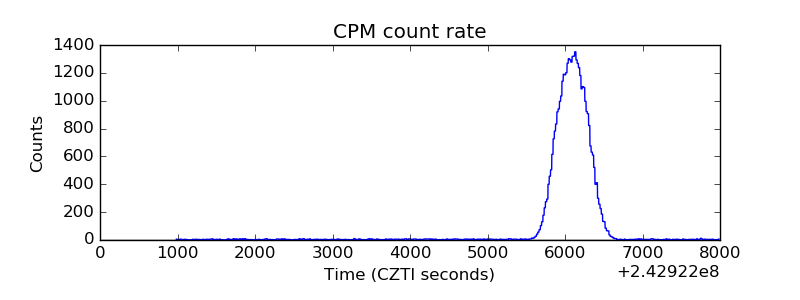 |
| CZT Counter | 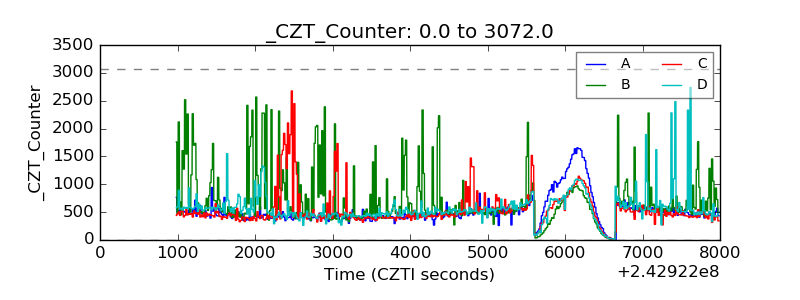 |
| +2.5 Volts monitor |  |
| +5 Volts monitor |  |
| _ROLL_ROT | 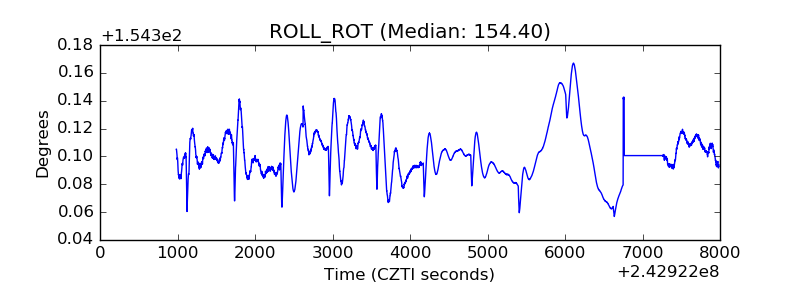 |
| _Roll_DEC | 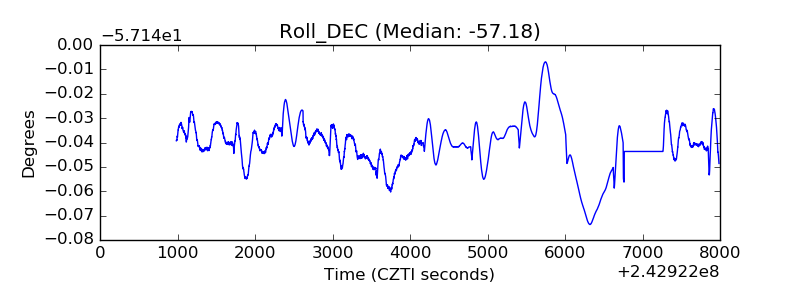 |
| _Roll_RA | 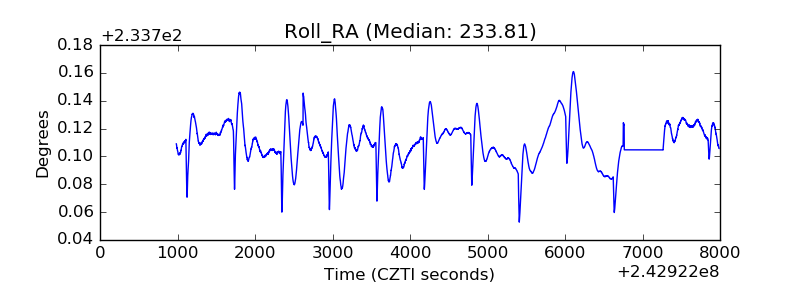 |
| Veto Counter | 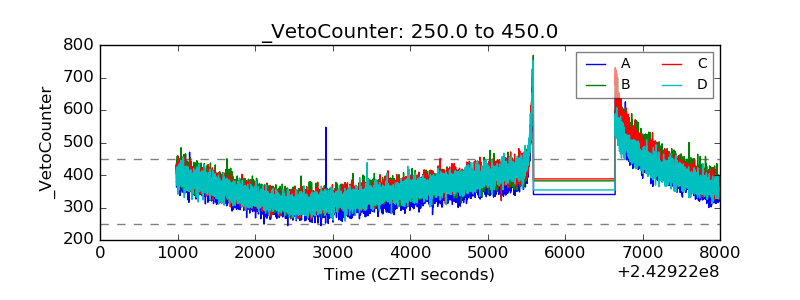 |