| Param | Original file | Final file |
|---|---|---|
| Filename | modeM0/AS1T01_191T01_9000001536_10592cztM0_level2.evt | modeM0/AS1T01_191T01_9000001536_10592cztM0_level2_quad_clean.evt |
| Size (bytes) | 462,493,440 | 87,877,440 |
| Size | 441.1 MB | 83.8 MB |
| Events in quadrant A | 2,760,985 | 582,856 |
| Events in quadrant B | 4,660,398 | 551,421 |
| Events in quadrant C | 2,944,326 | 575,415 |
| Events in quadrant D | 3,247,131 | 545,989 |
| Mode SS | |||
|---|---|---|---|
| Quadrant | BADHDUFLAG | Total packets | Discarded packets |
| A | 0 | 120 | 0 |
| B | 0 | 120 | 0 |
| C | 0 | 120 | 0 |
| D | 0 | 120 | 0 |
| Mode M9 | |||
|---|---|---|---|
| Quadrant | BADHDUFLAG | Total packets | Discarded packets |
| A | 0 | 11 | 0 |
| B | 0 | 11 | 0 |
| C | 0 | 11 | 0 |
| D | 0 | 11 | 0 |
| Mode M0 | |||
|---|---|---|---|
| Quadrant | BADHDUFLAG | Total packets | Discarded packets |
| A | 0 | 12046 | 2 |
| B | 0 | 17619 | 1 |
| C | 0 | 12789 | 1 |
| D | 0 | 13489 | 1 |
| Quadrant | Total seconds | Saturated seconds | Saturation percentage |
|---|---|---|---|
| A | 5790 | 23 | 0.397237% |
| B | 5790 | 554 | 9.568221% |
| C | 5790 | 60 | 1.036269% |
| D | 5790 | 53 | 0.915371% |
Noise dominated data is calculated using 1-second bins in cleaned event files. If a bin has >2000 counts, and if more than 50% of those come from <1% of pixels, then it is considered to be noise-dominated and hence unusable.
| Quadrant | # 1 sec bins | Bins with >0 counts | Bins with >2000 counts | High rate bins dominated by noise | Noise dominated (total time) | Noise dominated (detector-on time) | Marked lightcurve |
|---|---|---|---|---|---|---|---|
| A | 6945 | 5790 | 0 | 0 | 0.00% | 0.00% | 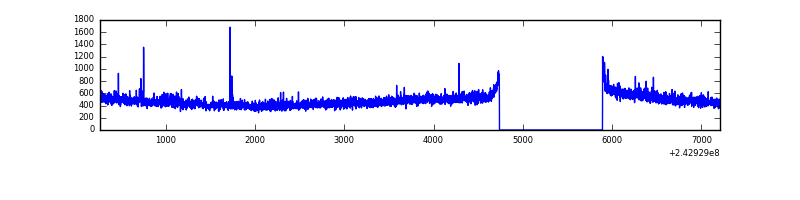 |
| B | 6945 | 5790 | 419 | 419 | 6.03% | 7.24% | 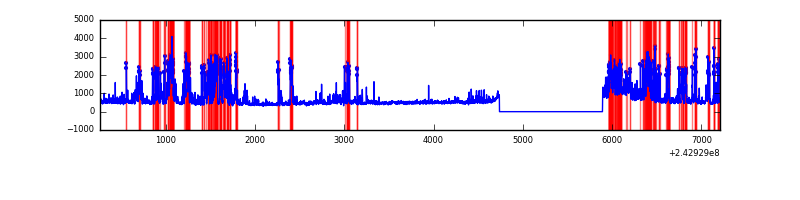 |
| C | 6945 | 5790 | 63 | 63 | 0.91% | 1.09% | 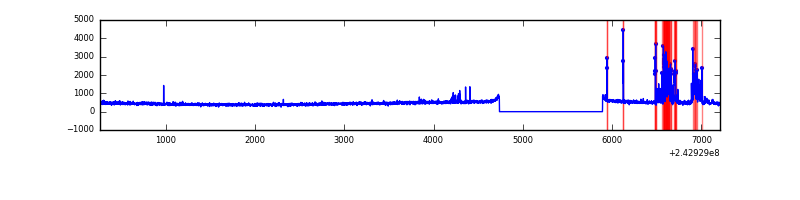 |
| D | 6945 | 5790 | 57 | 57 | 0.82% | 0.98% | 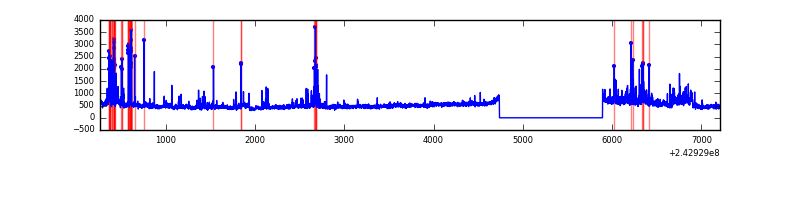 |
Top three noisy pixels from each quadrant. If the there are fewer than three noisy pixels in the level2.evt file, extra rows are filled as -1
| Pixel properties | Quadrant properties | ||||||
|---|---|---|---|---|---|---|---|
| Quadrant | DetID | PixID | Counts | Sigma | Mean | Median | Sigma |
| A | 15 | 239 | 27363 | 186.19 | 696 | 684 | 143.3 |
| A | 13 | 251 | 13361 | 88.47 | 696 | 684 | 143.3 |
| A | 1 | 162 | 12520 | 82.6 | 696 | 684 | 143.3 |
| B | 4 | 239 | 1730120 | 13445.64 | 675 | 664 | 128.6 |
| B | 11 | 51 | 129488 | 1001.54 | 675 | 664 | 128.6 |
| B | 0 | 219 | 54275 | 416.8 | 675 | 664 | 128.6 |
| C | 15 | 48 | 297587 | 1927.08 | 665 | 671 | 154.1 |
| C | 14 | 234 | 26259 | 166.07 | 665 | 671 | 154.1 |
| C | 4 | 175 | 12675 | 77.91 | 665 | 671 | 154.1 |
| D | 5 | 222 | 299668 | 1862.88 | 659 | 643 | 160.5 |
| D | 8 | 195 | 224927 | 1397.26 | 659 | 643 | 160.5 |
| D | 13 | 249 | 88879 | 549.7 | 659 | 643 | 160.5 |
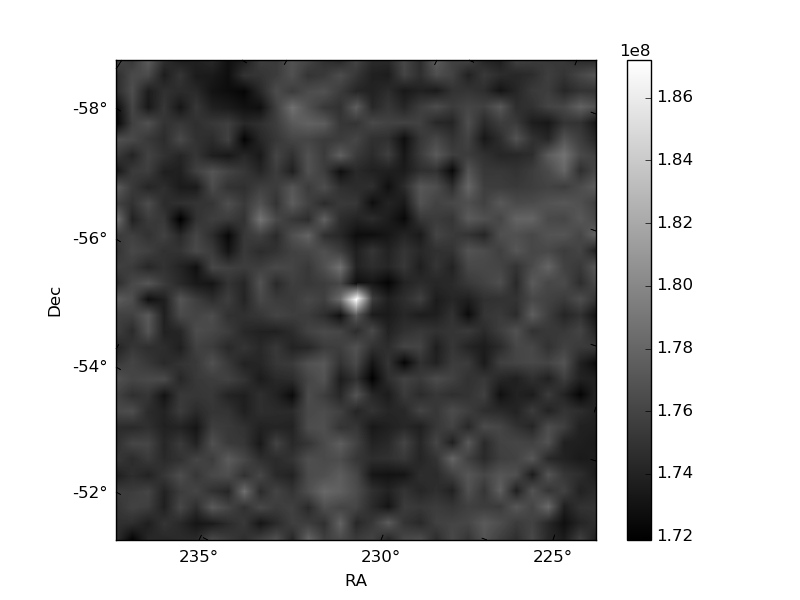
Histogram calculated using DETX and DETY for each event in the final _common_clean file
| Quadrant A | 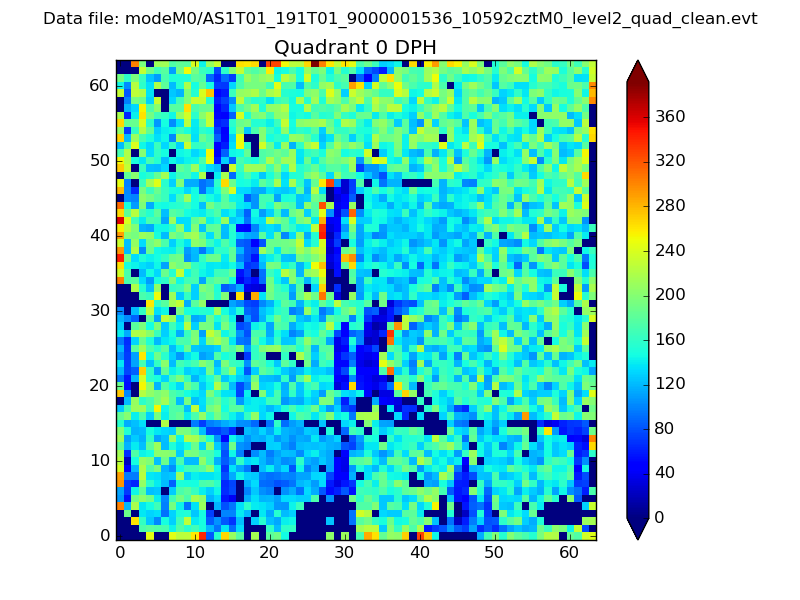 |
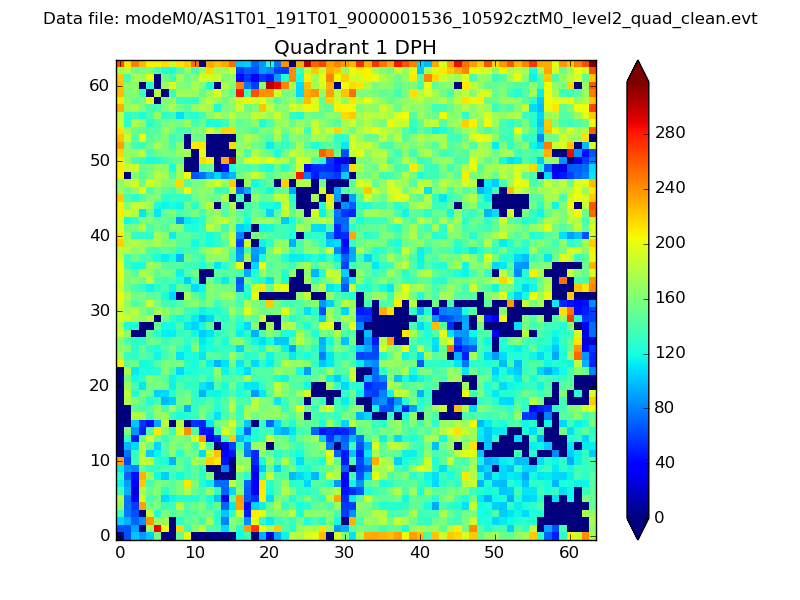 |
Quadrant B |
|---|---|---|---|
| Quadrant D |  |
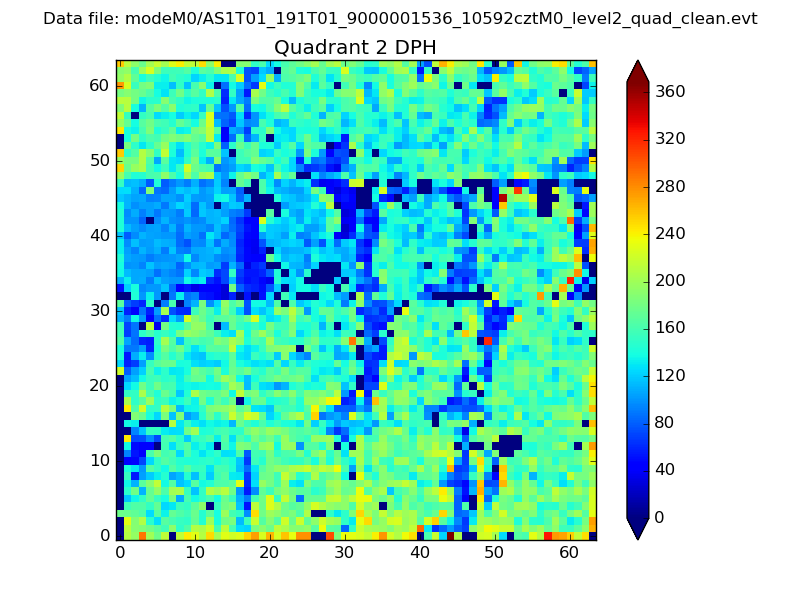 |
Quadrant C |
| Plot type | Count rate plots | Images |
|---|---|---|
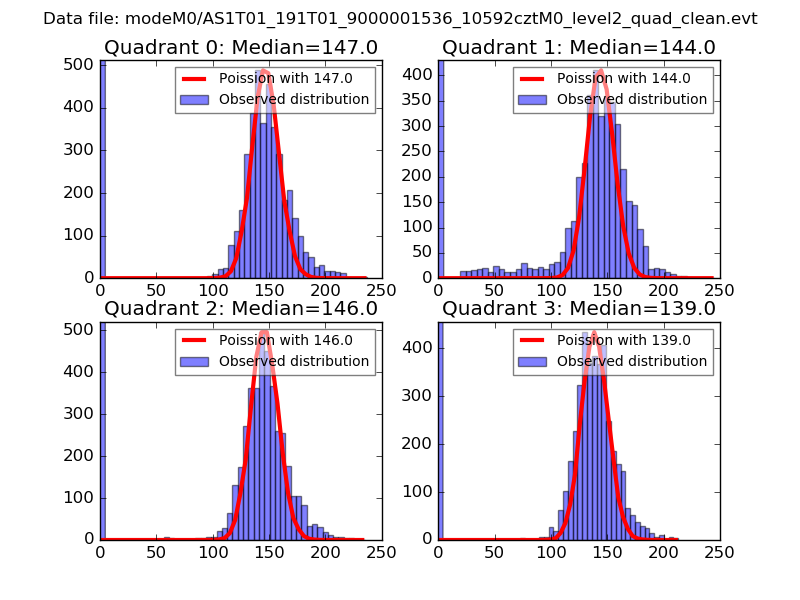
| Comparison with Poisson distribution Blue bars denote a histogram of data divided into 1 sec bins. Red curve is a Poisson curve with rate = median count rate of data. |
 |
 |
| Quadrant-wise count rates Data is divided into 100 sec bins |
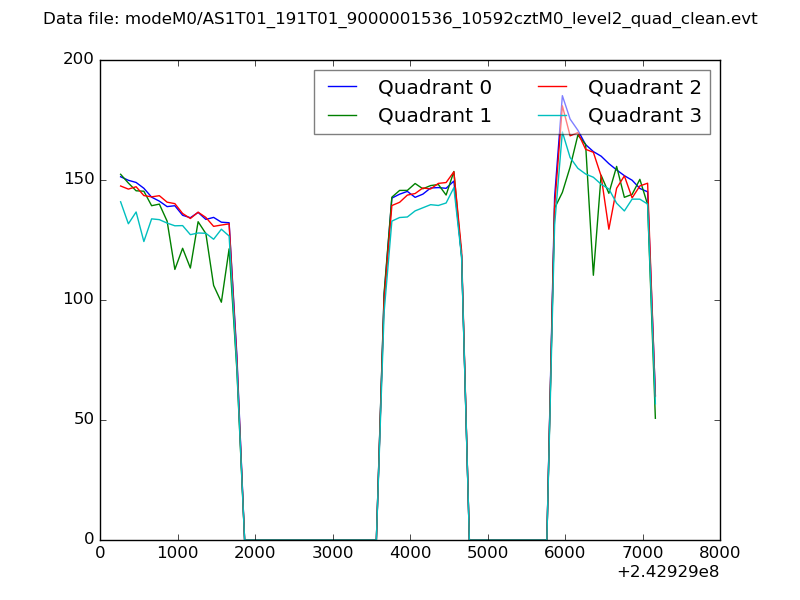 |
|
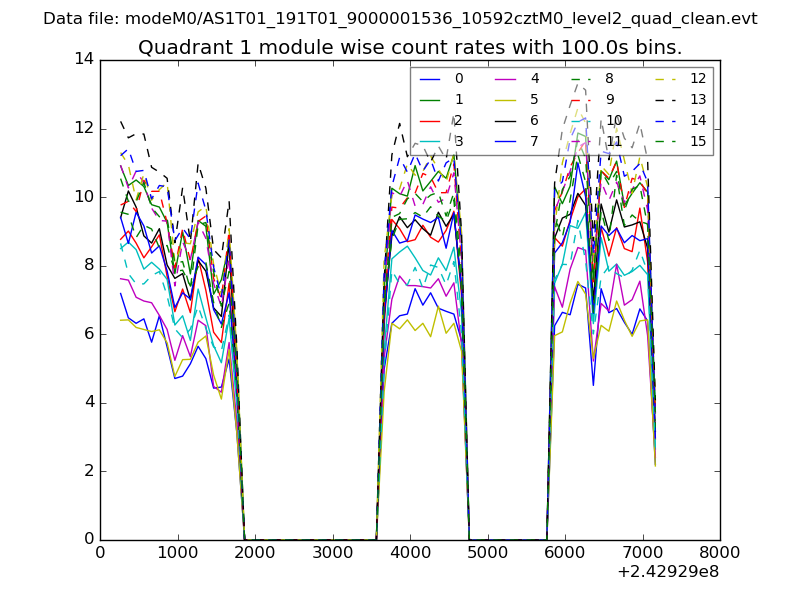
| Module-wise count rates for Quadrant A Data is divided into 100 sec bins |
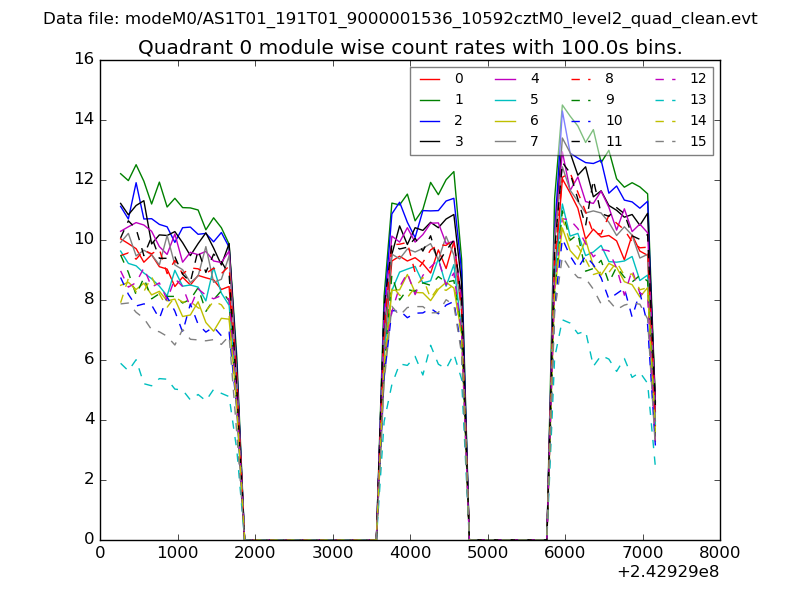 |
 |
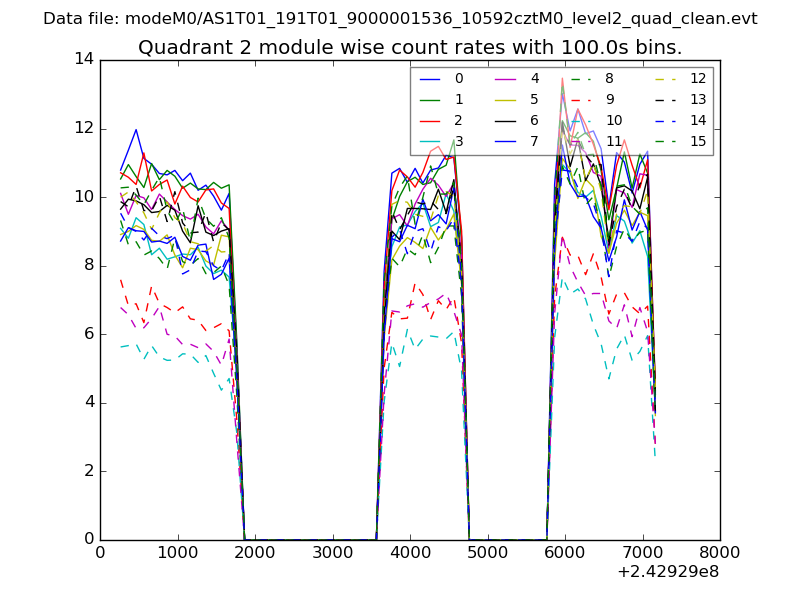
| Module-wise count rates for Quadrant B Data is divided into 100 sec bins |
 |
 |
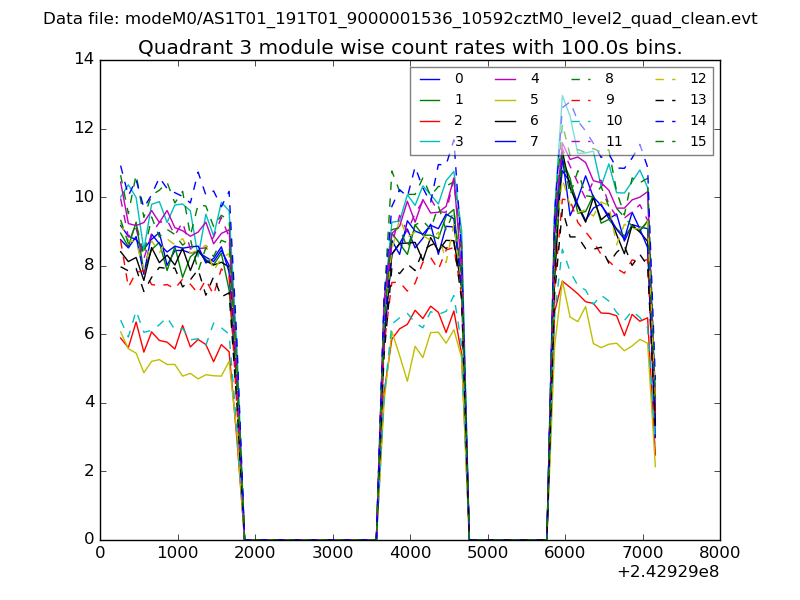
| Module-wise count rates for Quadrant C Data is divided into 100 sec bins |
 |
 |
| Module-wise count rates for Quadrant D Data is divided into 100 sec bins |
 |
 |
| Parameter | Plot |
|---|---|
| CZT HV Monitor | 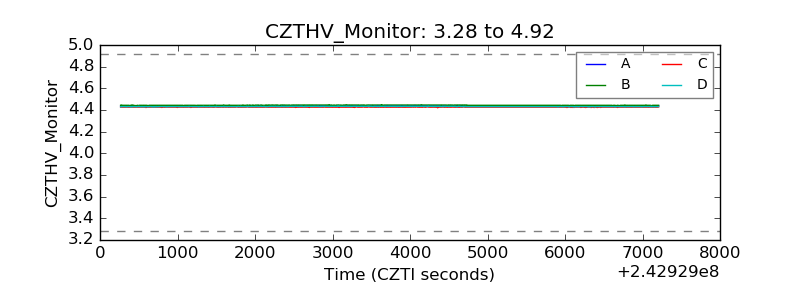 |
| D_VDD | 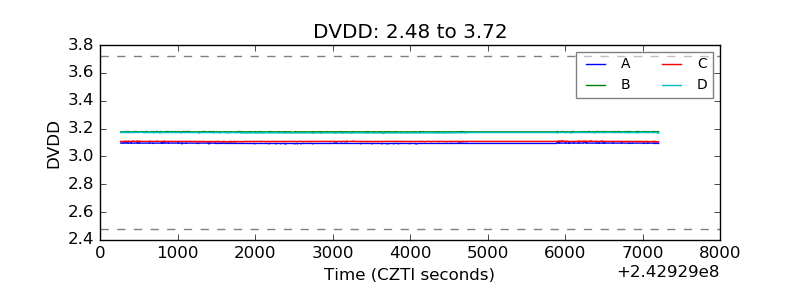 |
| Temperature 1 | 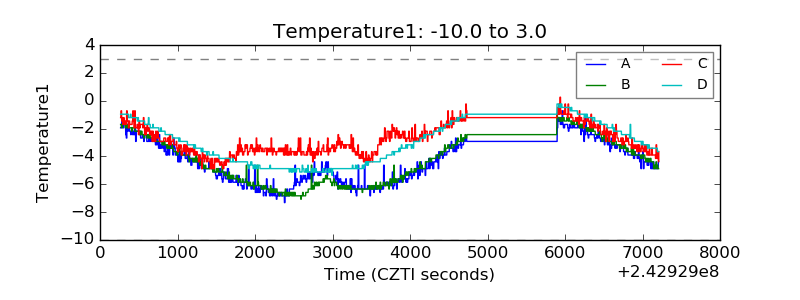 |
| Veto HV Monitor | 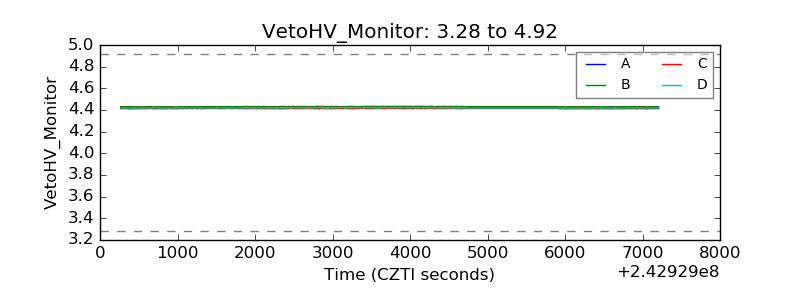 |
| Veto LLD | 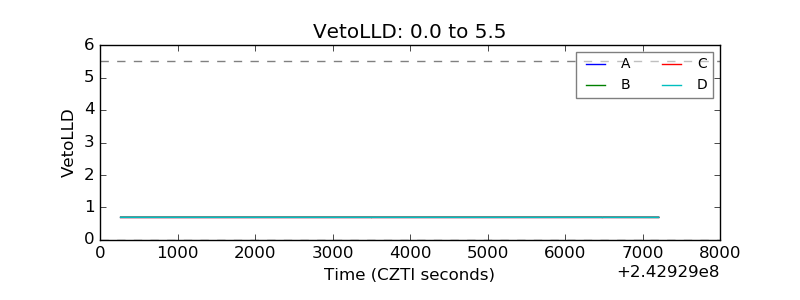 |
| Alpha Counter | 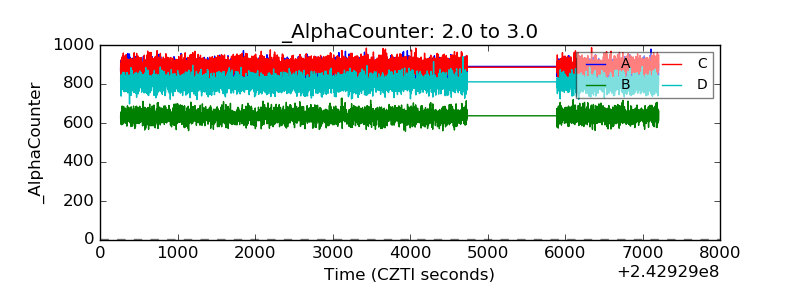 |
| _CPM_Rate | 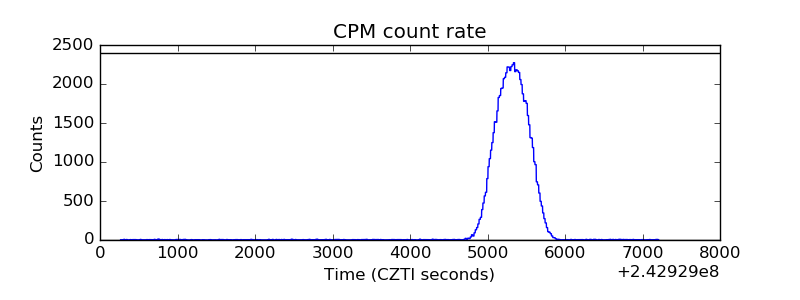 |
| CZT Counter | 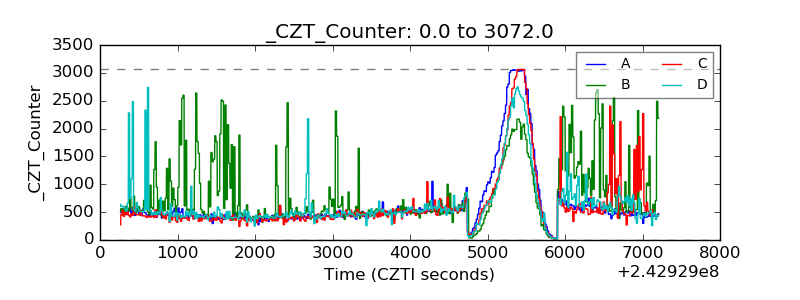 |
| +2.5 Volts monitor |  |
| +5 Volts monitor |  |
| _ROLL_ROT | 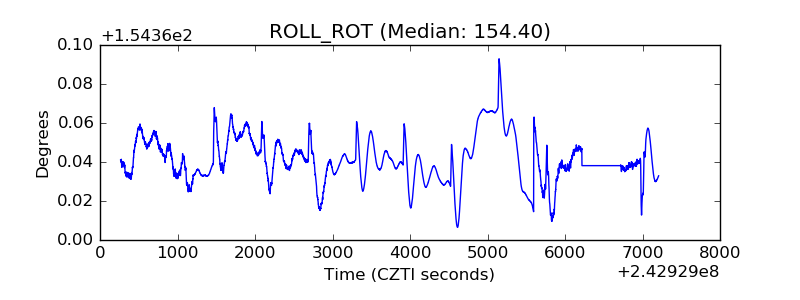 |
| _Roll_DEC | 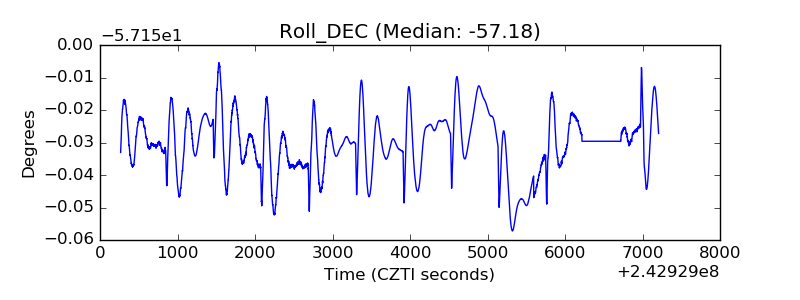 |
| _Roll_RA | 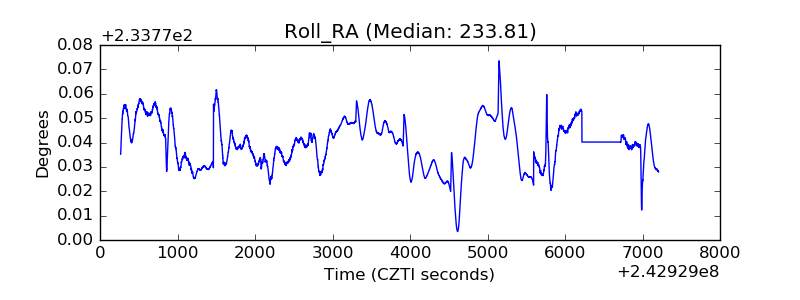 |
| Veto Counter | 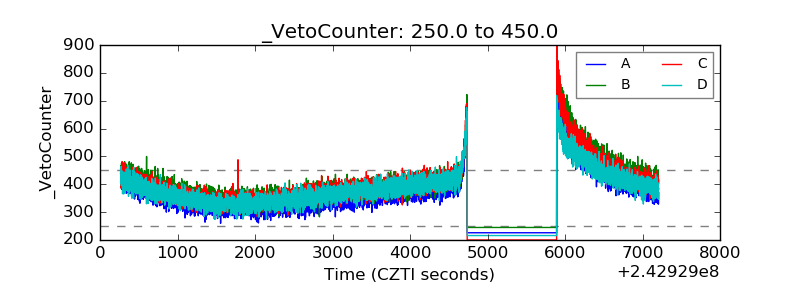 |