| Param | Original file | Final file |
|---|---|---|
| Filename | modeM0/AS1T01_191T01_9000001536_10594cztM0_level2.evt | modeM0/AS1T01_191T01_9000001536_10594cztM0_level2_quad_clean.evt |
| Size (bytes) | 420,189,120 | 81,472,320 |
| Size | 400.7 MB | 77.7 MB |
| Events in quadrant A | 2,659,625 | 533,135 |
| Events in quadrant B | 4,133,224 | 520,441 |
| Events in quadrant C | 2,610,268 | 533,219 |
| Events in quadrant D | 2,950,579 | 497,543 |
| Mode SS | |||
|---|---|---|---|
| Quadrant | BADHDUFLAG | Total packets | Discarded packets |
| A | 0 | 110 | 0 |
| B | 0 | 110 | 0 |
| C | 0 | 110 | 0 |
| D | 0 | 110 | 0 |
| Mode M9 | |||
|---|---|---|---|
| Quadrant | BADHDUFLAG | Total packets | Discarded packets |
| A | 0 | 14 | 0 |
| B | 0 | 14 | 0 |
| C | 0 | 14 | 0 |
| D | 0 | 14 | 0 |
| Mode M0 | |||
|---|---|---|---|
| Quadrant | BADHDUFLAG | Total packets | Discarded packets |
| A | 0 | 11380 | 2 |
| B | 0 | 15842 | 1 |
| C | 0 | 11289 | 1 |
| D | 0 | 12205 | 1 |
| Quadrant | Total seconds | Saturated seconds | Saturation percentage |
|---|---|---|---|
| A | 5474 | 21 | 0.383632% |
| B | 5474 | 440 | 8.037998% |
| C | 5474 | 12 | 0.219218% |
| D | 5474 | 17 | 0.310559% |
Noise dominated data is calculated using 1-second bins in cleaned event files. If a bin has >2000 counts, and if more than 50% of those come from <1% of pixels, then it is considered to be noise-dominated and hence unusable.
| Quadrant | # 1 sec bins | Bins with >0 counts | Bins with >2000 counts | High rate bins dominated by noise | Noise dominated (total time) | Noise dominated (detector-on time) | Marked lightcurve |
|---|---|---|---|---|---|---|---|
| A | 6819 | 5475 | 2 | 2 | 0.03% | 0.04% | 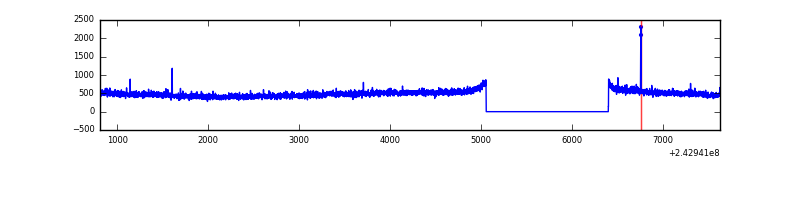 |
| B | 6819 | 5475 | 301 | 301 | 4.41% | 5.50% | 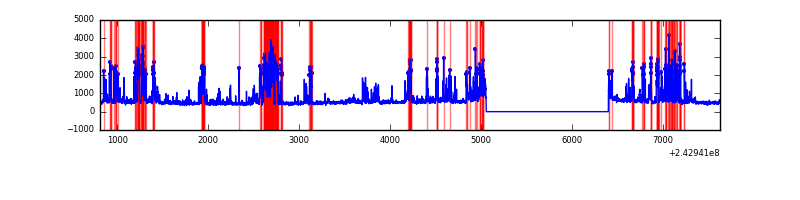 |
| C | 6819 | 5475 | 8 | 8 | 0.12% | 0.15% | 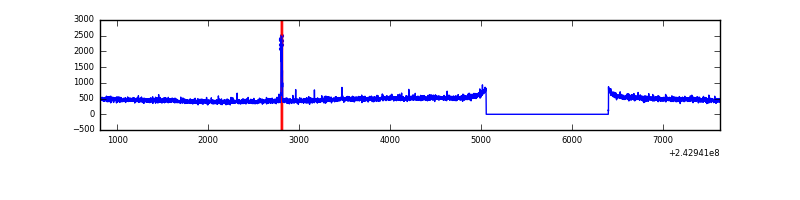 |
| D | 6819 | 5475 | 8 | 8 | 0.12% | 0.15% | 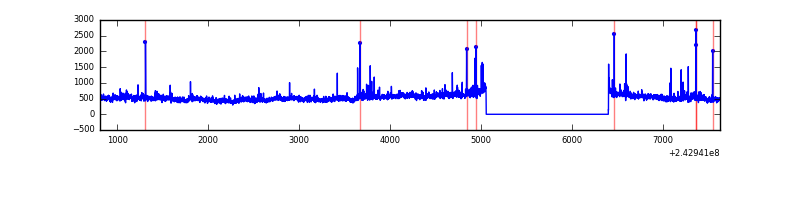 |
Top three noisy pixels from each quadrant. If the there are fewer than three noisy pixels in the level2.evt file, extra rows are filled as -1
| Pixel properties | Quadrant properties | ||||||
|---|---|---|---|---|---|---|---|
| Quadrant | DetID | PixID | Counts | Sigma | Mean | Median | Sigma |
| A | 1 | 162 | 12655 | 85.75 | 681 | 669 | 139.8 |
| A | 14 | 254 | 9636 | 64.15 | 681 | 669 | 139.8 |
| A | 13 | 253 | 6862 | 44.31 | 681 | 669 | 139.8 |
| B | 4 | 239 | 1403169 | 11092.83 | 670 | 659 | 126.4 |
| B | 11 | 51 | 44688 | 348.24 | 670 | 659 | 126.4 |
| B | 4 | 80 | 33770 | 261.88 | 670 | 659 | 126.4 |
| C | 14 | 234 | 31893 | 204.56 | 660 | 668 | 152.6 |
| C | 13 | 61 | 5036 | 28.62 | 660 | 668 | 152.6 |
| C | 4 | 175 | 3337 | 17.49 | 660 | 668 | 152.6 |
| D | 2 | 16 | 221351 | 1406.55 | 647 | 631 | 156.9 |
| D | 8 | 195 | 156917 | 995.94 | 647 | 631 | 156.9 |
| D | 1 | 52 | 37930 | 237.69 | 647 | 631 | 156.9 |
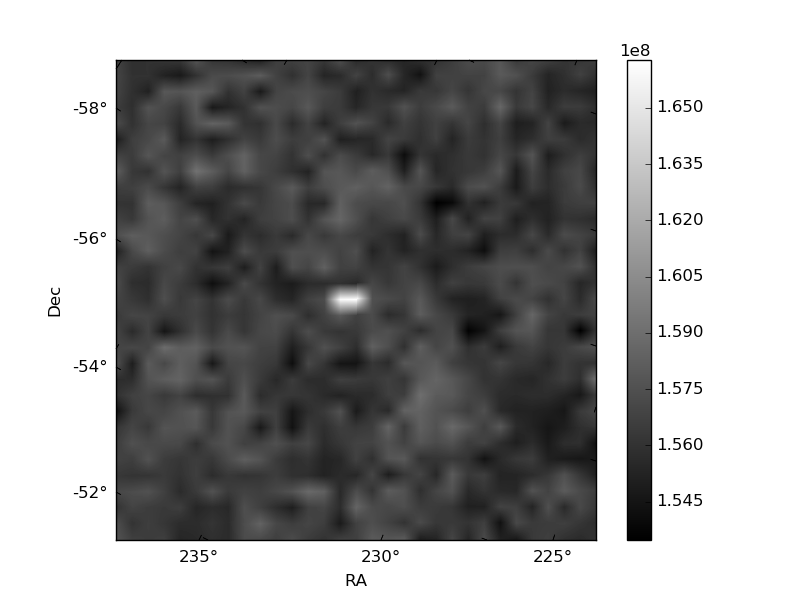
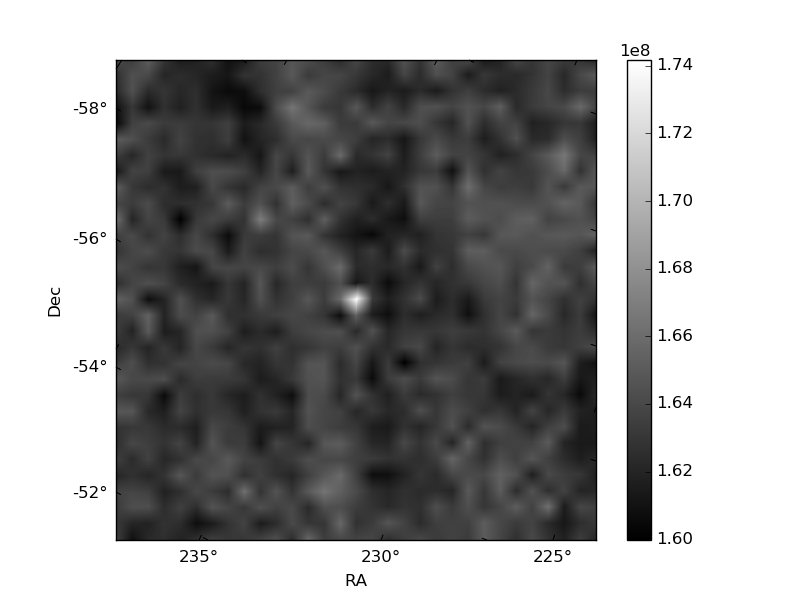
Histogram calculated using DETX and DETY for each event in the final _common_clean file
| Quadrant A | 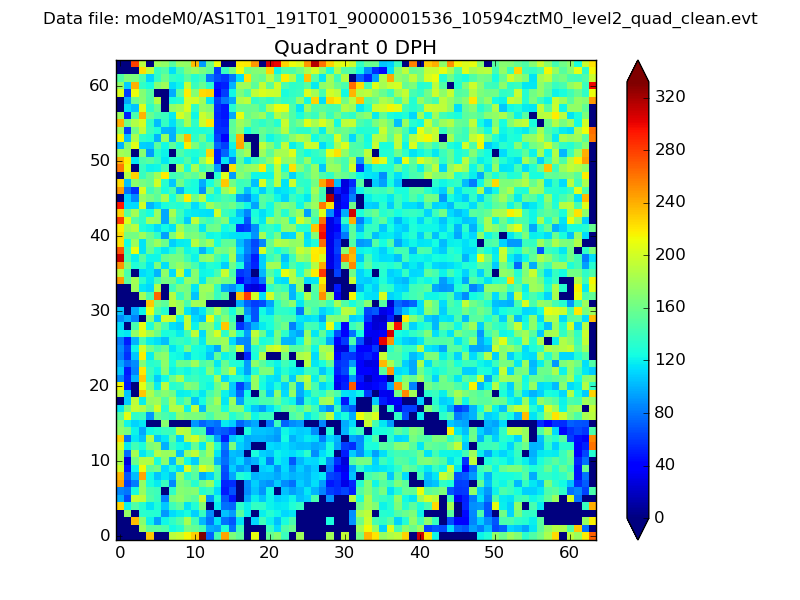 |
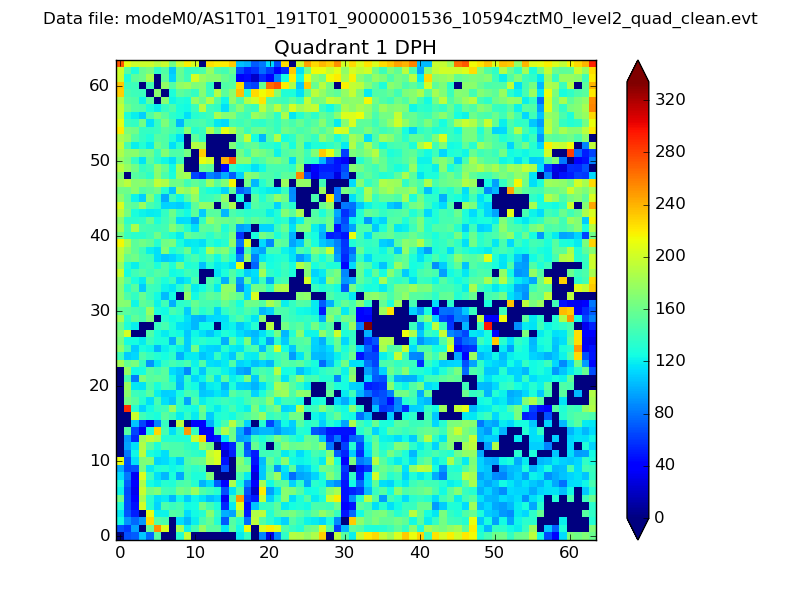 |
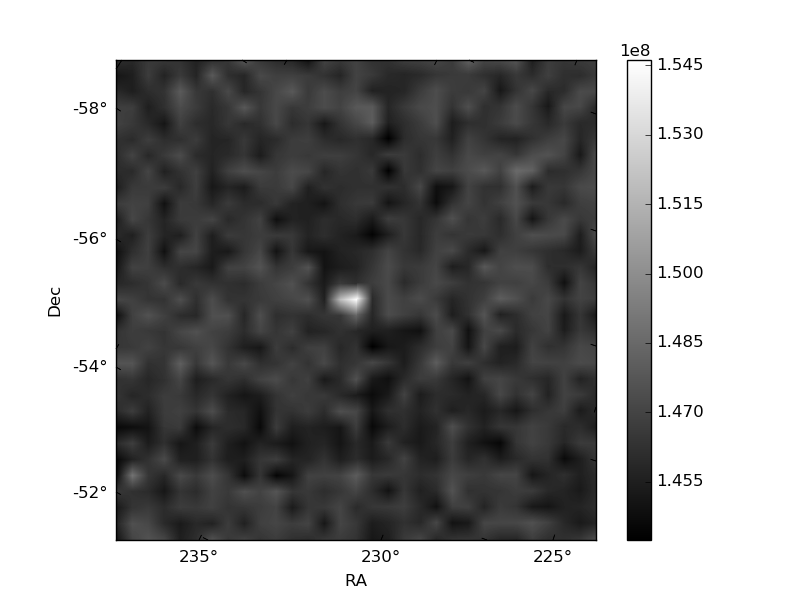
Quadrant B |
|---|---|---|---|
| Quadrant D | 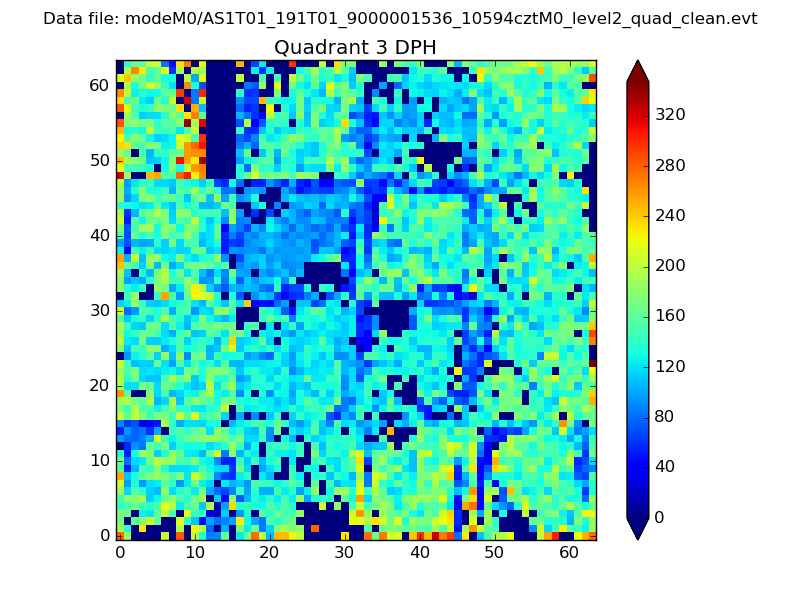 |
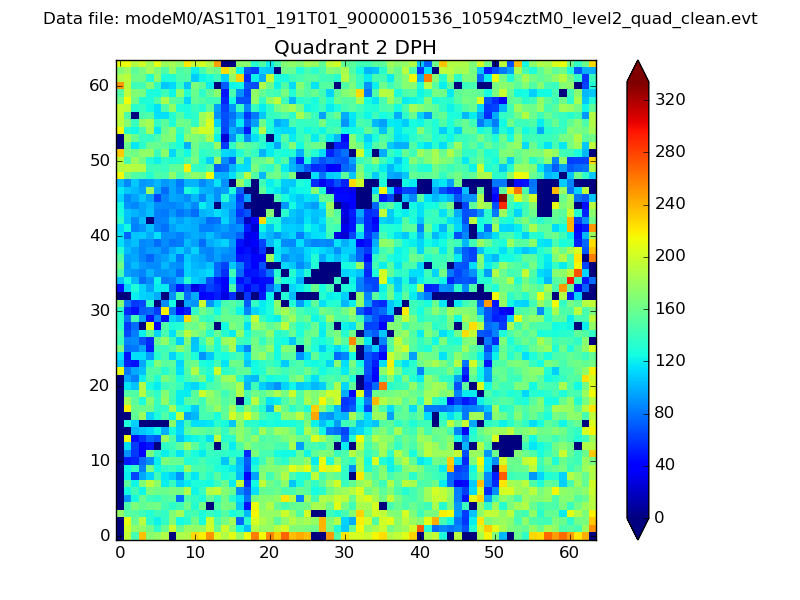 |
Quadrant C |
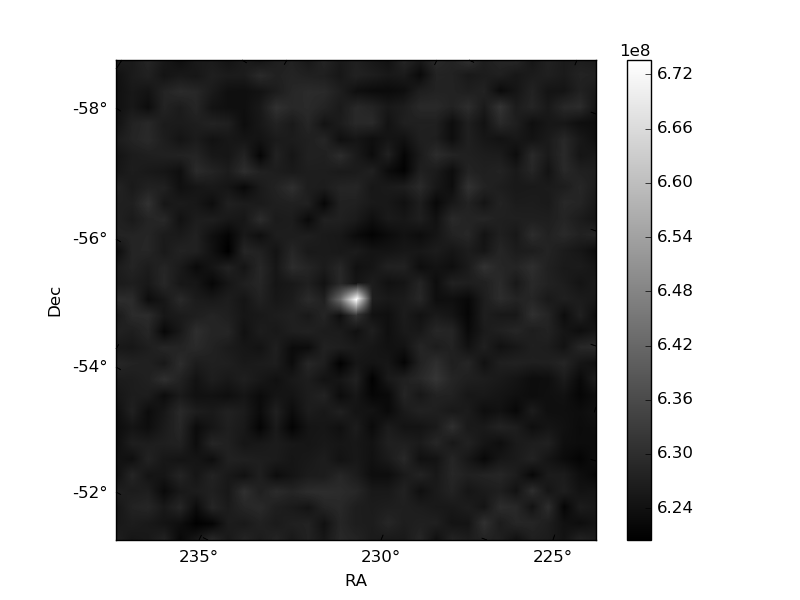
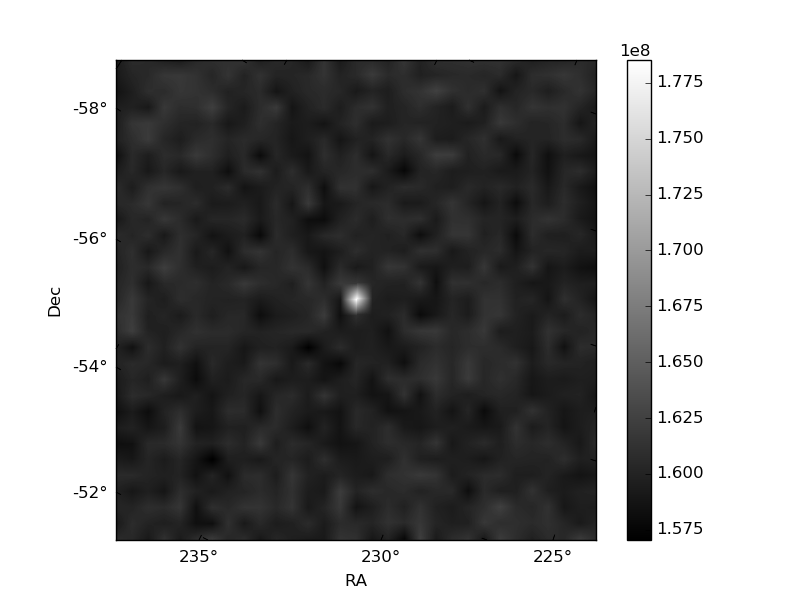
| Plot type | Count rate plots | Images |
|---|---|---|
| Comparison with Poisson distribution Blue bars denote a histogram of data divided into 1 sec bins. Red curve is a Poisson curve with rate = median count rate of data. |
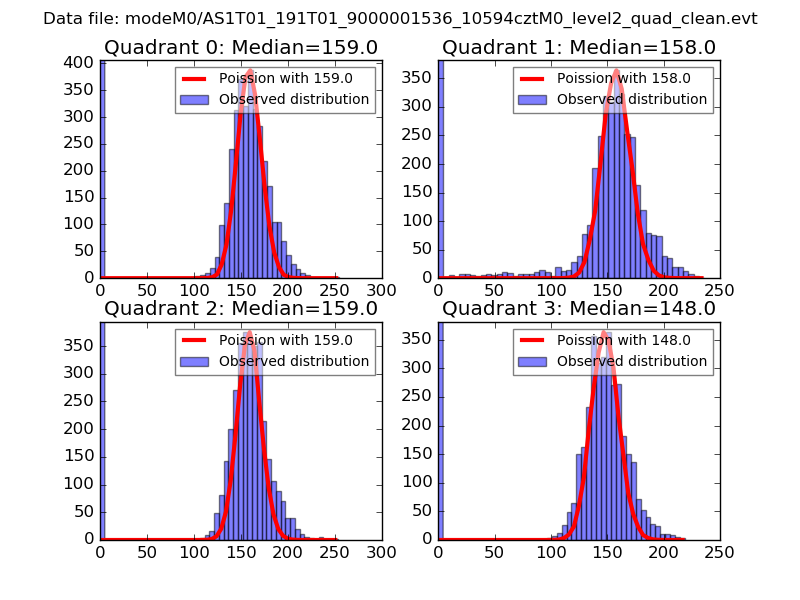 |
 |
| Quadrant-wise count rates Data is divided into 100 sec bins |
 |
|
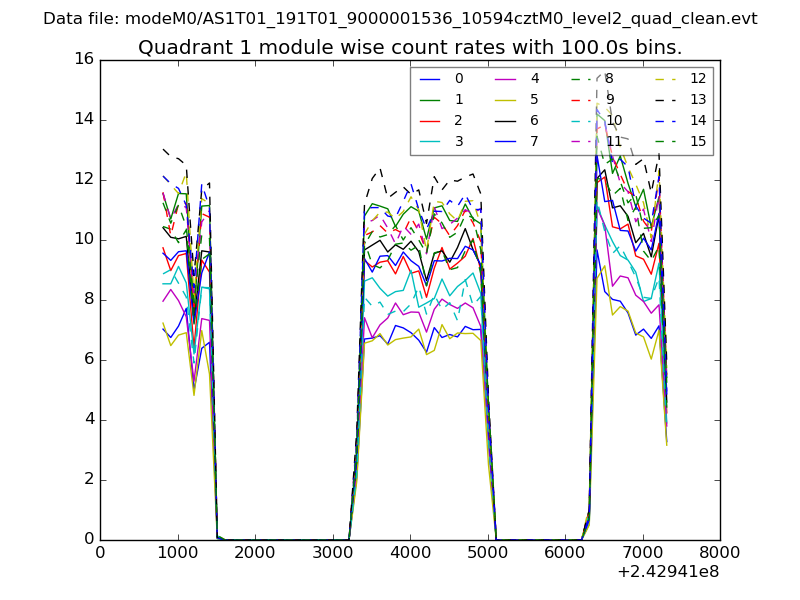
| Module-wise count rates for Quadrant A Data is divided into 100 sec bins |
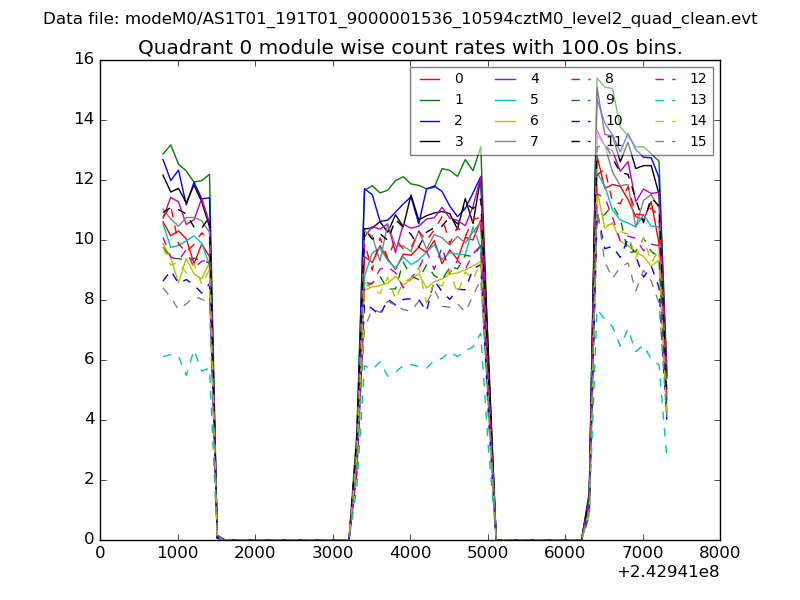 |
 |
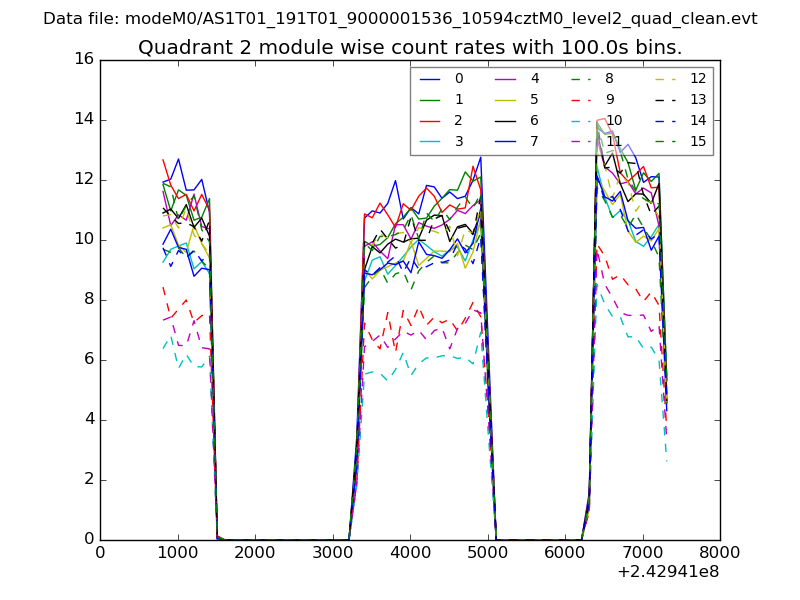
| Module-wise count rates for Quadrant B Data is divided into 100 sec bins |
 |
 |
| Module-wise count rates for Quadrant C Data is divided into 100 sec bins |
 |
 |
| Module-wise count rates for Quadrant D Data is divided into 100 sec bins |
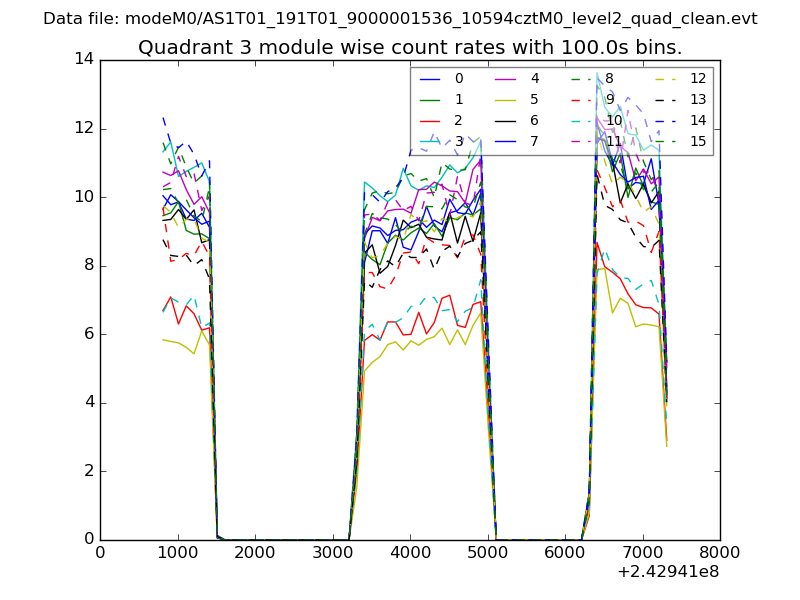 |
 |
| Parameter | Plot |
|---|---|
| CZT HV Monitor | 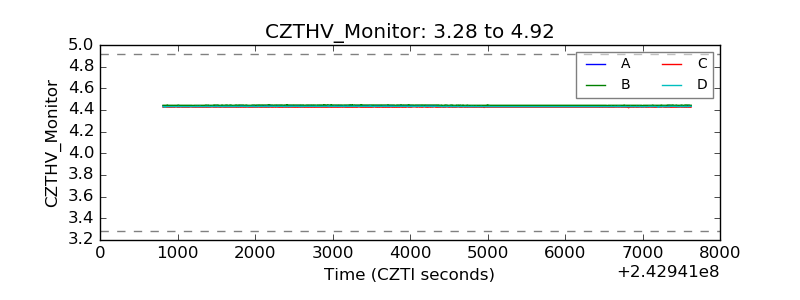 |
| D_VDD | 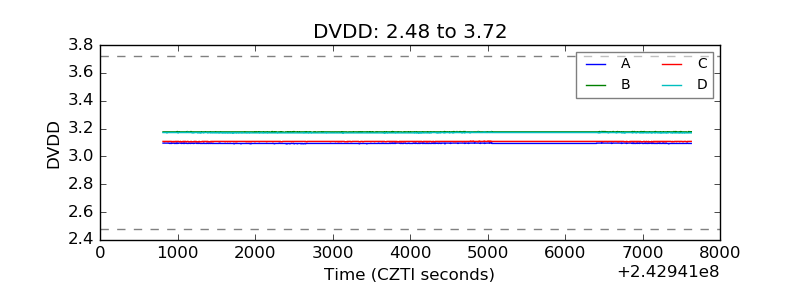 |
| Temperature 1 | 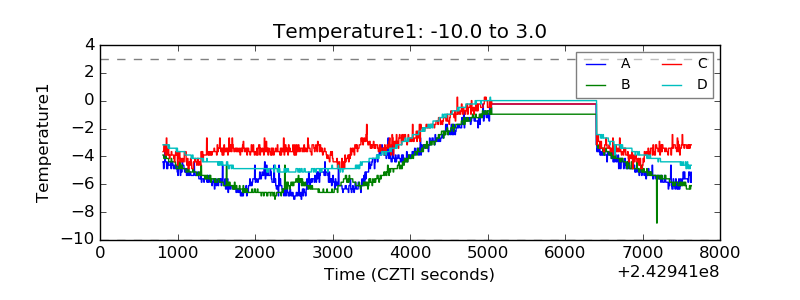 |
| Veto HV Monitor | 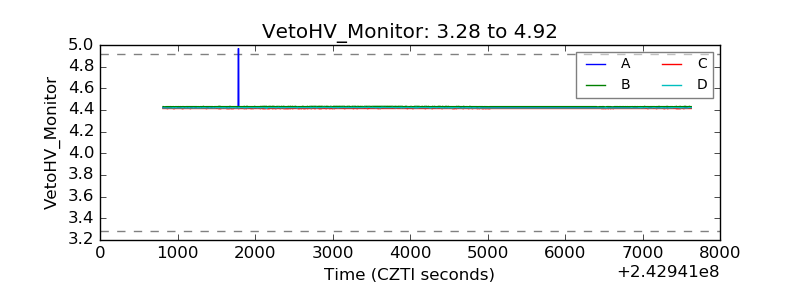 |
| Veto LLD | 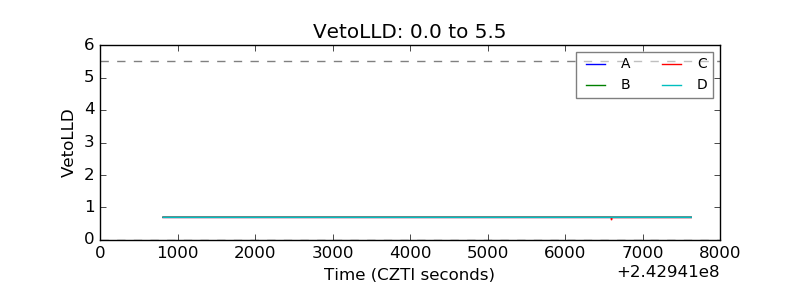 |
| Alpha Counter | 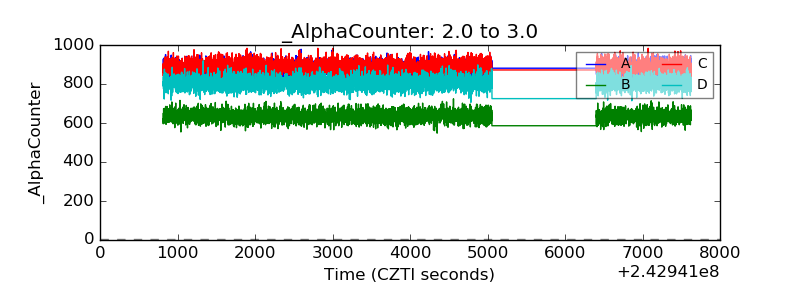 |
| _CPM_Rate |  |
| CZT Counter | 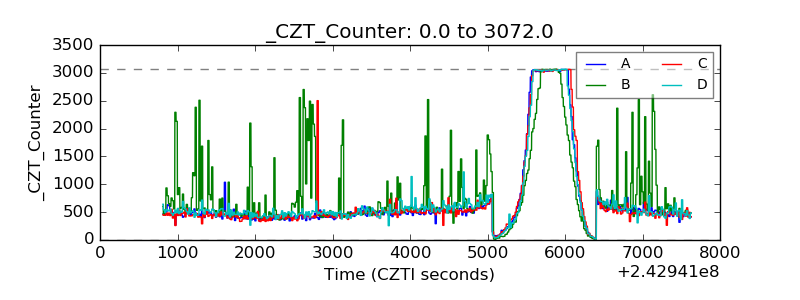 |
| +2.5 Volts monitor |  |
| +5 Volts monitor |  |
| _ROLL_ROT | 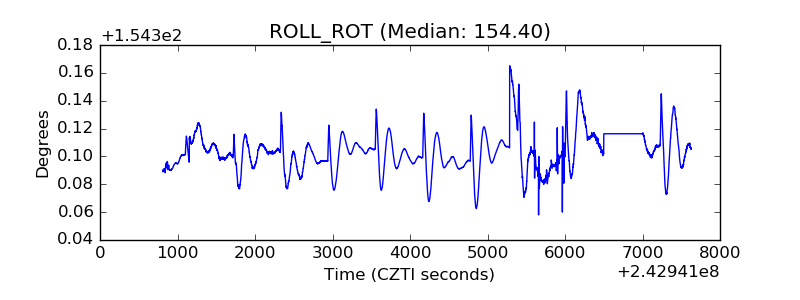 |
| _Roll_DEC | 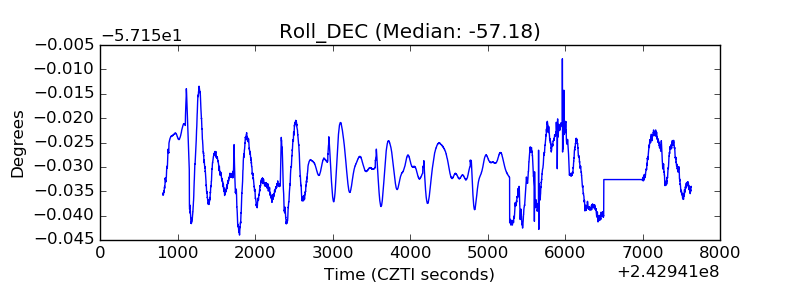 |
| _Roll_RA | 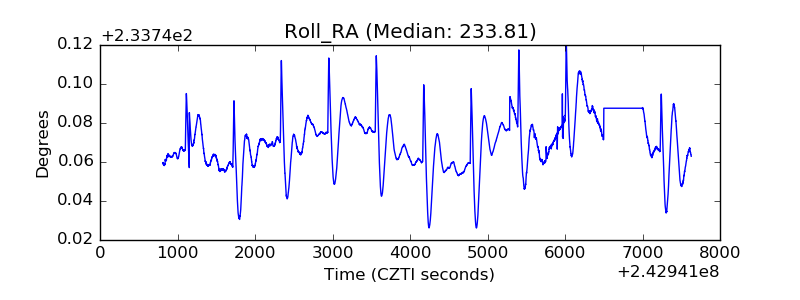 |
| Veto Counter | 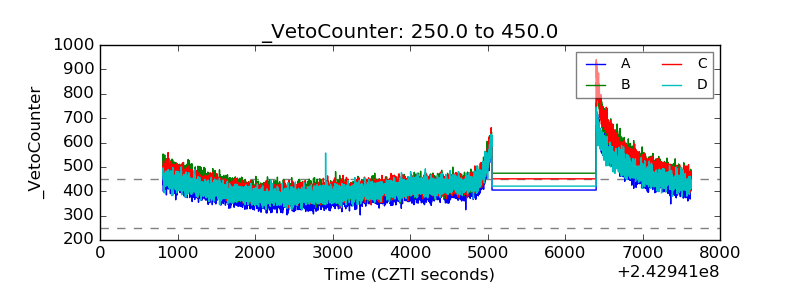 |