| Param | Original file | Final file |
|---|---|---|
| Filename | modeM0/AS1T01_191T01_9000001536_10595cztM0_level2.evt | modeM0/AS1T01_191T01_9000001536_10595cztM0_level2_quad_clean.evt |
| Size (bytes) | 415,609,920 | 74,609,280 |
| Size | 396.4 MB | 71.2 MB |
| Events in quadrant A | 2,712,611 | 475,141 |
| Events in quadrant B | 3,796,401 | 467,696 |
| Events in quadrant C | 2,667,856 | 479,846 |
| Events in quadrant D | 3,031,022 | 446,579 |
| Mode SS | |||
|---|---|---|---|
| Quadrant | BADHDUFLAG | Total packets | Discarded packets |
| A | 0 | 112 | 0 |
| B | 0 | 112 | 0 |
| C | 0 | 112 | 0 |
| D | 0 | 112 | 0 |
| Mode M9 | |||
|---|---|---|---|
| Quadrant | BADHDUFLAG | Total packets | Discarded packets |
| A | 0 | 14 | 0 |
| B | 0 | 14 | 0 |
| C | 0 | 14 | 0 |
| D | 0 | 14 | 0 |
| Mode M0 | |||
|---|---|---|---|
| Quadrant | BADHDUFLAG | Total packets | Discarded packets |
| A | 0 | 11552 | 2 |
| B | 0 | 14845 | 1 |
| C | 0 | 11435 | 1 |
| D | 0 | 12446 | 1 |
| Quadrant | Total seconds | Saturated seconds | Saturation percentage |
|---|---|---|---|
| A | 5576 | 31 | 0.555954% |
| B | 5576 | 303 | 5.434003% |
| C | 5576 | 14 | 0.251076% |
| D | 5576 | 30 | 0.538020% |
Noise dominated data is calculated using 1-second bins in cleaned event files. If a bin has >2000 counts, and if more than 50% of those come from <1% of pixels, then it is considered to be noise-dominated and hence unusable.
| Quadrant | # 1 sec bins | Bins with >0 counts | Bins with >2000 counts | High rate bins dominated by noise | Noise dominated (total time) | Noise dominated (detector-on time) | Marked lightcurve |
|---|---|---|---|---|---|---|---|
| A | 6906 | 5577 | 1 | 1 | 0.01% | 0.02% | 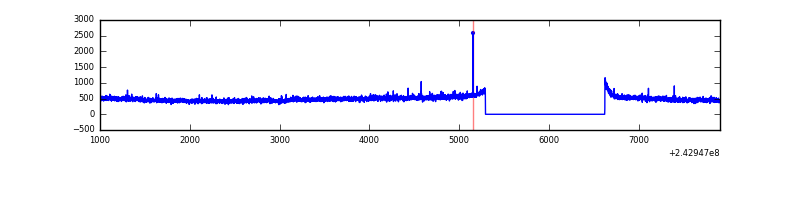 |
| B | 6906 | 5577 | 166 | 166 | 2.40% | 2.98% | 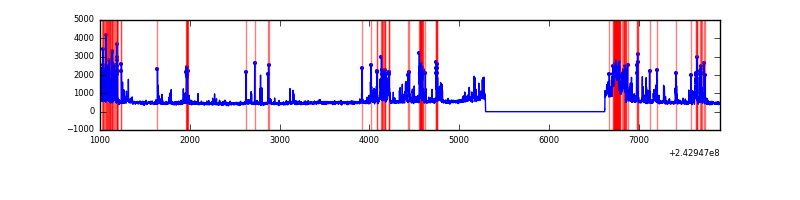 |
| C | 6906 | 5577 | 0 | 0 | 0.00% | 0.00% | 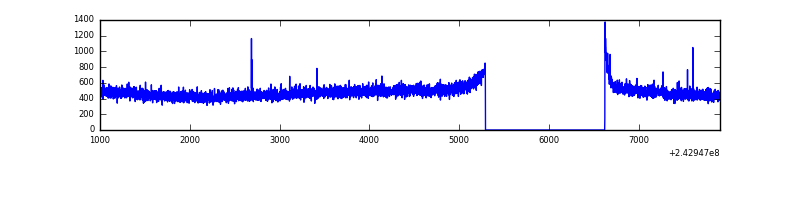 |
| D | 6906 | 5577 | 12 | 12 | 0.17% | 0.22% | 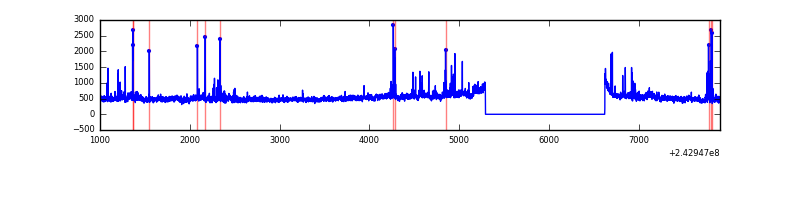 |
Top three noisy pixels from each quadrant. If the there are fewer than three noisy pixels in the level2.evt file, extra rows are filled as -1
| Pixel properties | Quadrant properties | ||||||
|---|---|---|---|---|---|---|---|
| Quadrant | DetID | PixID | Counts | Sigma | Mean | Median | Sigma |
| A | 1 | 162 | 13837 | 92.43 | 696 | 686 | 142.3 |
| A | 0 | 226 | 6442 | 40.46 | 696 | 686 | 142.3 |
| A | 12 | 194 | 5565 | 34.29 | 696 | 686 | 142.3 |
| B | 4 | 239 | 992893 | 7686.31 | 694 | 682 | 129.1 |
| B | 4 | 80 | 40441 | 308.0 | 694 | 682 | 129.1 |
| B | 0 | 214 | 27544 | 208.09 | 694 | 682 | 129.1 |
| C | 4 | 175 | 10996 | 66.29 | 680 | 686 | 155.5 |
| C | 13 | 61 | 4996 | 27.71 | 680 | 686 | 155.5 |
| C | 14 | 234 | 3057 | 15.24 | 680 | 686 | 155.5 |
| D | 2 | 16 | 293534 | 1819.02 | 666 | 649 | 161.0 |
| D | 8 | 195 | 99320 | 612.82 | 666 | 649 | 161.0 |
| D | 13 | 104 | 54734 | 335.91 | 666 | 649 | 161.0 |
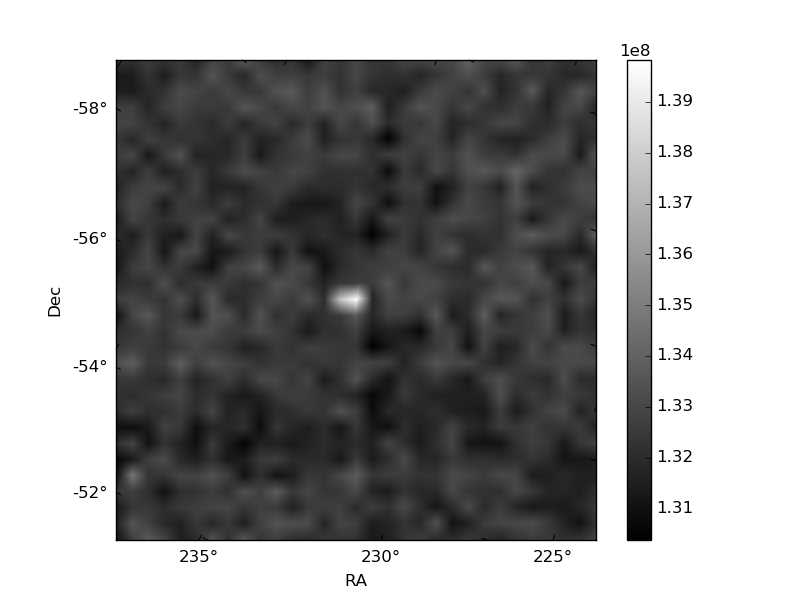
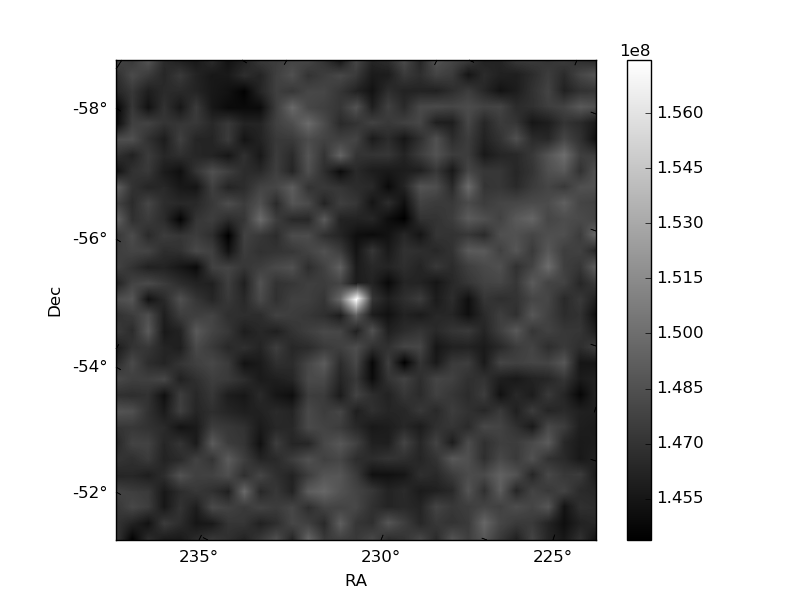
Histogram calculated using DETX and DETY for each event in the final _common_clean file
| Quadrant A | 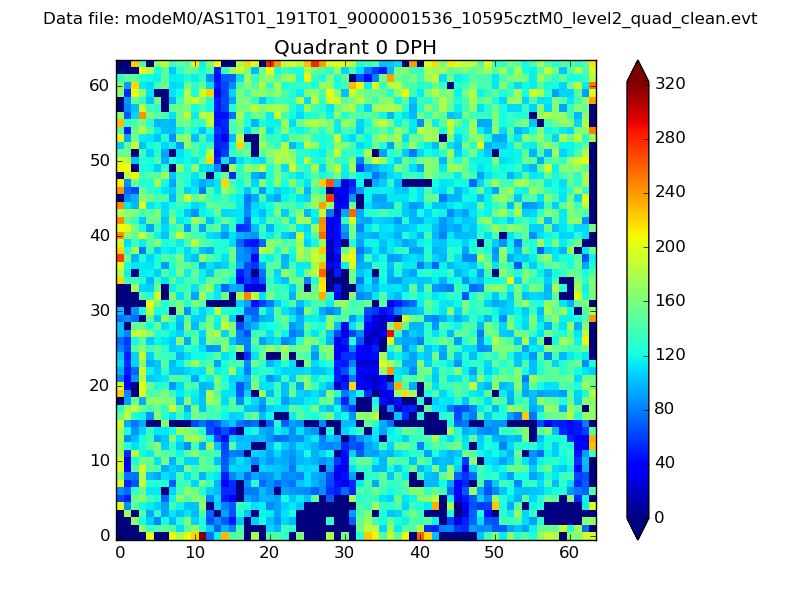 |
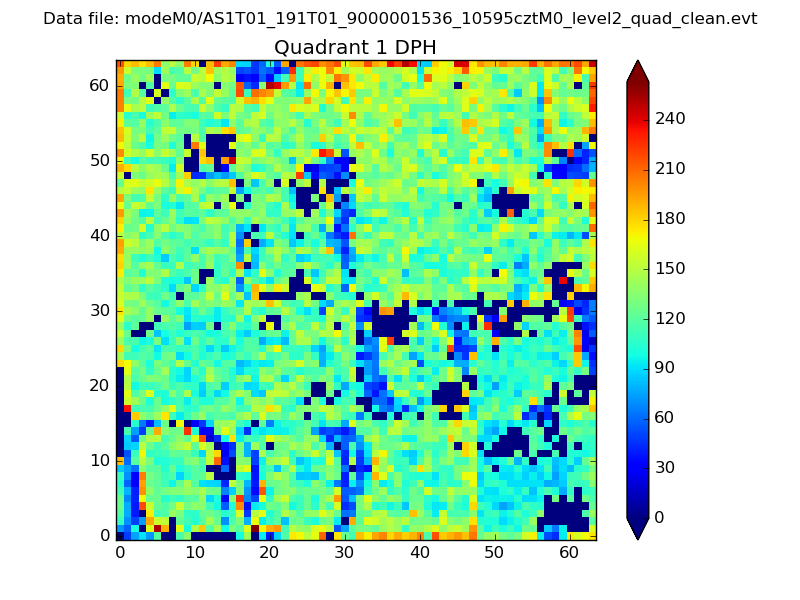 |
Quadrant B |
|---|---|---|---|
| Quadrant D | 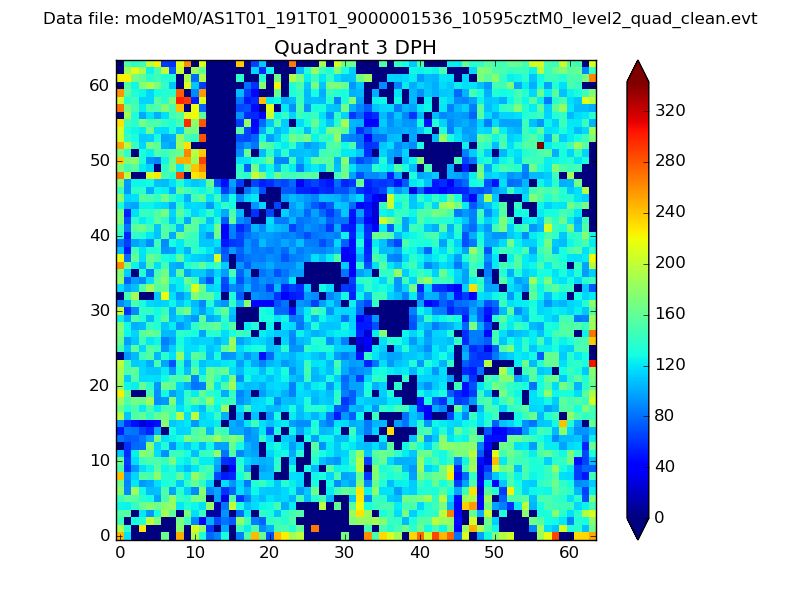 |
 |
Quadrant C |
| Plot type | Count rate plots | Images |
|---|---|---|
| Comparison with Poisson distribution Blue bars denote a histogram of data divided into 1 sec bins. Red curve is a Poisson curve with rate = median count rate of data. |
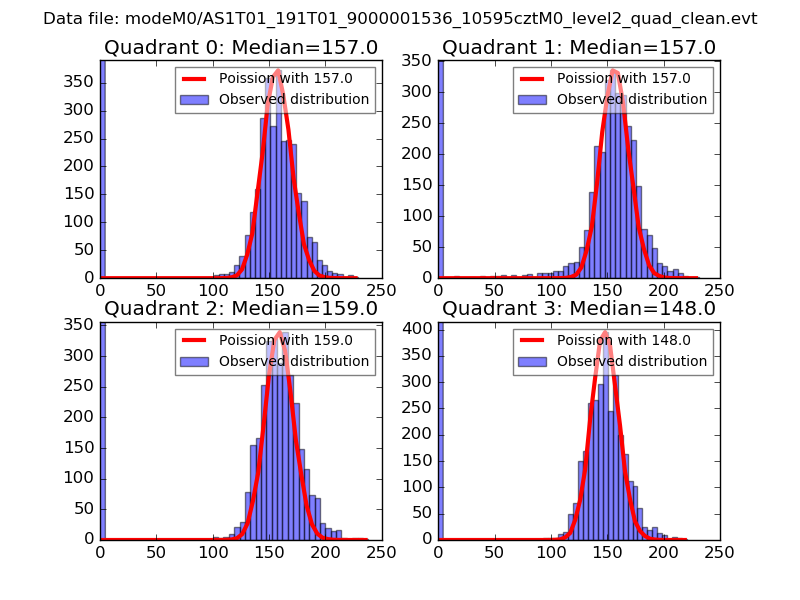 |
 |
| Quadrant-wise count rates Data is divided into 100 sec bins |
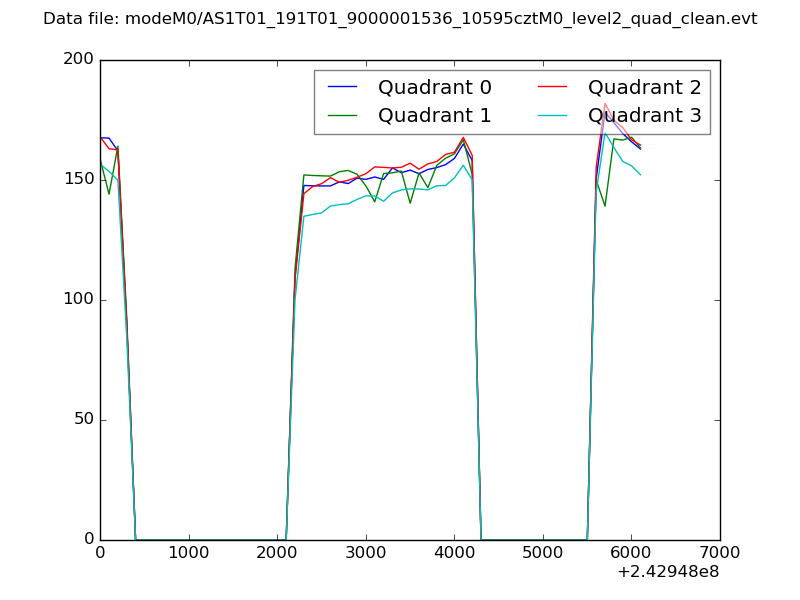 |
|
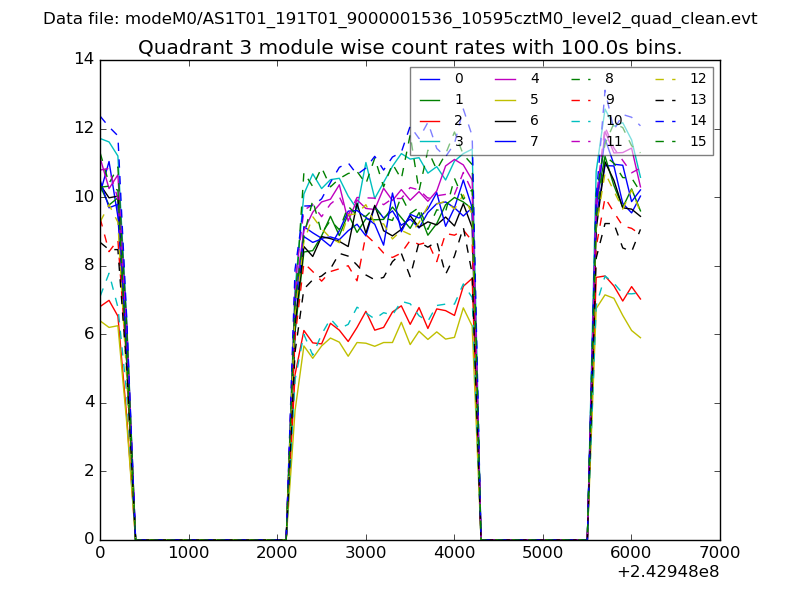
| Module-wise count rates for Quadrant A Data is divided into 100 sec bins |
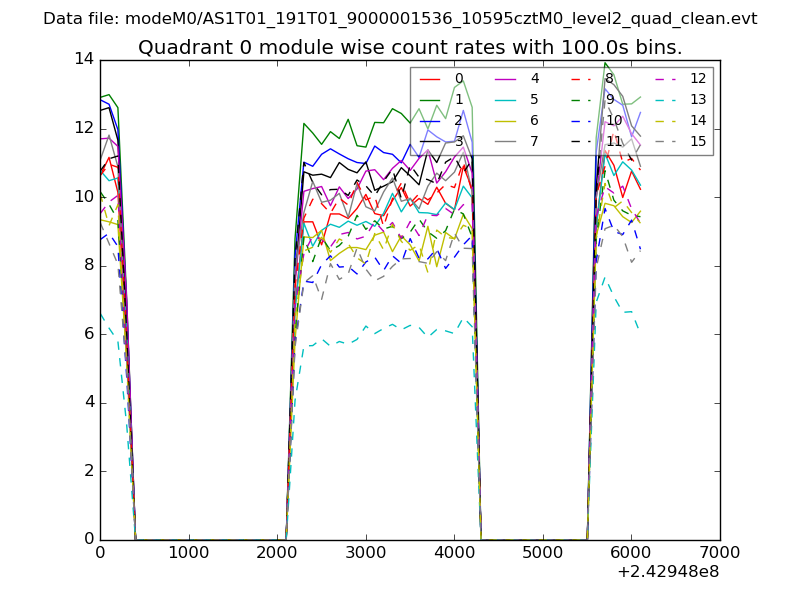 |
 |
| Module-wise count rates for Quadrant B Data is divided into 100 sec bins |
 |
 |
| Module-wise count rates for Quadrant C Data is divided into 100 sec bins |
 |
 |
| Module-wise count rates for Quadrant D Data is divided into 100 sec bins |
 |
 |
| Parameter | Plot |
|---|---|
| CZT HV Monitor | 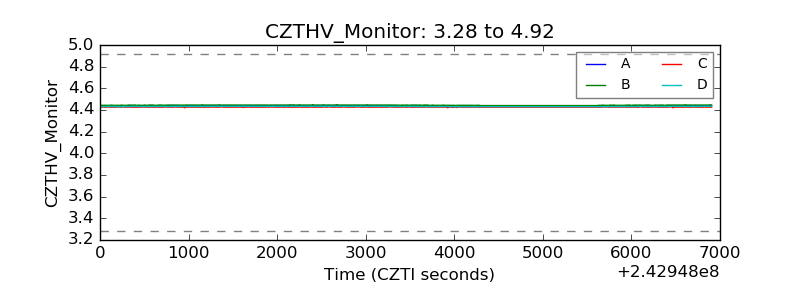 |
| D_VDD | 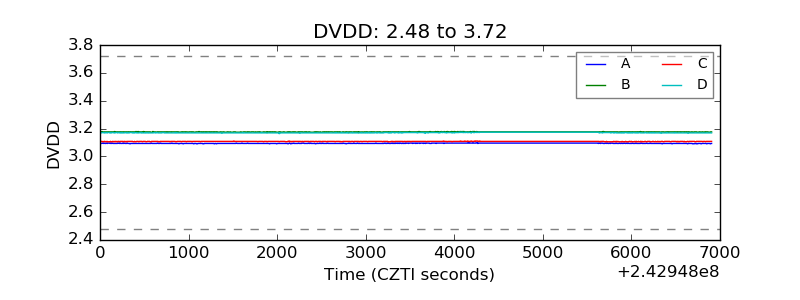 |
| Temperature 1 | 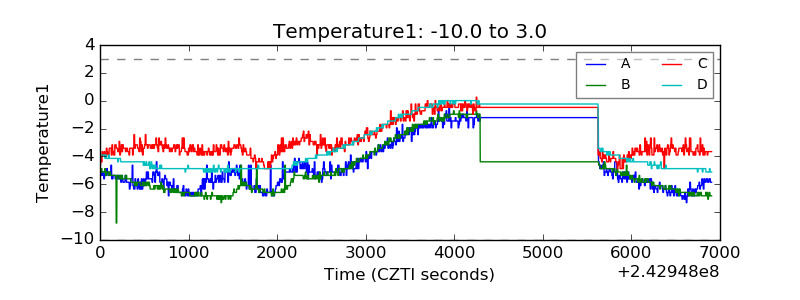 |
| Veto HV Monitor | 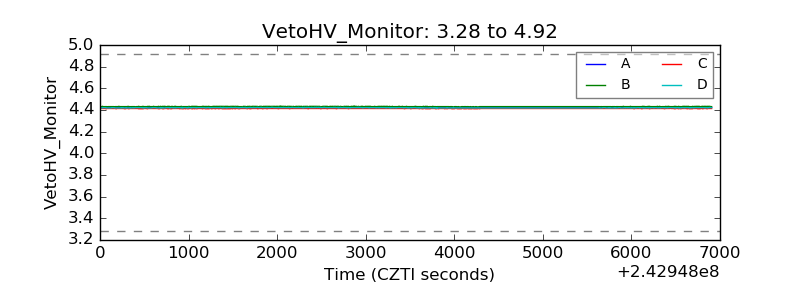 |
| Veto LLD | 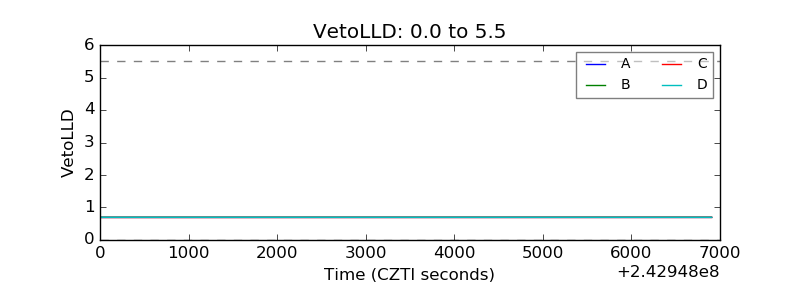 |
| Alpha Counter | 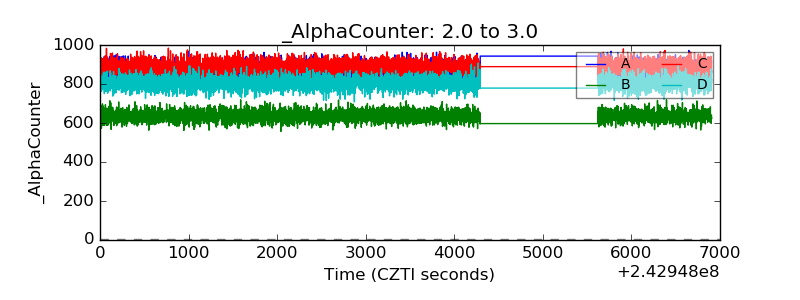 |
| _CPM_Rate | 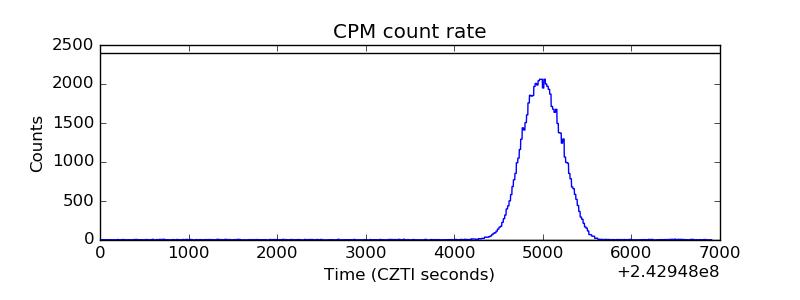 |
| CZT Counter |  |
| +2.5 Volts monitor |  |
| +5 Volts monitor | 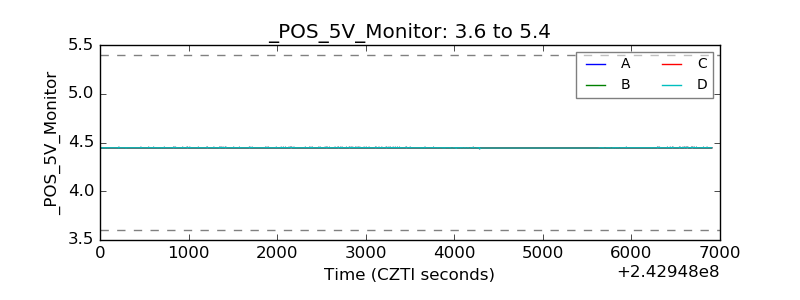 |
| _ROLL_ROT | 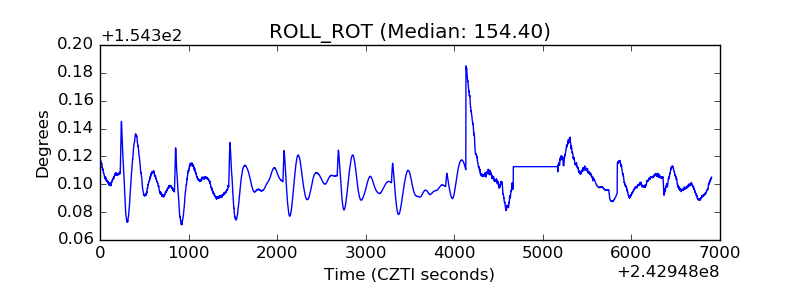 |
| _Roll_DEC | 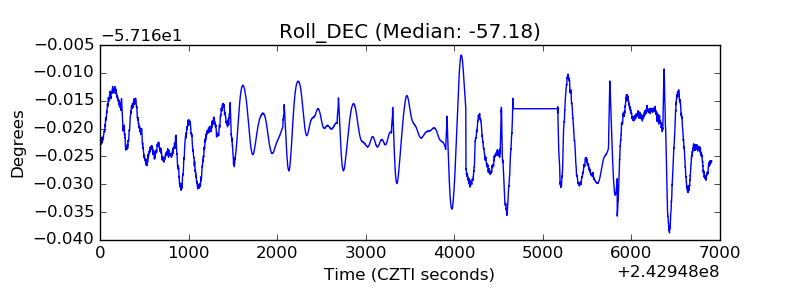 |
| _Roll_RA | 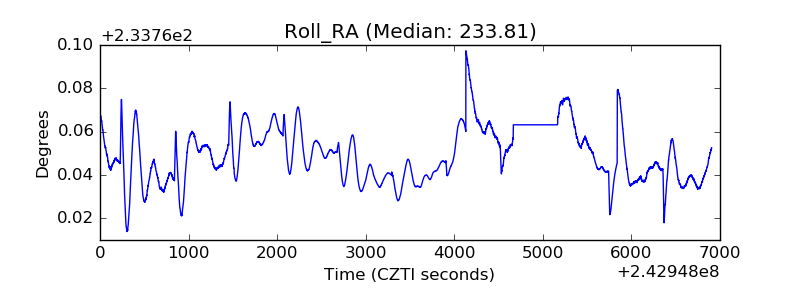 |
| Veto Counter | 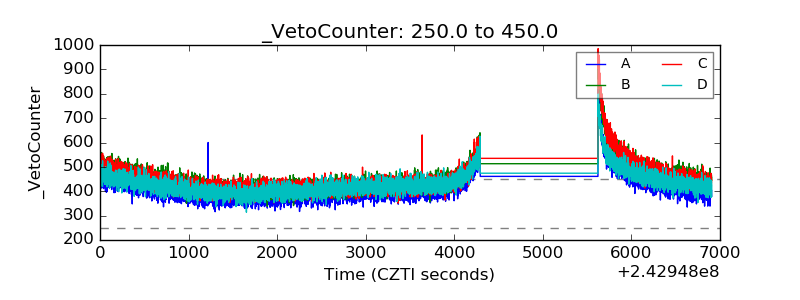 |