| Param | Original file | Final file |
|---|---|---|
| Filename | modeM0/AS1T01_191T01_9000001536_10596cztM0_level2.evt | modeM0/AS1T01_191T01_9000001536_10596cztM0_level2_quad_clean.evt |
| Size (bytes) | 494,337,600 | 80,657,280 |
| Size | 471.4 MB | 76.9 MB |
| Events in quadrant A | 3,037,686 | 511,104 |
| Events in quadrant B | 4,626,575 | 495,545 |
| Events in quadrant C | 3,003,859 | 516,759 |
| Events in quadrant D | 3,876,524 | 480,267 |
| Mode SS | |||
|---|---|---|---|
| Quadrant | BADHDUFLAG | Total packets | Discarded packets |
| A | 0 | 128 | 0 |
| B | 0 | 128 | 0 |
| C | 0 | 128 | 0 |
| D | 0 | 128 | 0 |
| Mode M9 | |||
|---|---|---|---|
| Quadrant | BADHDUFLAG | Total packets | Discarded packets |
| A | 0 | 16 | 0 |
| B | 0 | 16 | 0 |
| C | 0 | 16 | 0 |
| D | 0 | 17 | 0 |
| Mode M0 | |||
|---|---|---|---|
| Quadrant | BADHDUFLAG | Total packets | Discarded packets |
| A | 0 | 12991 | 3 |
| B | 0 | 17819 | 2 |
| C | 0 | 12933 | 2 |
| D | 0 | 15725 | 2 |
| Quadrant | Total seconds | Saturated seconds | Saturation percentage |
|---|---|---|---|
| A | 6280 | 35 | 0.557325% |
| B | 6280 | 494 | 7.866242% |
| C | 6280 | 25 | 0.398089% |
| D | 6280 | 78 | 1.242038% |
Noise dominated data is calculated using 1-second bins in cleaned event files. If a bin has >2000 counts, and if more than 50% of those come from <1% of pixels, then it is considered to be noise-dominated and hence unusable.
| Quadrant | # 1 sec bins | Bins with >0 counts | Bins with >2000 counts | High rate bins dominated by noise | Noise dominated (total time) | Noise dominated (detector-on time) | Marked lightcurve |
|---|---|---|---|---|---|---|---|
| A | 7540 | 6281 | 0 | 0 | 0.00% | 0.00% | 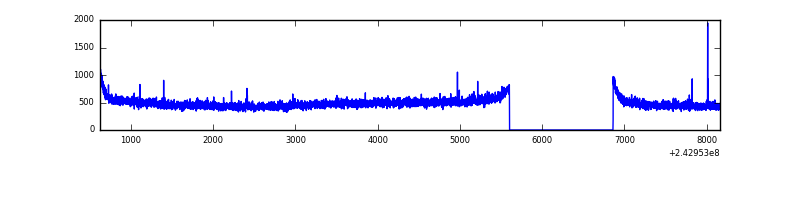 |
| B | 7540 | 6281 | 239 | 239 | 3.17% | 3.81% | 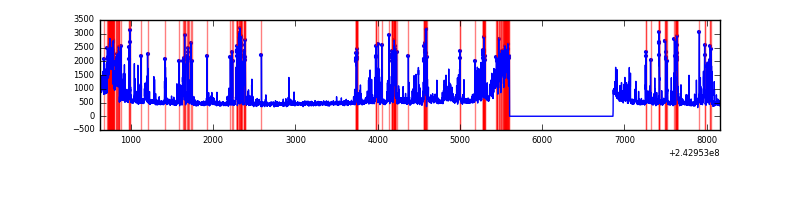 |
| C | 7540 | 6281 | 0 | 0 | 0.00% | 0.00% |  |
| D | 7540 | 6281 | 24 | 24 | 0.32% | 0.38% |  |
Top three noisy pixels from each quadrant. If the there are fewer than three noisy pixels in the level2.evt file, extra rows are filled as -1
| Pixel properties | Quadrant properties | ||||||
|---|---|---|---|---|---|---|---|
| Quadrant | DetID | PixID | Counts | Sigma | Mean | Median | Sigma |
| A | 0 | 226 | 7129 | 39.63 | 785 | 771 | 160.4 |
| A | 1 | 162 | 6915 | 38.3 | 785 | 771 | 160.4 |
| A | 12 | 194 | 6230 | 34.03 | 785 | 771 | 160.4 |
| B | 4 | 239 | 1488382 | 10308.7 | 772 | 759 | 144.3 |
| B | 0 | 214 | 47610 | 324.66 | 772 | 759 | 144.3 |
| B | 11 | 51 | 23253 | 155.88 | 772 | 759 | 144.3 |
| C | 1 | 0 | 6006 | 29.85 | 766 | 775 | 175.3 |
| C | 13 | 61 | 5726 | 28.25 | 766 | 775 | 175.3 |
| C | 12 | 4 | 3845 | 17.52 | 766 | 775 | 175.3 |
| D | 8 | 195 | 416422 | 2311.5 | 751 | 734 | 179.8 |
| D | 2 | 16 | 342894 | 1902.63 | 751 | 734 | 179.8 |
| D | 5 | 222 | 155510 | 860.66 | 751 | 734 | 179.8 |
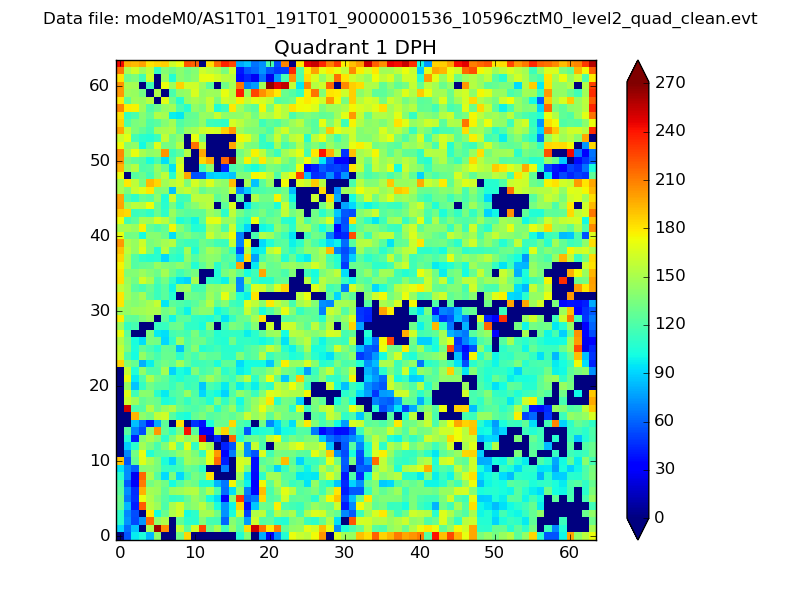
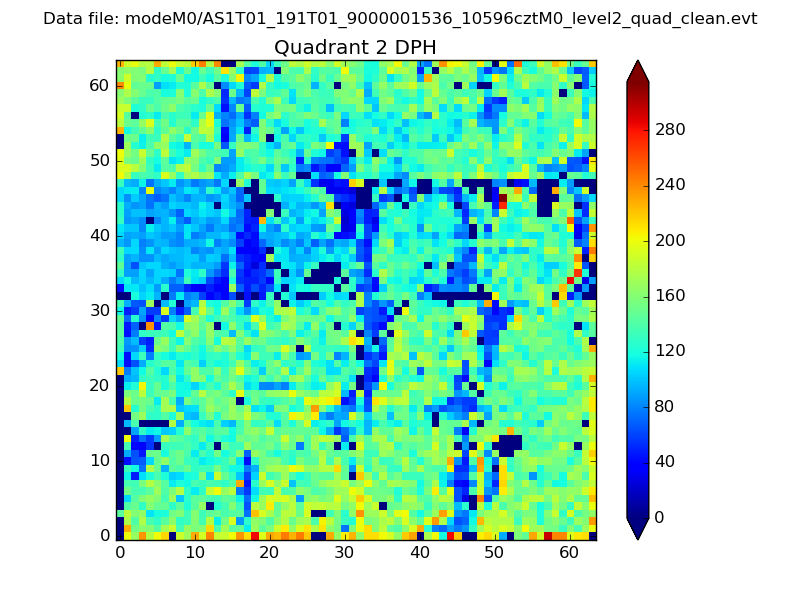
Histogram calculated using DETX and DETY for each event in the final _common_clean file
| Quadrant A |  |
 |
Quadrant B |
|---|---|---|---|
| Quadrant D |  |
 |
Quadrant C |
| Plot type | Count rate plots | Images |
|---|---|---|
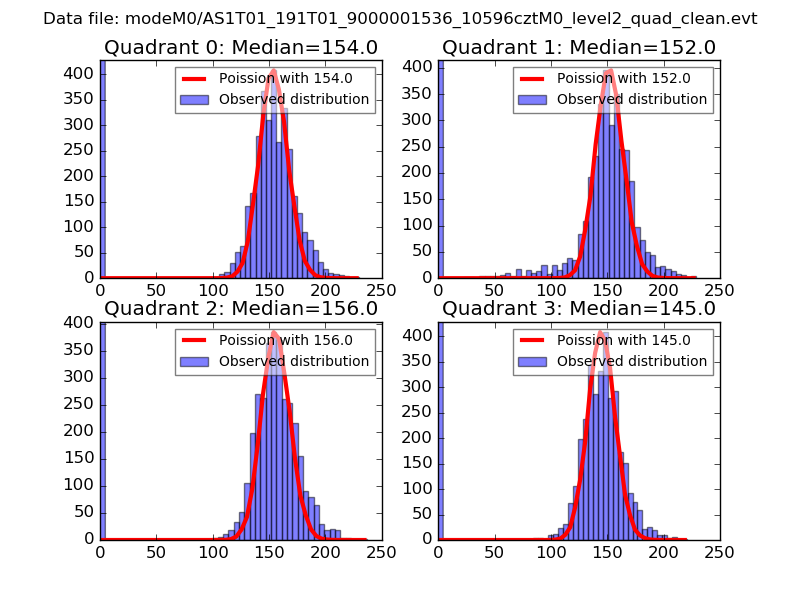
| Comparison with Poisson distribution Blue bars denote a histogram of data divided into 1 sec bins. Red curve is a Poisson curve with rate = median count rate of data. |
 |
 |
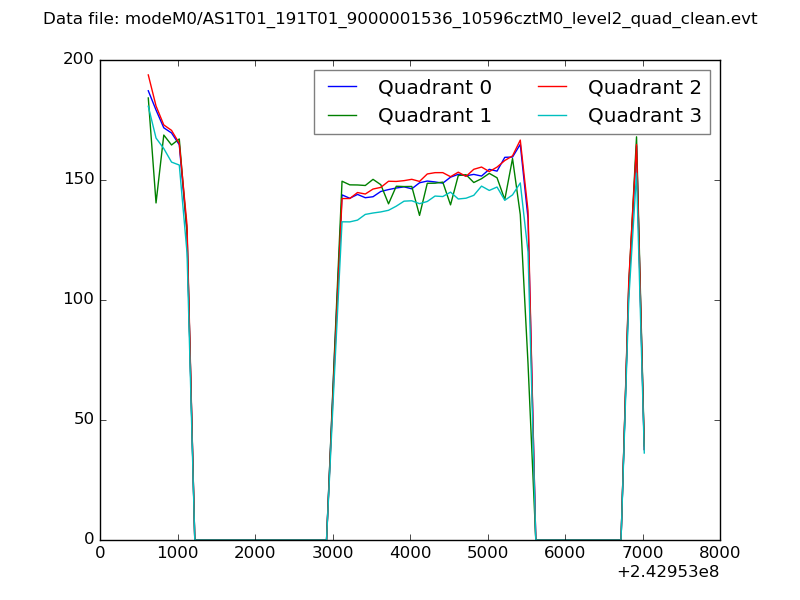
| Quadrant-wise count rates Data is divided into 100 sec bins |
 |
|
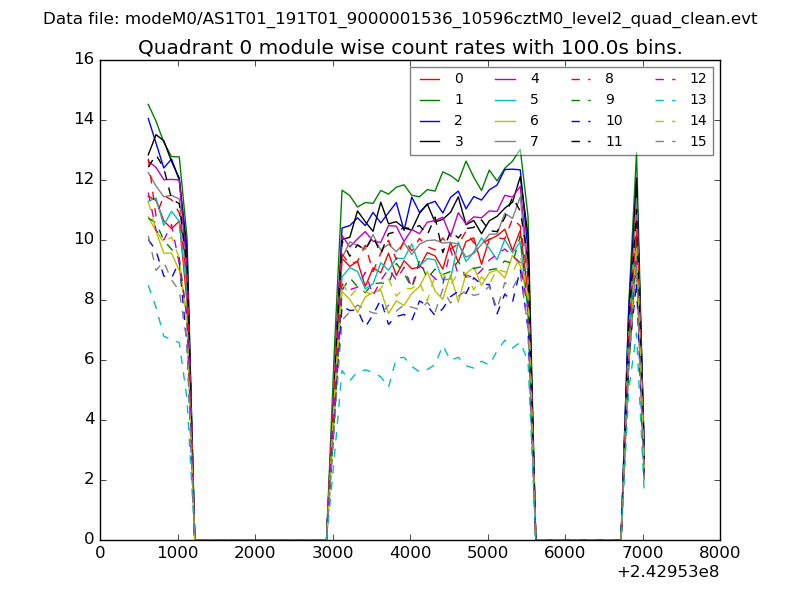
| Module-wise count rates for Quadrant A Data is divided into 100 sec bins |
 |
 |
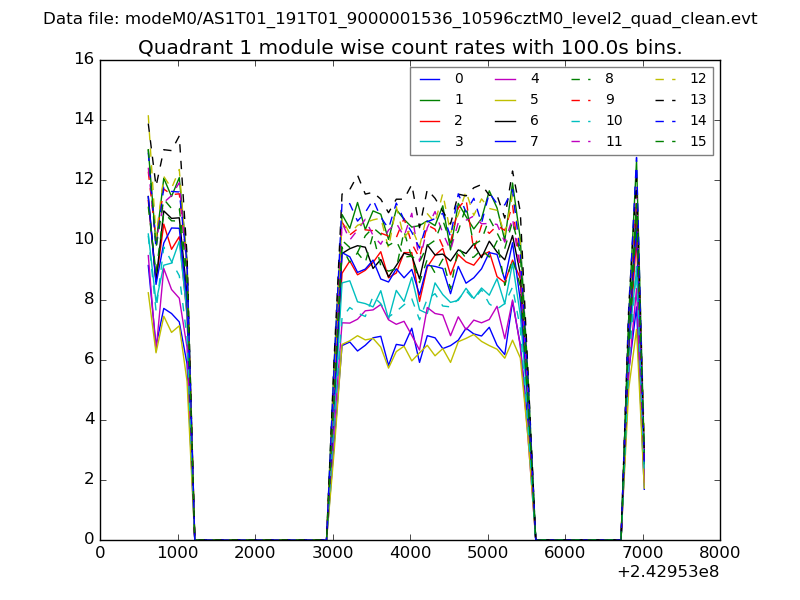
| Module-wise count rates for Quadrant B Data is divided into 100 sec bins |
 |
 |
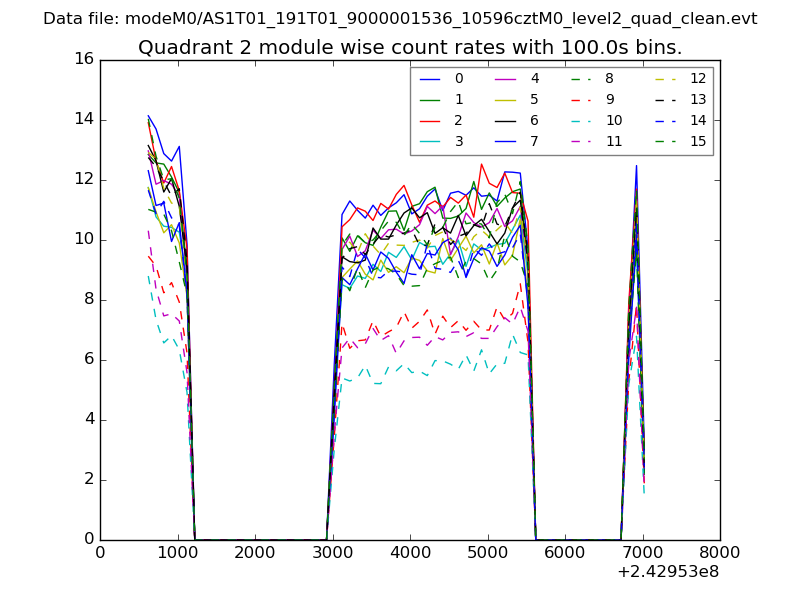
| Module-wise count rates for Quadrant C Data is divided into 100 sec bins |
 |
 |
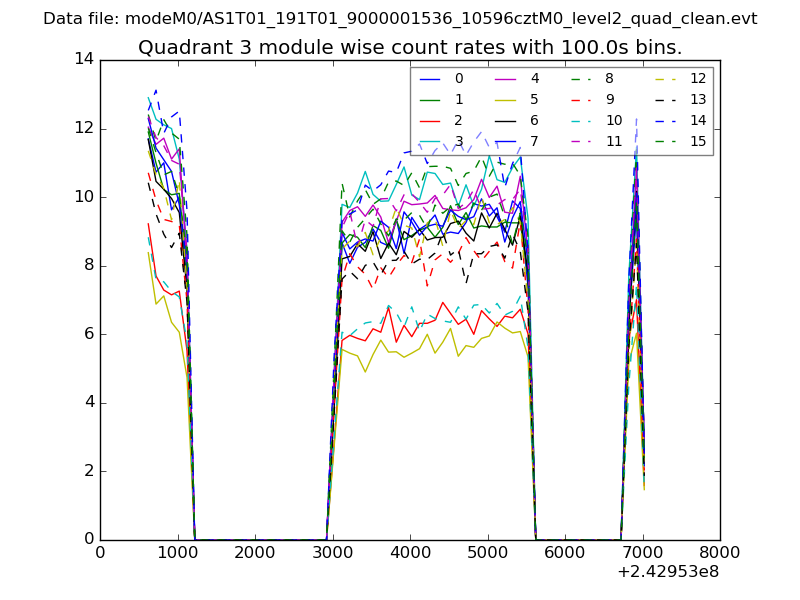
| Module-wise count rates for Quadrant D Data is divided into 100 sec bins |
 |
 |
| Parameter | Plot |
|---|---|
| CZT HV Monitor | 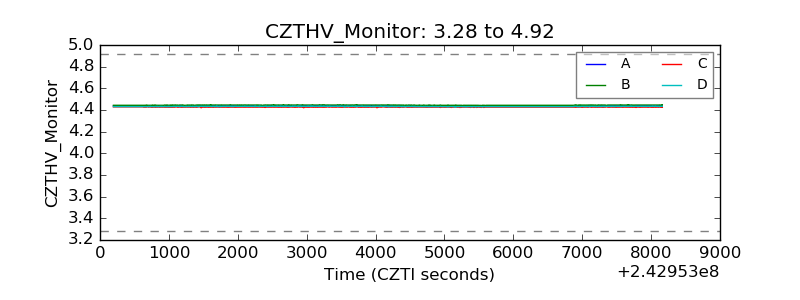 |
| D_VDD | 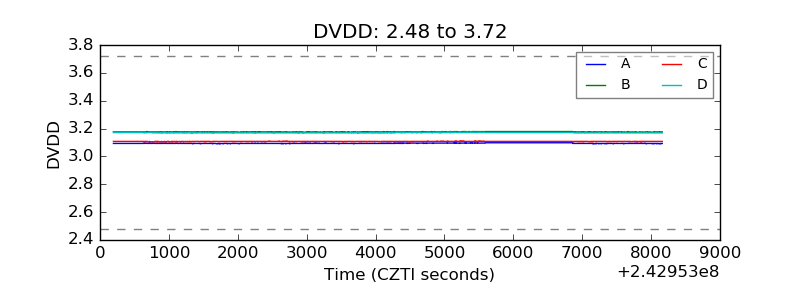 |
| Temperature 1 | 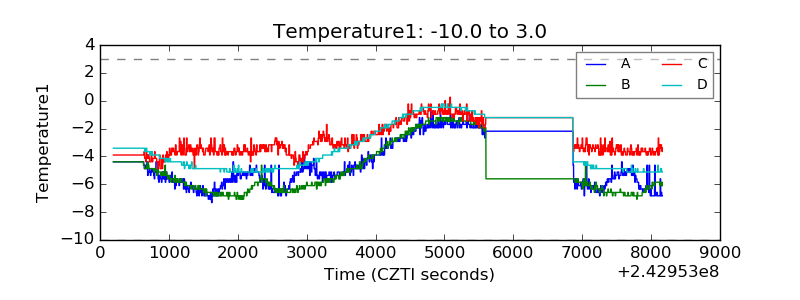 |
| Veto HV Monitor | 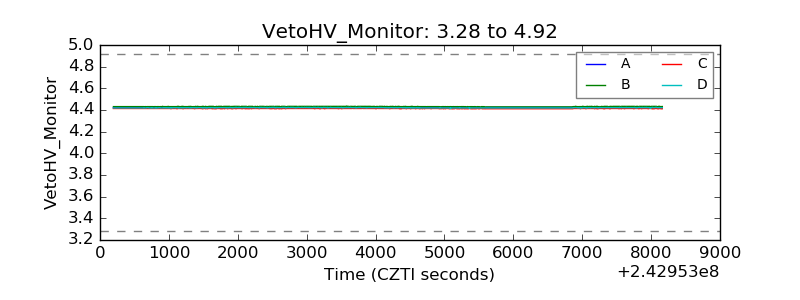 |
| Veto LLD | 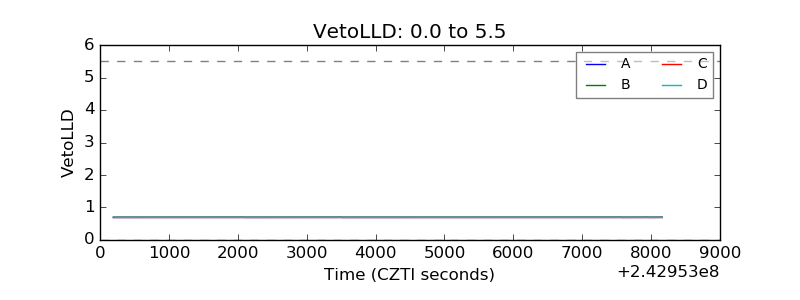 |
| Alpha Counter | 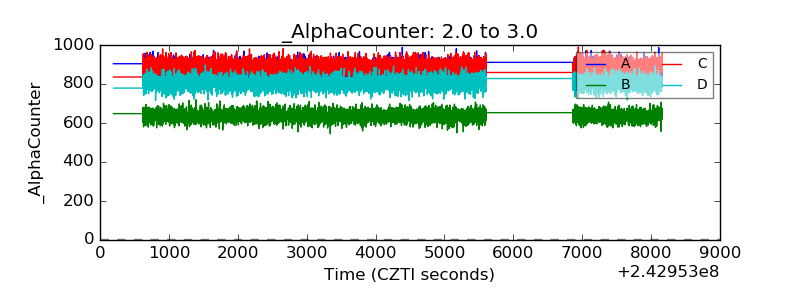 |
| _CPM_Rate | 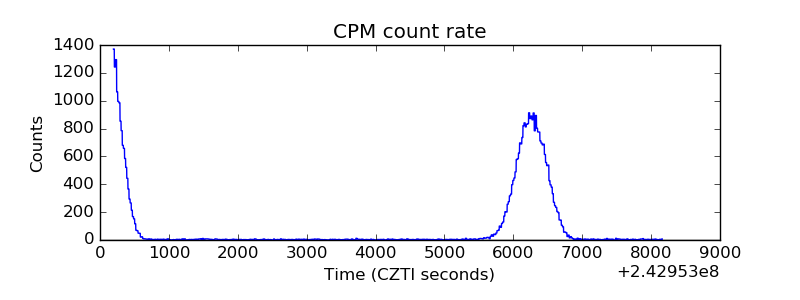 |
| CZT Counter |  |
| +2.5 Volts monitor |  |
| +5 Volts monitor | 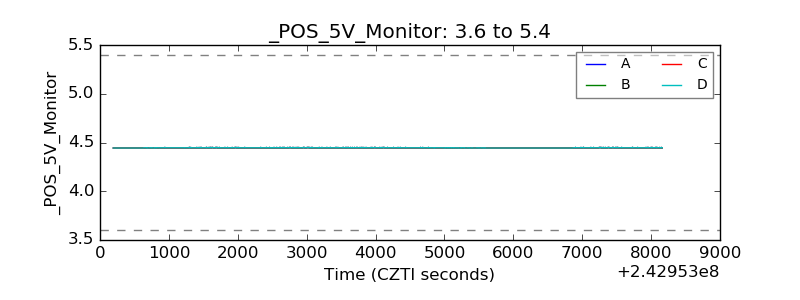 |
| _ROLL_ROT | 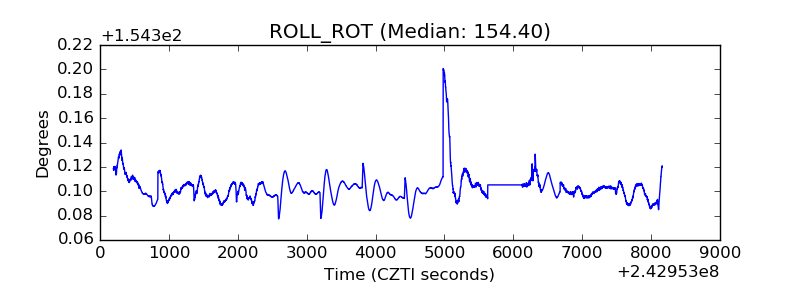 |
| _Roll_DEC | 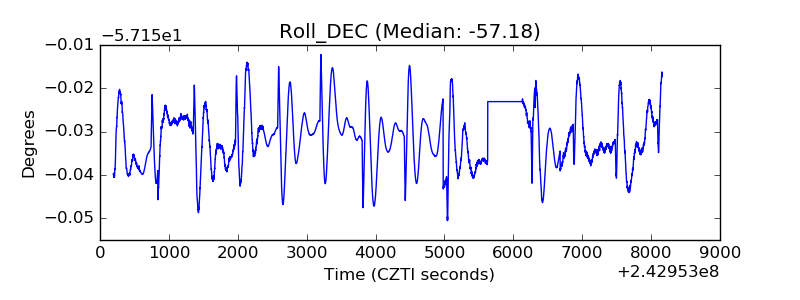 |
| _Roll_RA |  |
| Veto Counter | 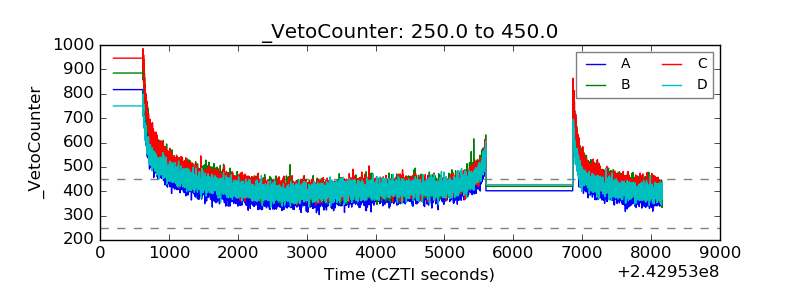 |