| Param | Original file | Final file |
|---|---|---|
| Filename | modeM0/AS1T01_191T01_9000001536_10598cztM0_level2.evt | modeM0/AS1T01_191T01_9000001536_10598cztM0_level2_quad_clean.evt |
| Size (bytes) | 599,385,600 | 93,323,520 |
| Size | 571.6 MB | 89.0 MB |
| Events in quadrant A | 3,787,141 | 586,877 |
| Events in quadrant B | 5,337,645 | 591,237 |
| Events in quadrant C | 3,639,662 | 597,659 |
| Events in quadrant D | 4,906,189 | 554,919 |
| Mode SS | |||
|---|---|---|---|
| Quadrant | BADHDUFLAG | Total packets | Discarded packets |
| A | 0 | 144 | 0 |
| B | 0 | 144 | 0 |
| C | 0 | 144 | 0 |
| D | 0 | 144 | 0 |
| Mode M9 | |||
|---|---|---|---|
| Quadrant | BADHDUFLAG | Total packets | Discarded packets |
| A | 0 | 5 | 0 |
| B | 0 | 5 | 0 |
| C | 0 | 5 | 0 |
| D | 0 | 5 | 0 |
| Mode M0 | |||
|---|---|---|---|
| Quadrant | BADHDUFLAG | Total packets | Discarded packets |
| A | 0 | 15964 | 2 |
| B | 0 | 20533 | 1 |
| C | 0 | 15728 | 1 |
| D | 0 | 19278 | 1 |
| Quadrant | Total seconds | Saturated seconds | Saturation percentage |
|---|---|---|---|
| A | 7111 | 157 | 2.207847% |
| B | 7111 | 716 | 10.068907% |
| C | 7111 | 143 | 2.010969% |
| D | 7111 | 289 | 4.064126% |
Noise dominated data is calculated using 1-second bins in cleaned event files. If a bin has >2000 counts, and if more than 50% of those come from <1% of pixels, then it is considered to be noise-dominated and hence unusable.
| Quadrant | # 1 sec bins | Bins with >0 counts | Bins with >2000 counts | High rate bins dominated by noise | Noise dominated (total time) | Noise dominated (detector-on time) | Marked lightcurve |
|---|---|---|---|---|---|---|---|
| A | 7566 | 7112 | 69 | 69 | 0.91% | 0.97% | 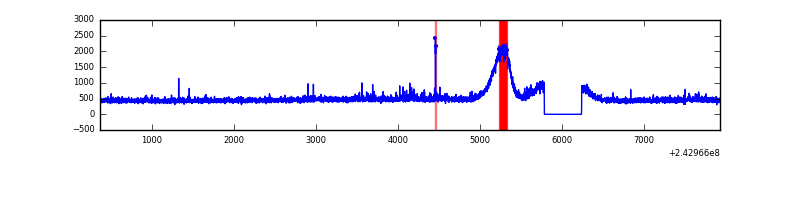 |
| B | 7566 | 7112 | 413 | 413 | 5.46% | 5.81% | 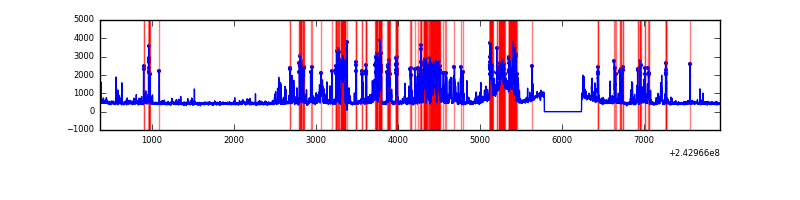 |
| C | 7566 | 7112 | 55 | 55 | 0.73% | 0.77% | 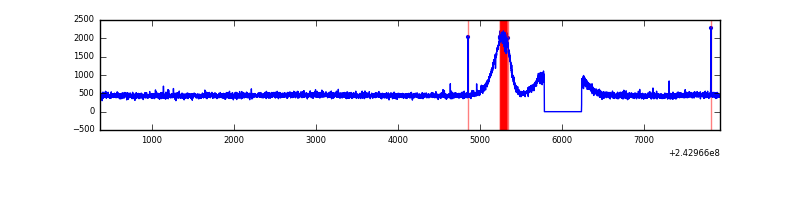 |
| D | 7566 | 7112 | 203 | 203 | 2.68% | 2.85% | 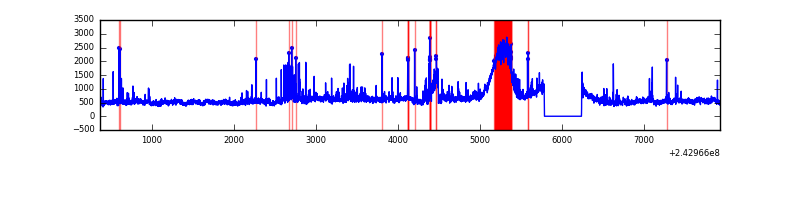 |
Top three noisy pixels from each quadrant. If the there are fewer than three noisy pixels in the level2.evt file, extra rows are filled as -1
| Pixel properties | Quadrant properties | ||||||
|---|---|---|---|---|---|---|---|
| Quadrant | DetID | PixID | Counts | Sigma | Mean | Median | Sigma |
| A | 13 | 251 | 76816 | 371.48 | 954 | 940 | 204.2 |
| A | 1 | 162 | 20339 | 94.97 | 954 | 940 | 204.2 |
| A | 14 | 254 | 11169 | 50.08 | 954 | 940 | 204.2 |
| B | 4 | 239 | 1721441 | 10176.15 | 876 | 859 | 169.1 |
| B | 4 | 81 | 94993 | 556.74 | 876 | 859 | 169.1 |
| B | 0 | 214 | 37058 | 214.09 | 876 | 859 | 169.1 |
| C | 1 | 0 | 7035 | 26.9 | 930 | 941 | 226.5 |
| C | 13 | 61 | 6618 | 25.06 | 930 | 941 | 226.5 |
| C | 14 | 234 | 5615 | 20.63 | 930 | 941 | 226.5 |
| D | 8 | 195 | 489578 | 2001.38 | 948 | 930 | 244.2 |
| D | 2 | 16 | 399111 | 1630.85 | 948 | 930 | 244.2 |
| D | 13 | 104 | 131353 | 534.18 | 948 | 930 | 244.2 |
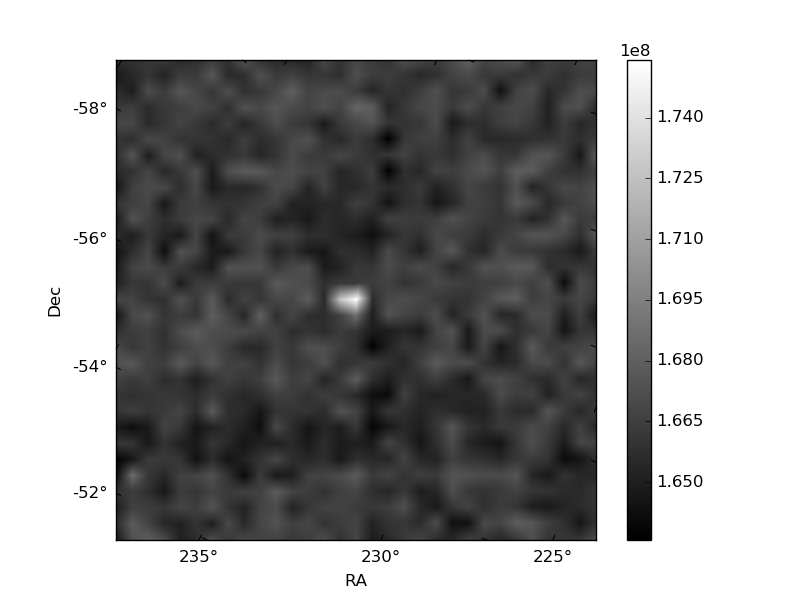
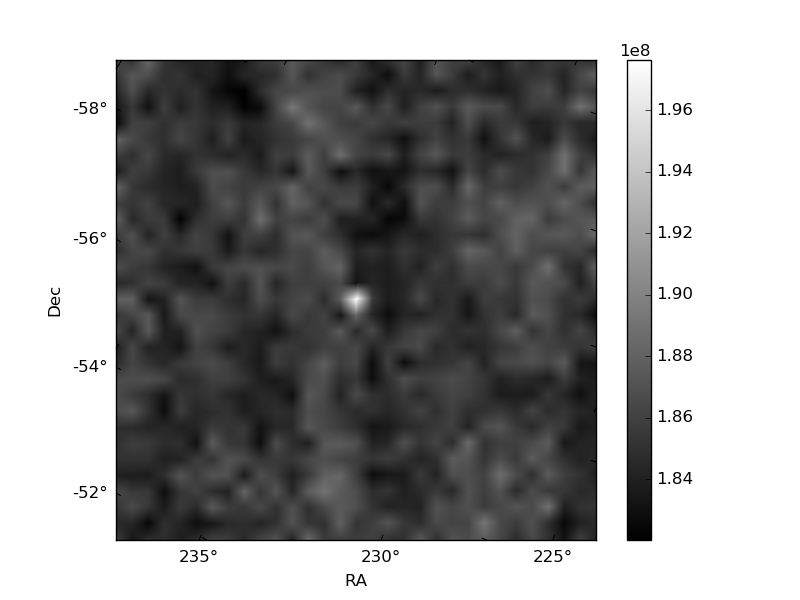
Histogram calculated using DETX and DETY for each event in the final _common_clean file
| Quadrant A | 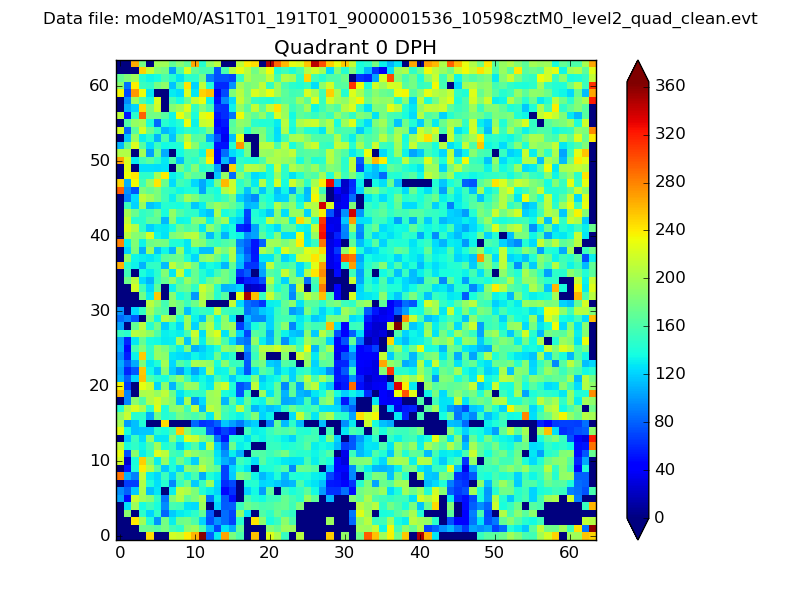 |
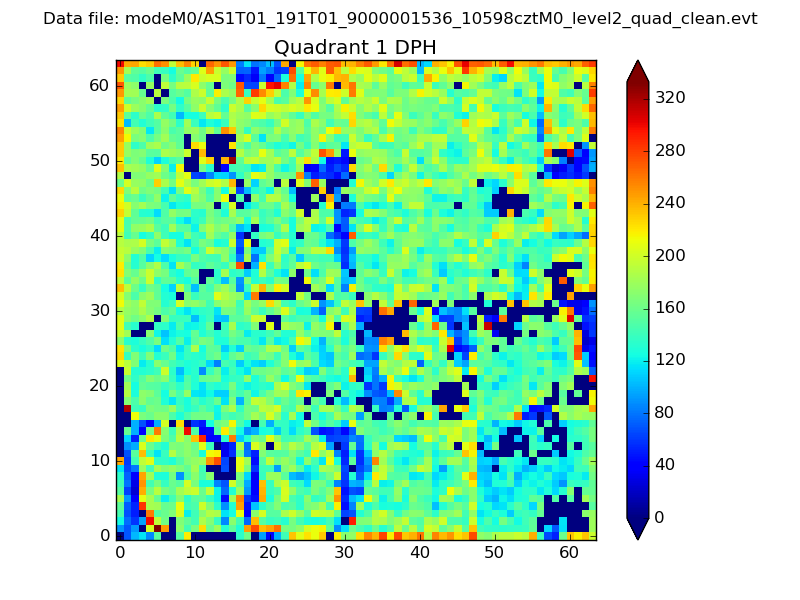 |
Quadrant B |
|---|---|---|---|
| Quadrant D | 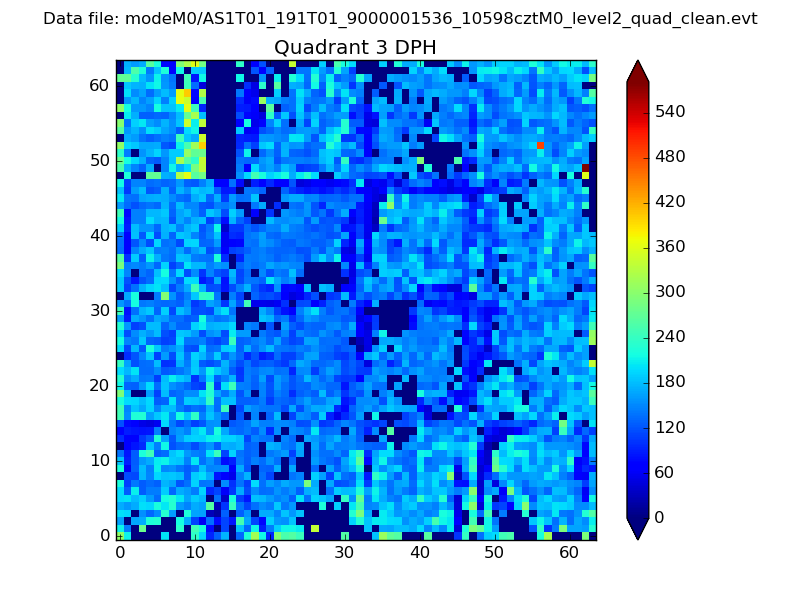 |
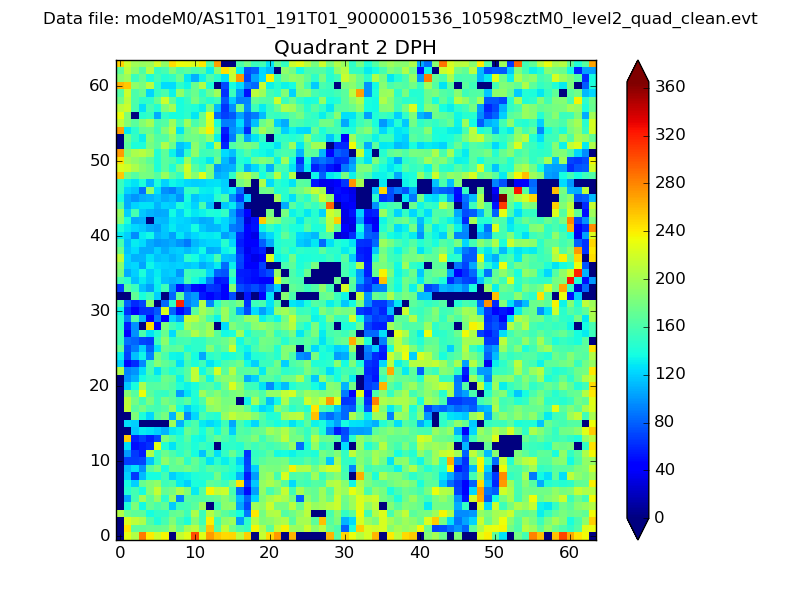 |
Quadrant C |
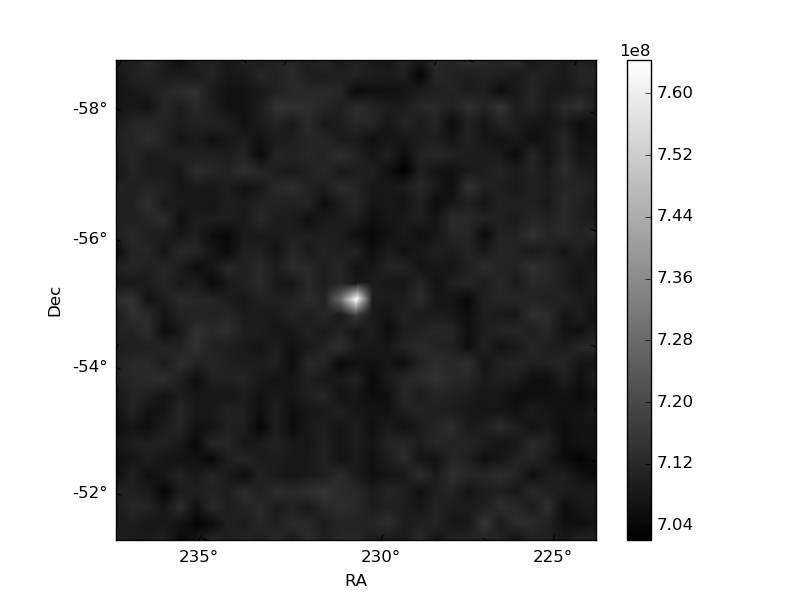
| Plot type | Count rate plots | Images |
|---|---|---|
| Comparison with Poisson distribution Blue bars denote a histogram of data divided into 1 sec bins. Red curve is a Poisson curve with rate = median count rate of data. |
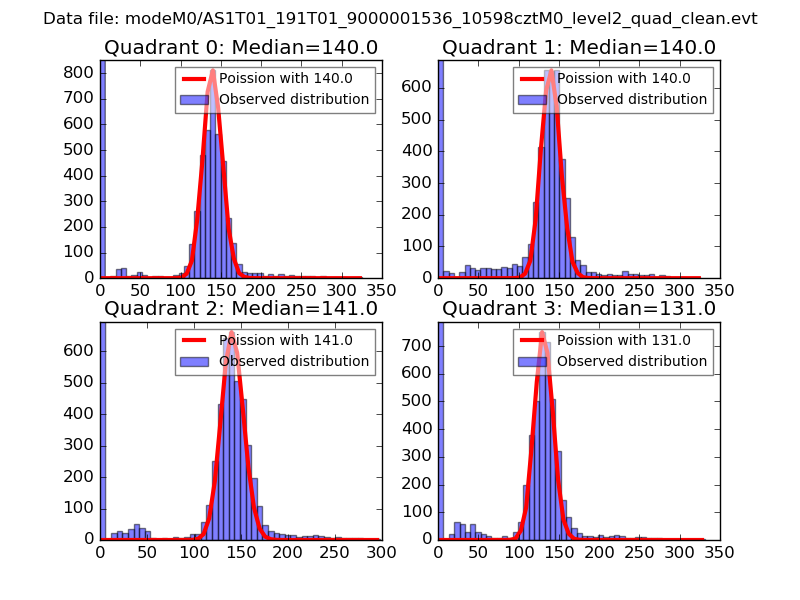 |
 |
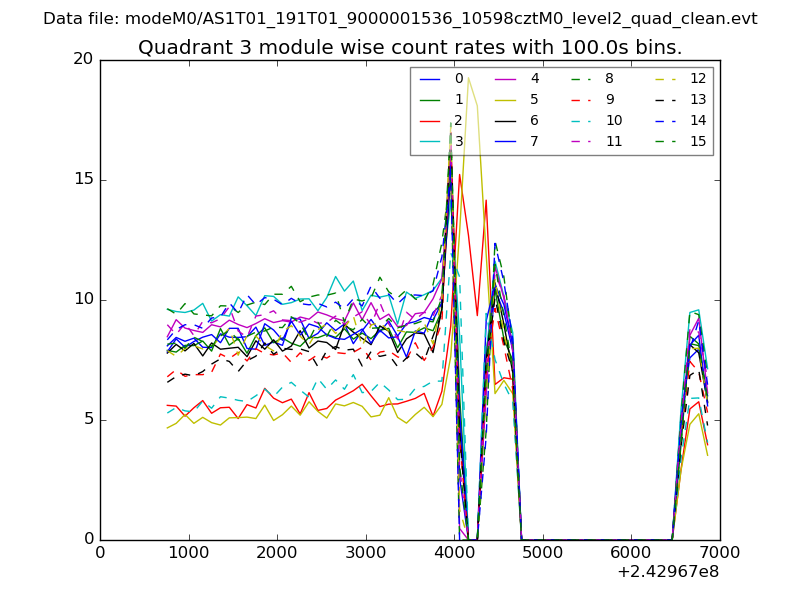
| Quadrant-wise count rates Data is divided into 100 sec bins |
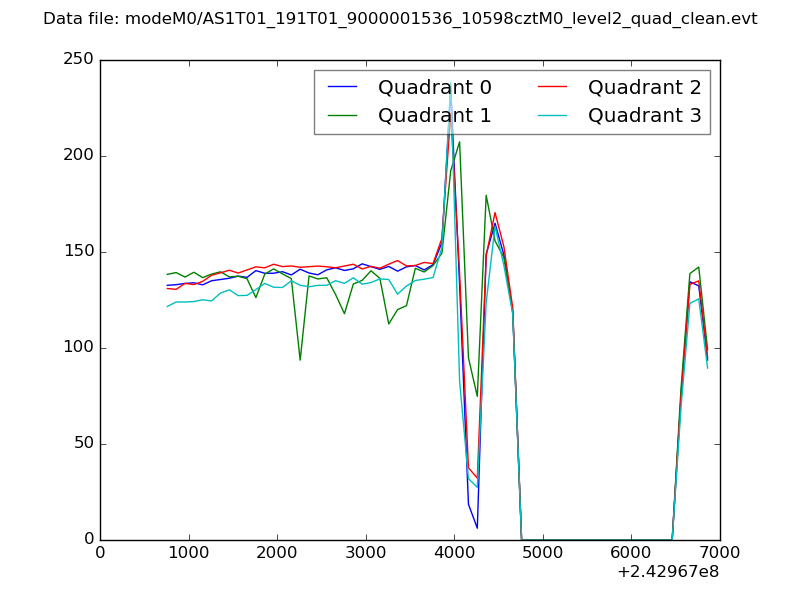 |
|
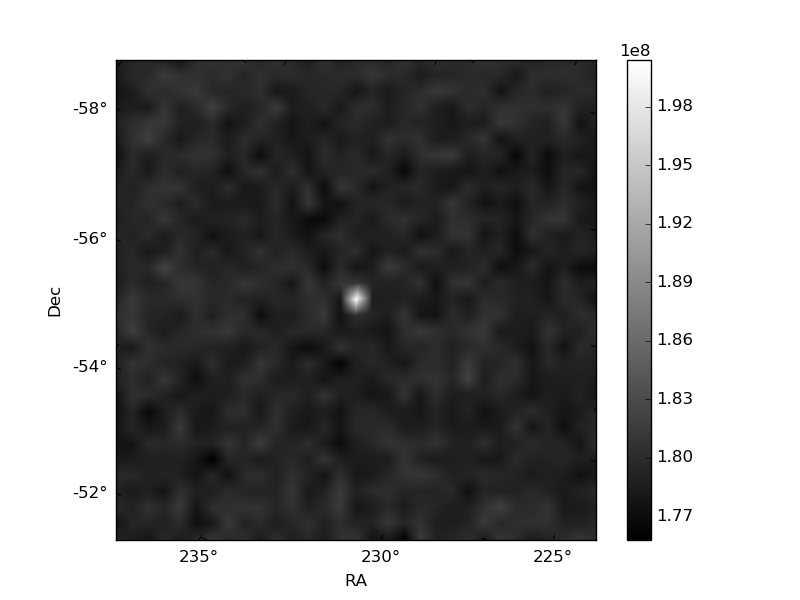
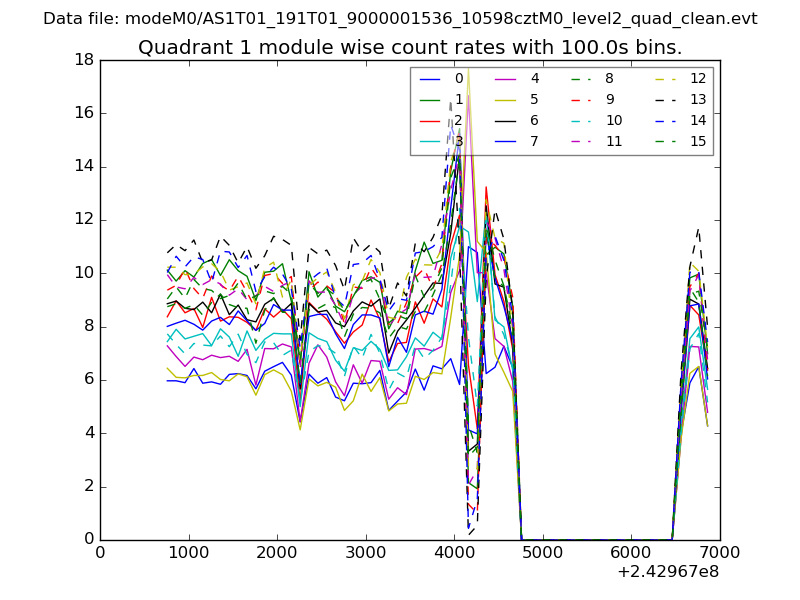
| Module-wise count rates for Quadrant A Data is divided into 100 sec bins |
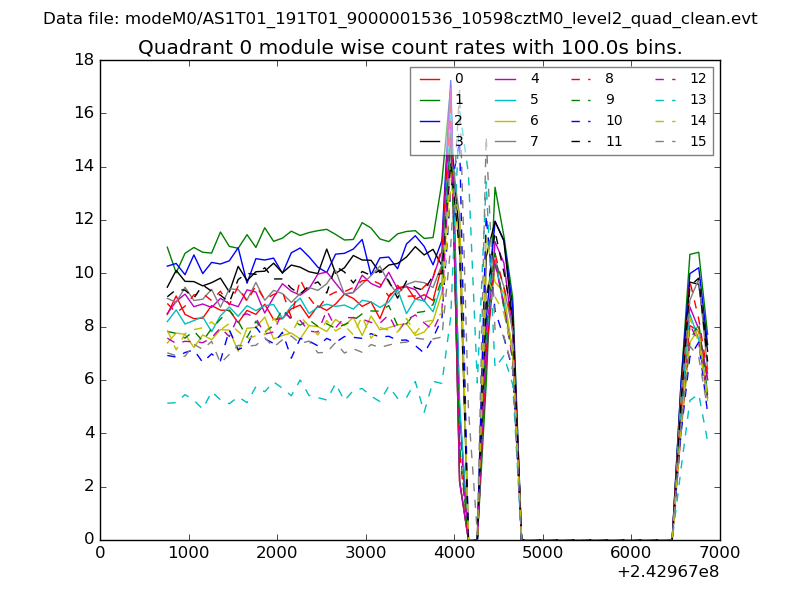 |
 |
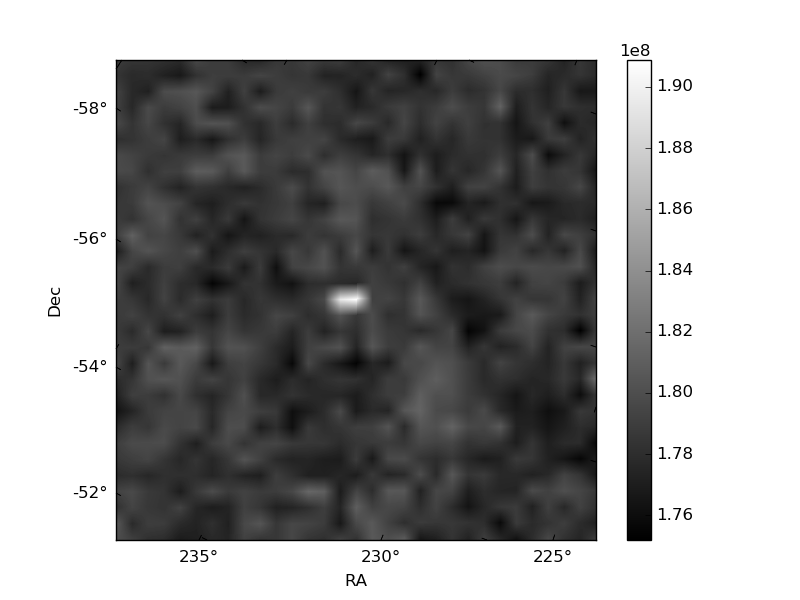
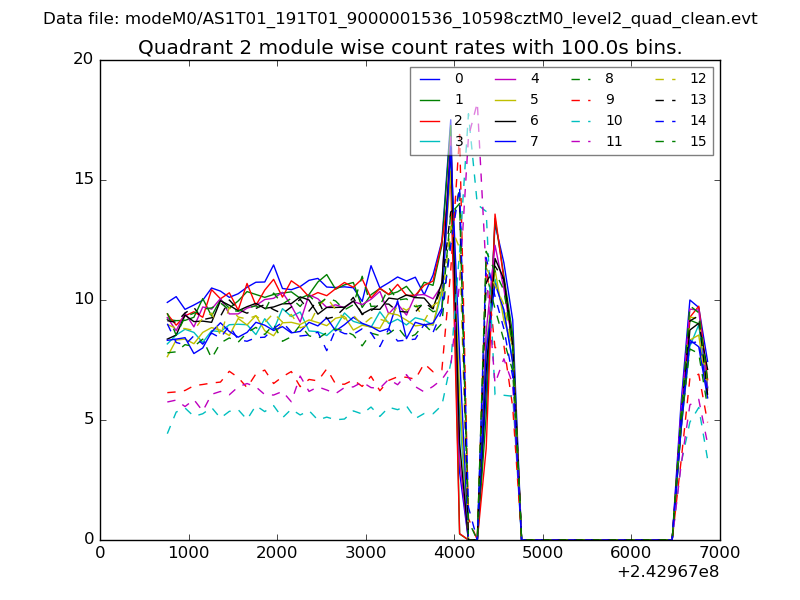
| Module-wise count rates for Quadrant B Data is divided into 100 sec bins |
 |
 |
| Module-wise count rates for Quadrant C Data is divided into 100 sec bins |
 |
 |
| Module-wise count rates for Quadrant D Data is divided into 100 sec bins |
 |
 |
| Parameter | Plot |
|---|---|
| CZT HV Monitor | 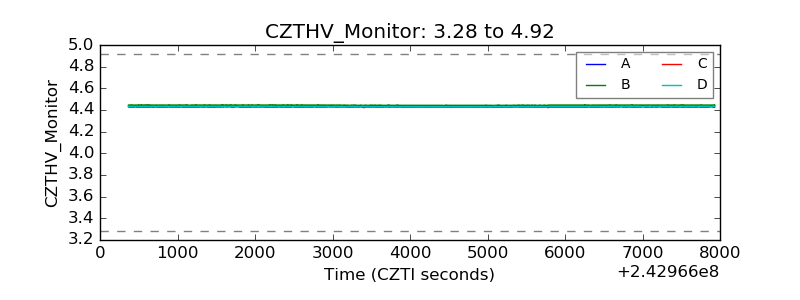 |
| D_VDD | 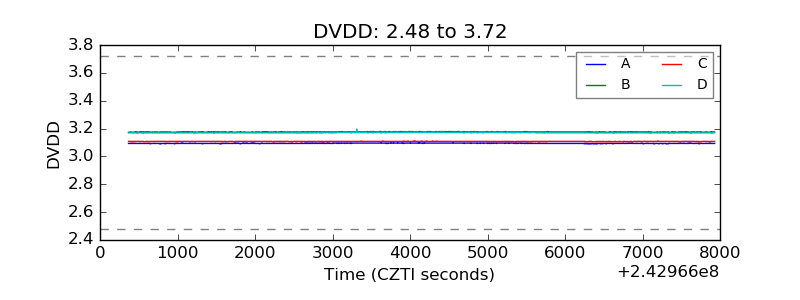 |
| Temperature 1 | 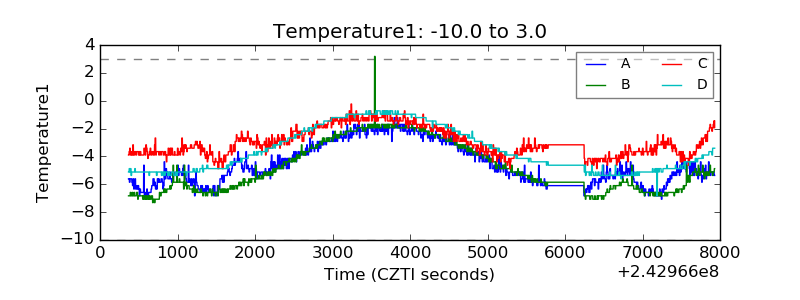 |
| Veto HV Monitor |  |
| Veto LLD | 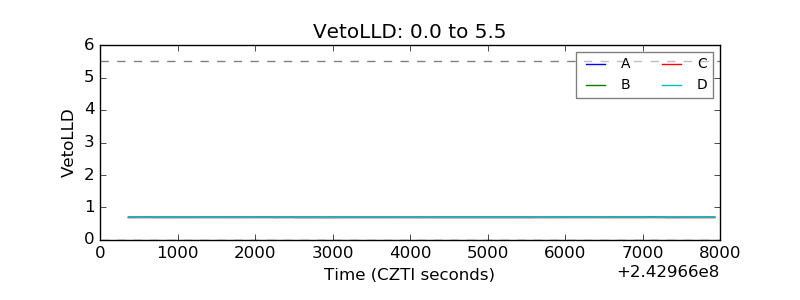 |
| Alpha Counter | 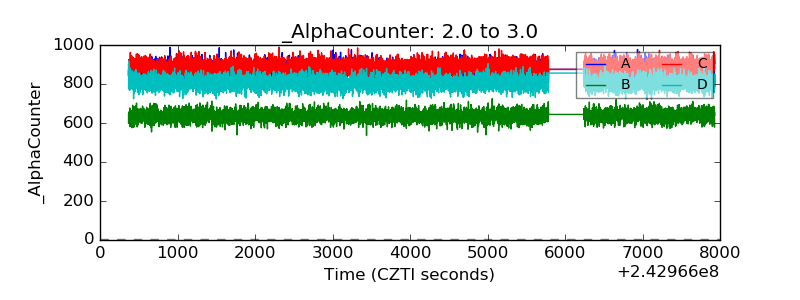 |
| _CPM_Rate | 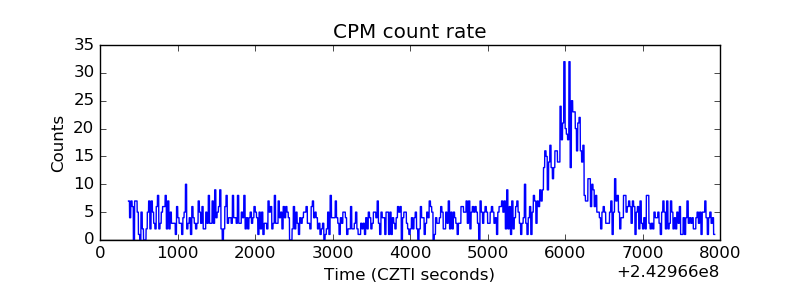 |
| CZT Counter | 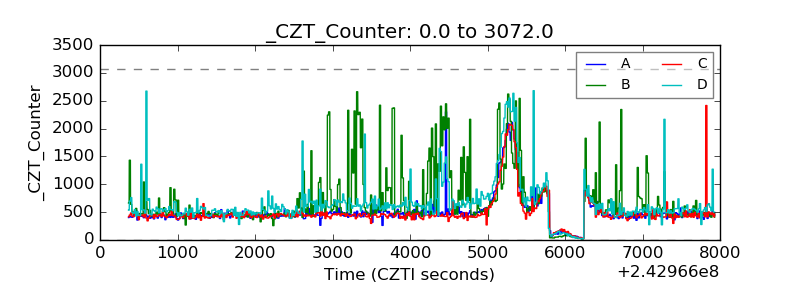 |
| +2.5 Volts monitor |  |
| +5 Volts monitor |  |
| _ROLL_ROT | 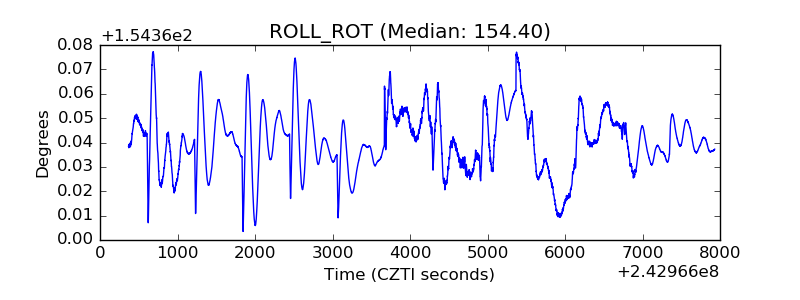 |
| _Roll_DEC | 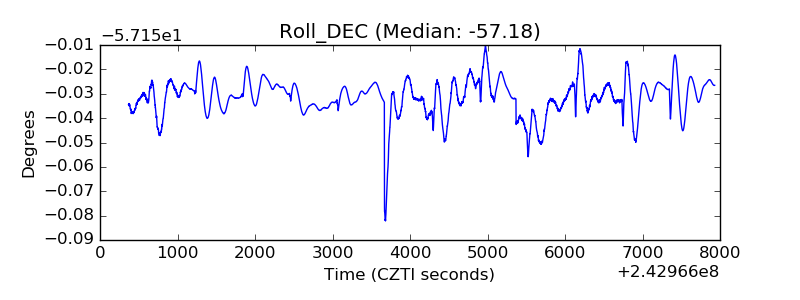 |
| _Roll_RA | 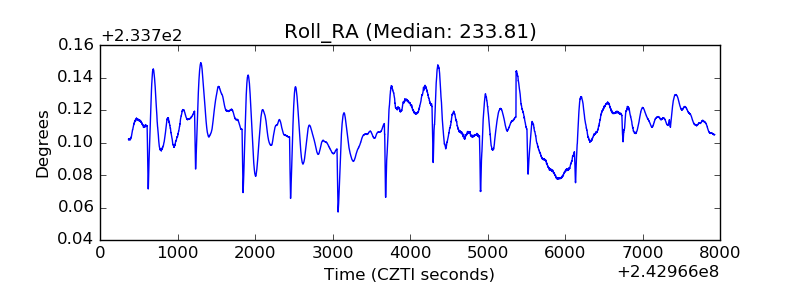 |
| Veto Counter | 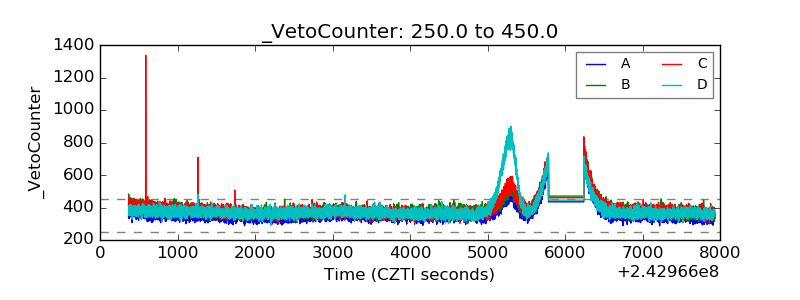 |