| Param | Original file | Final file |
|---|---|---|
| Filename | modeM0/AS1T01_191T01_9000001536_10599cztM0_level2.evt | modeM0/AS1T01_191T01_9000001536_10599cztM0_level2_quad_clean.evt |
| Size (bytes) | 637,968,960 | 102,153,600 |
| Size | 608.4 MB | 97.4 MB |
| Events in quadrant A | 3,525,667 | 669,925 |
| Events in quadrant B | 5,232,446 | 643,570 |
| Events in quadrant C | 3,418,345 | 672,101 |
| Events in quadrant D | 6,654,830 | 604,755 |
| Mode SS | |||
|---|---|---|---|
| Quadrant | BADHDUFLAG | Total packets | Discarded packets |
| A | 0 | 146 | 0 |
| B | 0 | 146 | 0 |
| C | 0 | 146 | 0 |
| D | 0 | 146 | 0 |
| Mode M0 | |||
|---|---|---|---|
| Quadrant | BADHDUFLAG | Total packets | Discarded packets |
| A | 0 | 15175 | 1 |
| B | 0 | 20195 | 0 |
| C | 0 | 15066 | 0 |
| D | 0 | 24626 | 0 |
| Quadrant | Total seconds | Saturated seconds | Saturation percentage |
|---|---|---|---|
| A | 7218 | 190 | 2.632308% |
| B | 7218 | 728 | 10.085896% |
| C | 7218 | 153 | 2.119701% |
| D | 7218 | 900 | 12.468828% |
Noise dominated data is calculated using 1-second bins in cleaned event files. If a bin has >2000 counts, and if more than 50% of those come from <1% of pixels, then it is considered to be noise-dominated and hence unusable.
| Quadrant | # 1 sec bins | Bins with >0 counts | Bins with >2000 counts | High rate bins dominated by noise | Noise dominated (total time) | Noise dominated (detector-on time) | Marked lightcurve |
|---|---|---|---|---|---|---|---|
| A | 7218 | 7218 | 0 | 0 | 0.00% | 0.00% | 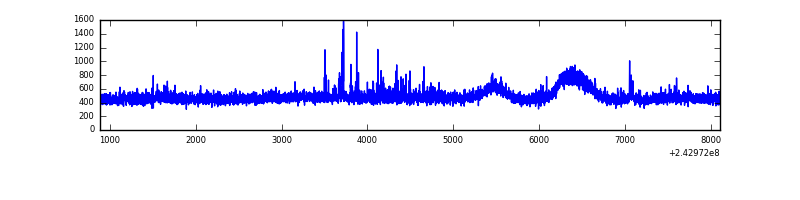 |
| B | 7218 | 7218 | 353 | 353 | 4.89% | 4.89% | 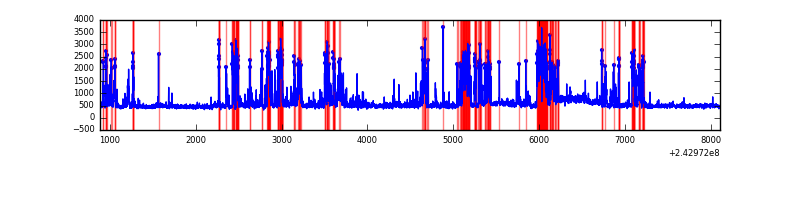 |
| C | 7218 | 7218 | 11 | 11 | 0.15% | 0.15% | 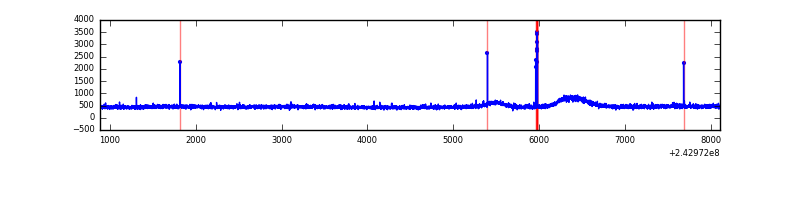 |
| D | 7218 | 7218 | 670 | 670 | 9.28% | 9.28% | 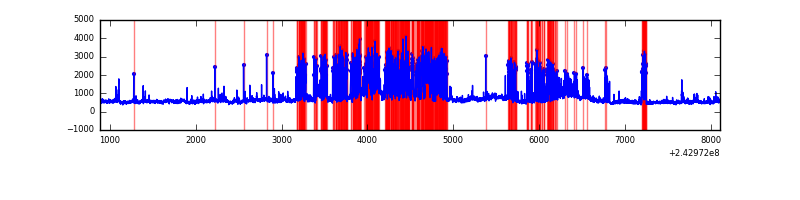 |
Top three noisy pixels from each quadrant. If the there are fewer than three noisy pixels in the level2.evt file, extra rows are filled as -1
| Pixel properties | Quadrant properties | ||||||
|---|---|---|---|---|---|---|---|
| Quadrant | DetID | PixID | Counts | Sigma | Mean | Median | Sigma |
| A | 1 | 162 | 39672 | 210.05 | 884 | 868 | 184.7 |
| A | 13 | 251 | 24988 | 130.56 | 884 | 868 | 184.7 |
| A | 14 | 254 | 21057 | 109.28 | 884 | 868 | 184.7 |
| B | 4 | 239 | 1704926 | 10321.93 | 859 | 839 | 165.1 |
| B | 0 | 219 | 54227 | 323.38 | 859 | 839 | 165.1 |
| B | 11 | 51 | 42440 | 251.98 | 859 | 839 | 165.1 |
| C | 14 | 234 | 32356 | 156.1 | 865 | 871 | 201.7 |
| C | 1 | 0 | 8521 | 37.93 | 865 | 871 | 201.7 |
| C | 13 | 61 | 6583 | 28.32 | 865 | 871 | 201.7 |
| D | 2 | 16 | 2102679 | 10398.88 | 826 | 804 | 202.1 |
| D | 10 | 199 | 652328 | 3223.37 | 826 | 804 | 202.1 |
| D | 8 | 195 | 422622 | 2086.91 | 826 | 804 | 202.1 |
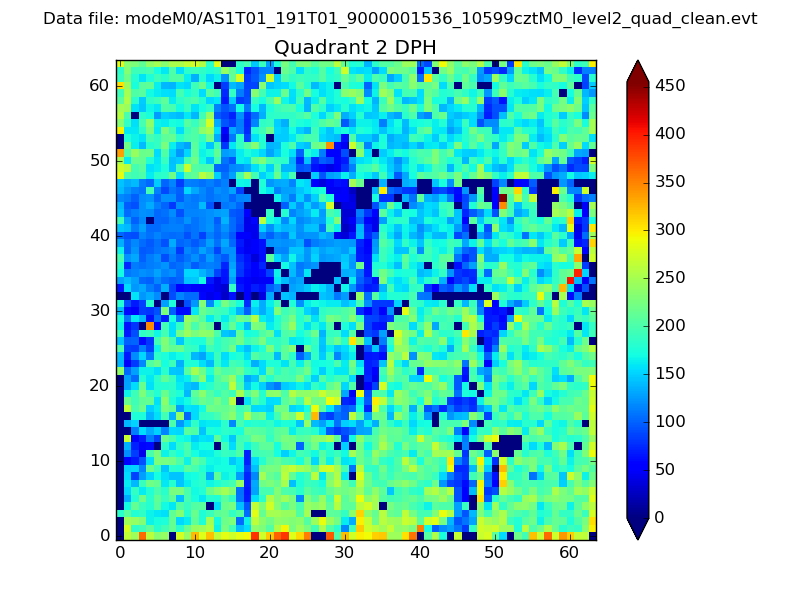
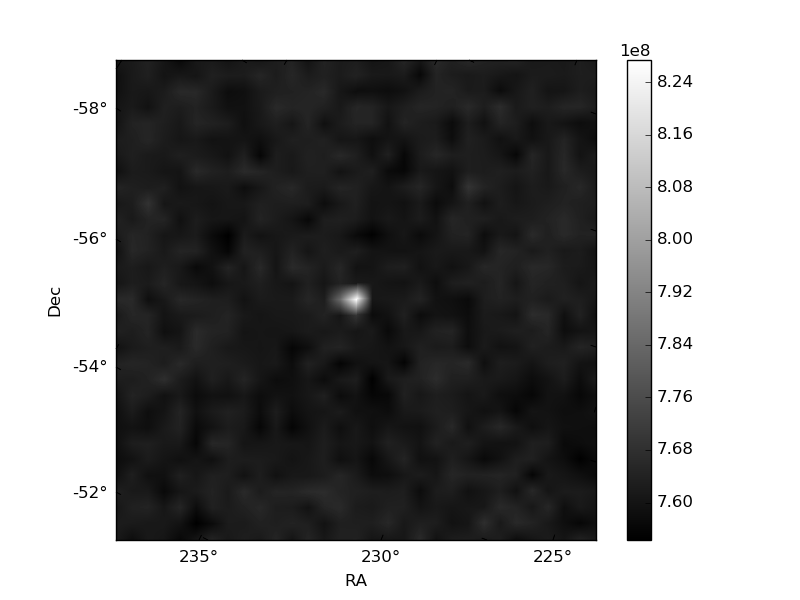
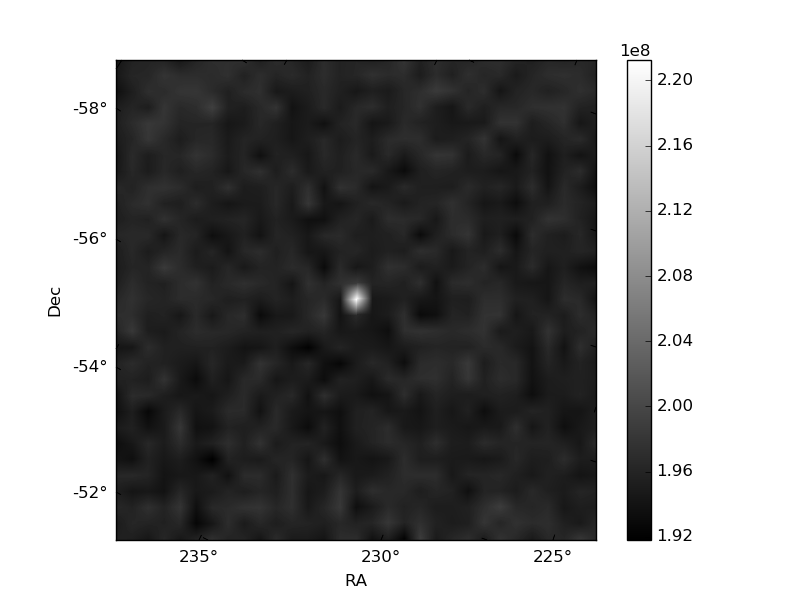
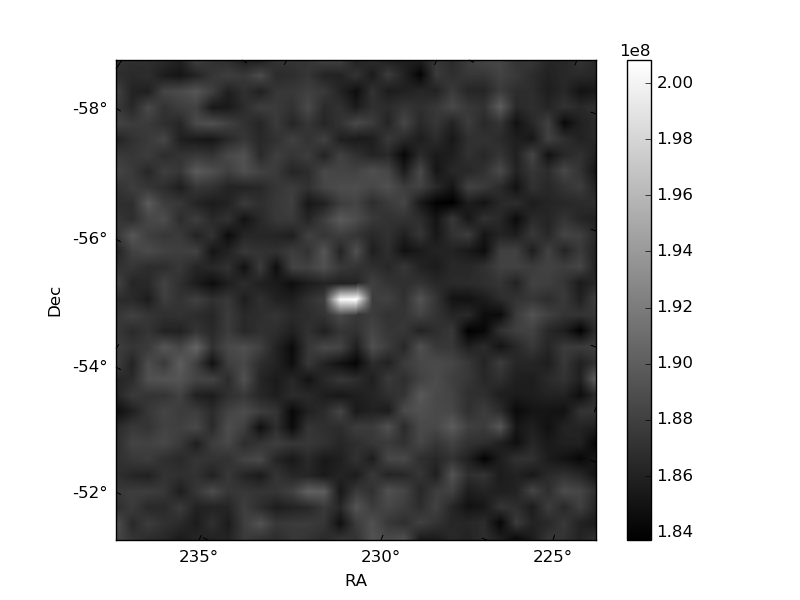
Histogram calculated using DETX and DETY for each event in the final _common_clean file
| Quadrant A | 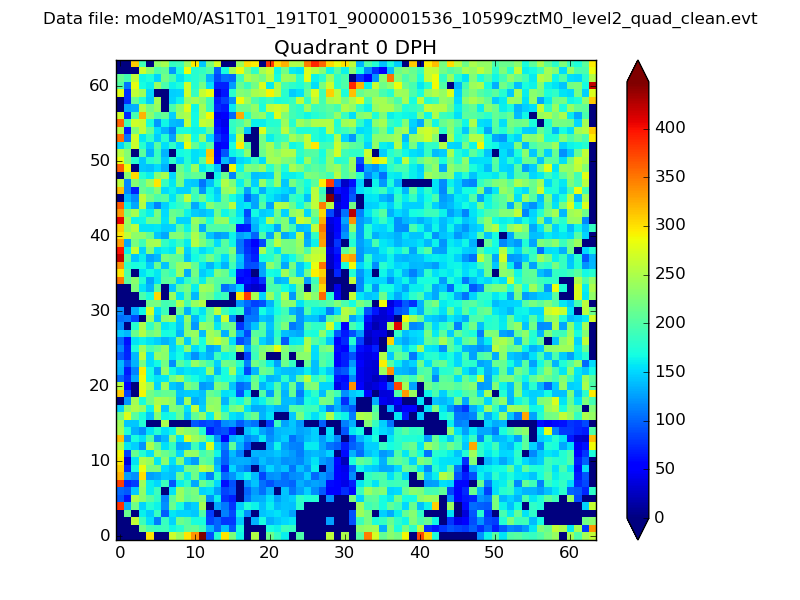 |
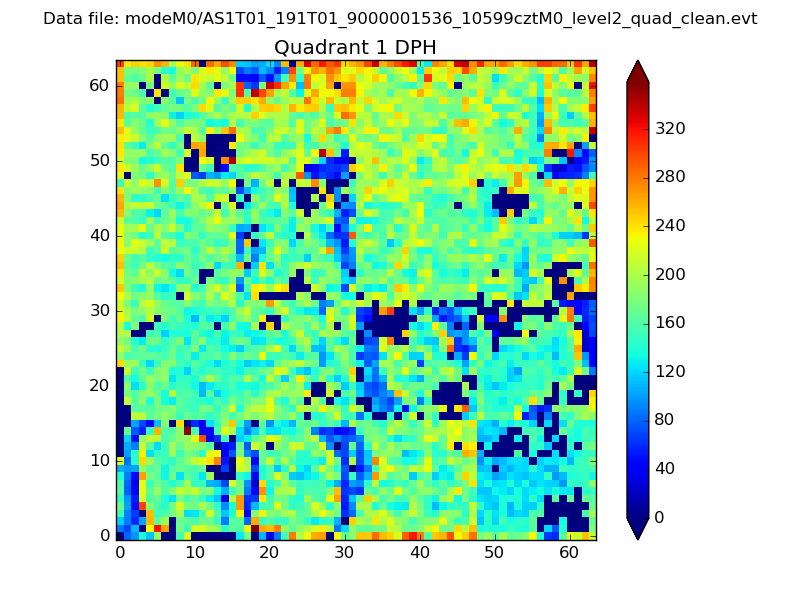 |
Quadrant B |
|---|---|---|---|
| Quadrant D | 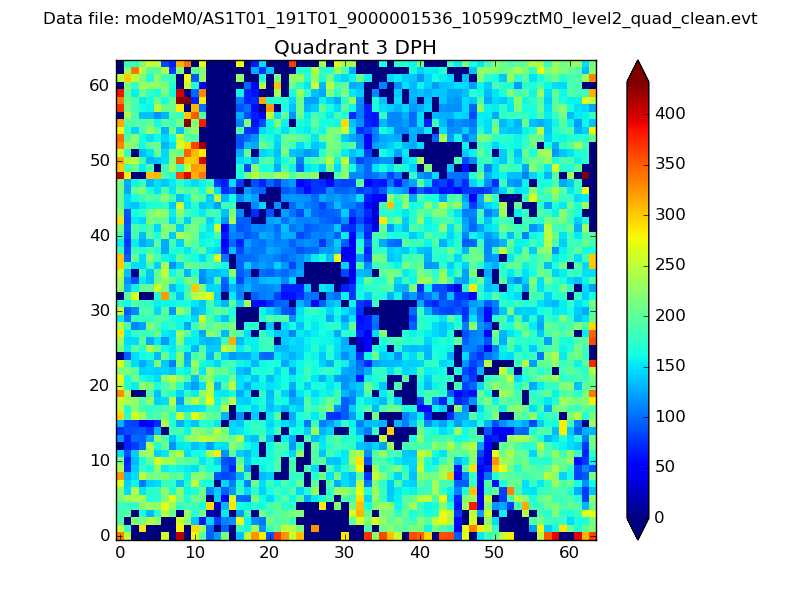 |
 |
Quadrant C |
| Plot type | Count rate plots | Images |
|---|---|---|
| Comparison with Poisson distribution Blue bars denote a histogram of data divided into 1 sec bins. Red curve is a Poisson curve with rate = median count rate of data. |
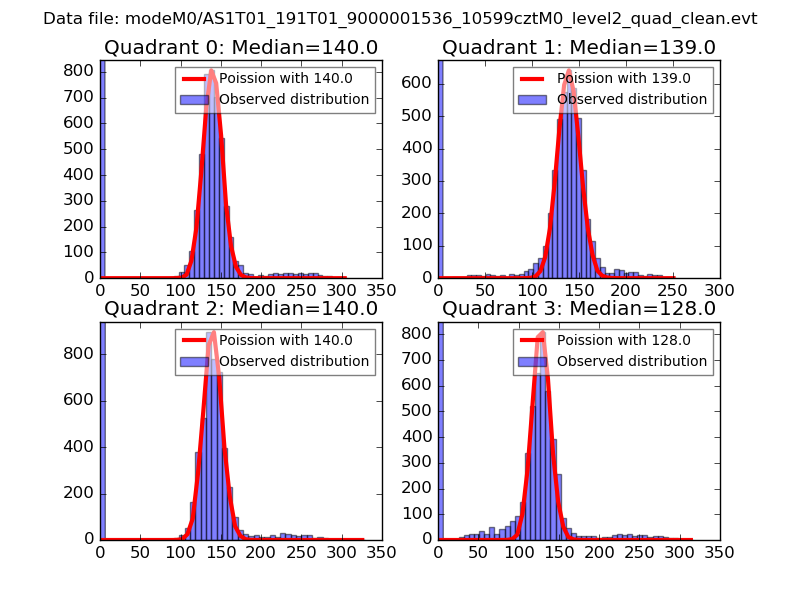 |
 |
| Quadrant-wise count rates Data is divided into 100 sec bins |
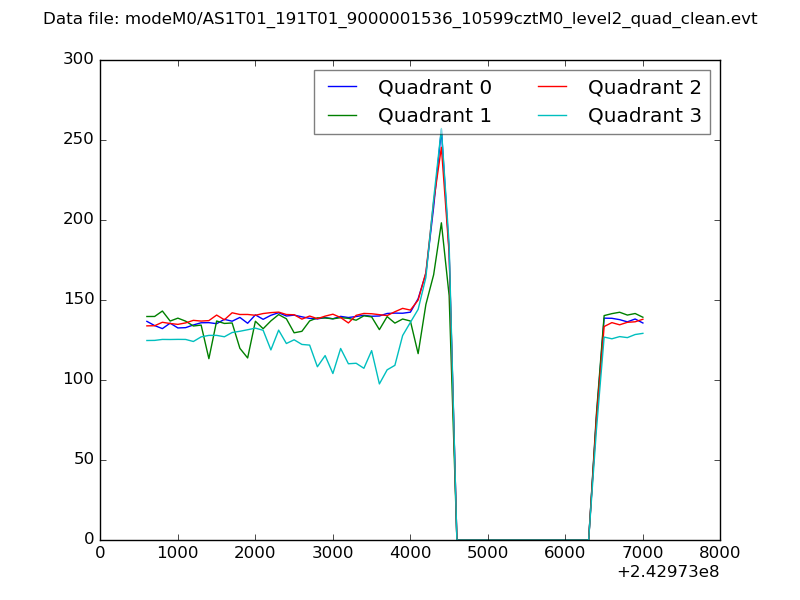 |
|
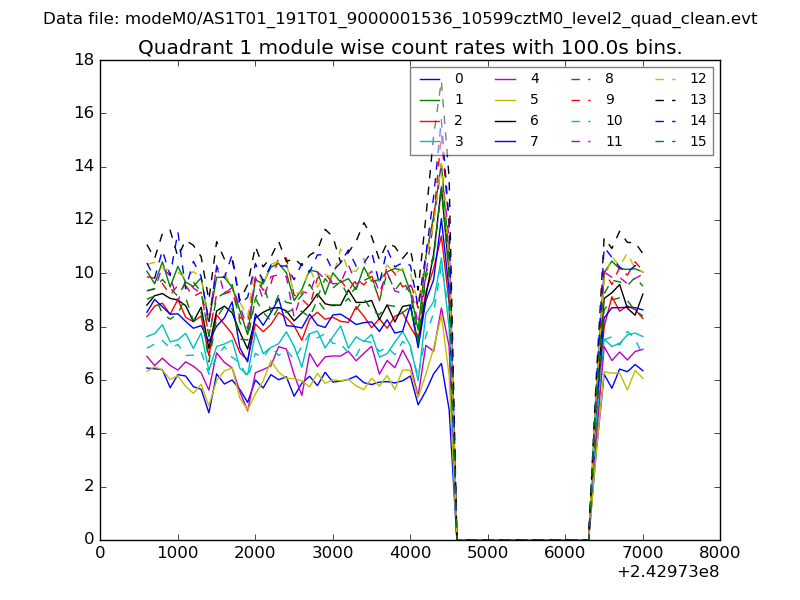
| Module-wise count rates for Quadrant A Data is divided into 100 sec bins |
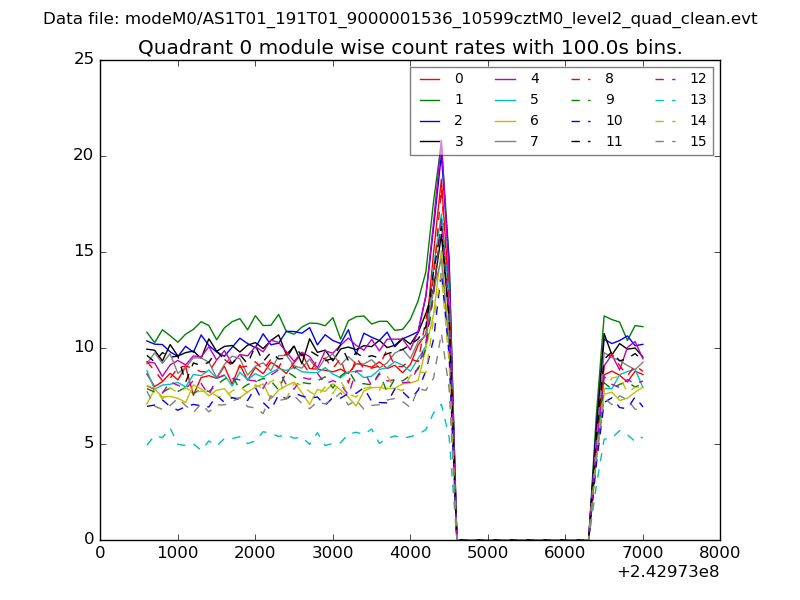 |
 |
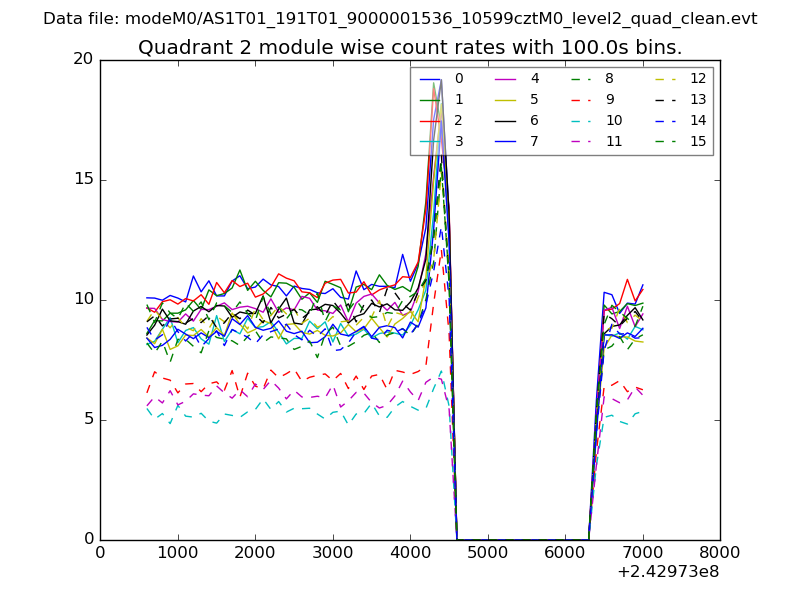
| Module-wise count rates for Quadrant B Data is divided into 100 sec bins |
 |
 |
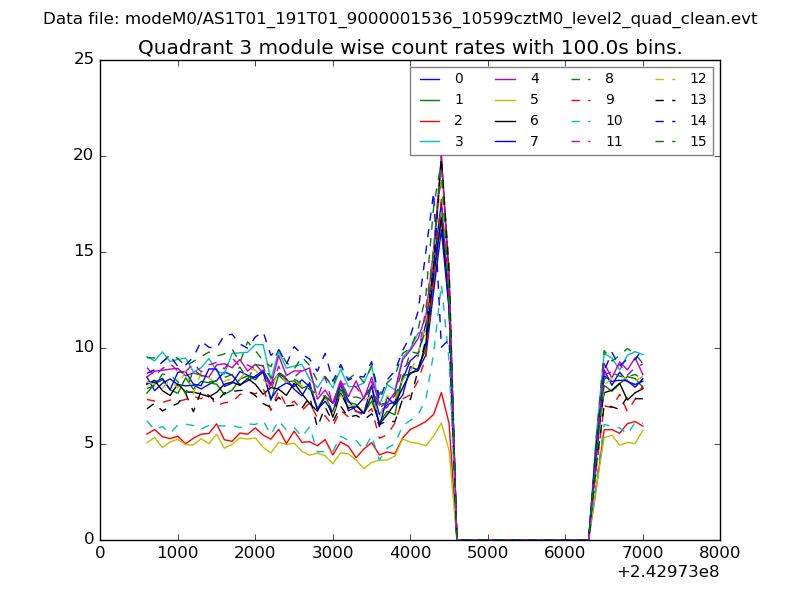
| Module-wise count rates for Quadrant C Data is divided into 100 sec bins |
 |
 |
| Module-wise count rates for Quadrant D Data is divided into 100 sec bins |
 |
 |
| Parameter | Plot |
|---|---|
| CZT HV Monitor |  |
| D_VDD | 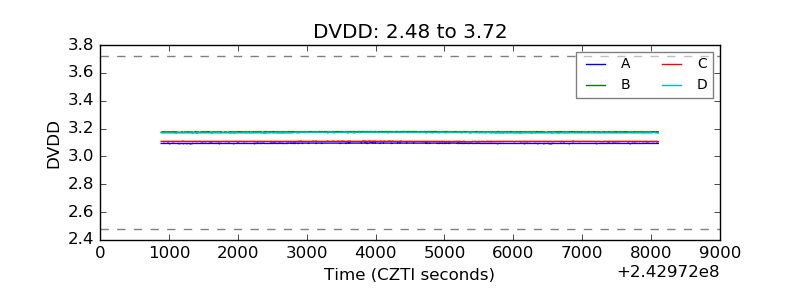 |
| Temperature 1 | 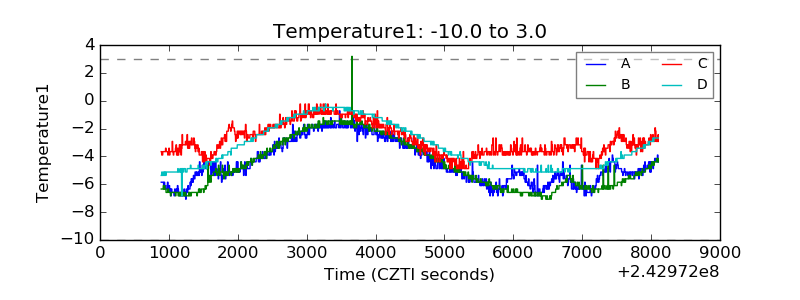 |
| Veto HV Monitor | 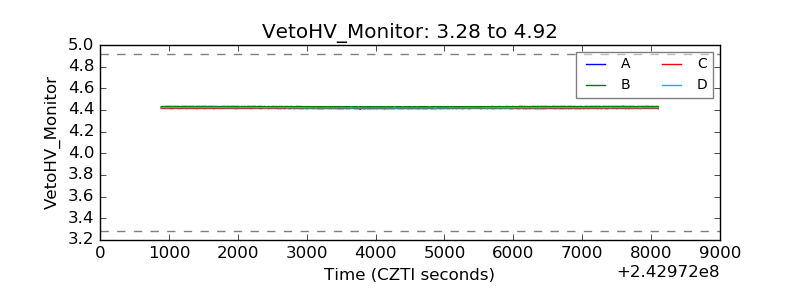 |
| Veto LLD |  |
| Alpha Counter | 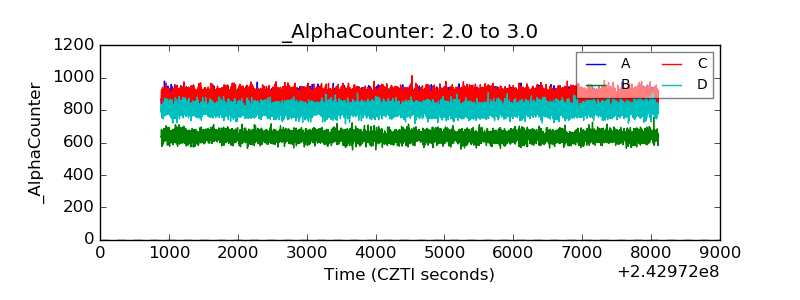 |
| _CPM_Rate | 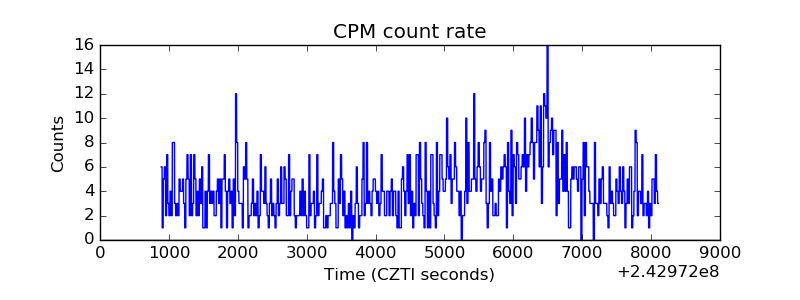 |
| CZT Counter | 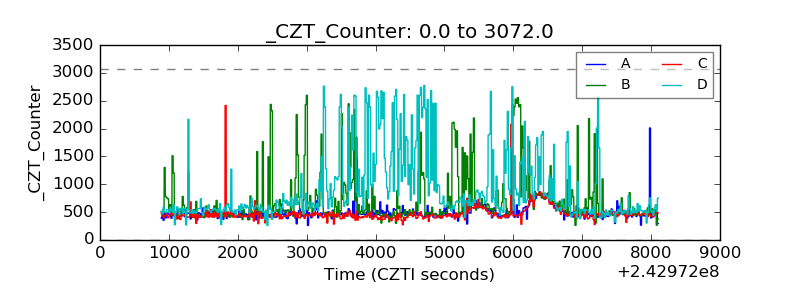 |
| +2.5 Volts monitor |  |
| +5 Volts monitor |  |
| _ROLL_ROT |  |
| _Roll_DEC | 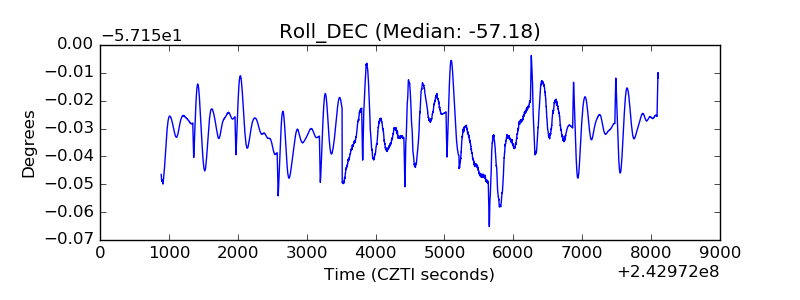 |
| _Roll_RA | 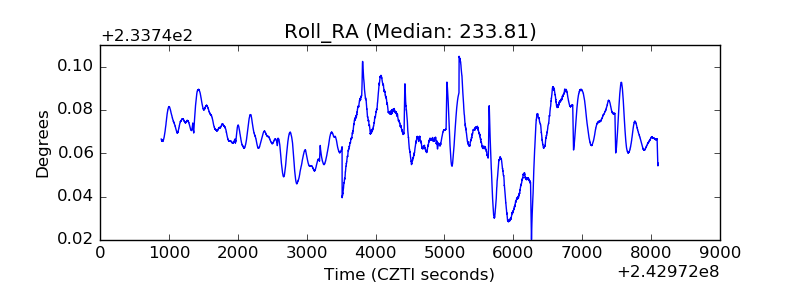 |
| Veto Counter |  |