| Param | Original file | Final file |
|---|---|---|
| Filename | modeM0/AS1T01_191T01_9000001536_10600cztM0_level2.evt | modeM0/AS1T01_191T01_9000001536_10600cztM0_level2_quad_clean.evt |
| Size (bytes) | 574,634,880 | 107,841,600 |
| Size | 548.0 MB | 102.8 MB |
| Events in quadrant A | 3,481,519 | 705,948 |
| Events in quadrant B | 5,058,514 | 688,914 |
| Events in quadrant C | 3,389,907 | 709,075 |
| Events in quadrant D | 4,983,013 | 659,210 |
| Mode SS | |||
|---|---|---|---|
| Quadrant | BADHDUFLAG | Total packets | Discarded packets |
| A | 0 | 144 | 0 |
| B | 0 | 144 | 0 |
| C | 0 | 144 | 0 |
| D | 0 | 144 | 0 |
| Mode M0 | |||
|---|---|---|---|
| Quadrant | BADHDUFLAG | Total packets | Discarded packets |
| A | 0 | 15056 | 1 |
| B | 0 | 19609 | 0 |
| C | 0 | 14872 | 0 |
| D | 0 | 19623 | 0 |
| Quadrant | Total seconds | Saturated seconds | Saturation percentage |
|---|---|---|---|
| A | 7224 | 247 | 3.419158% |
| B | 7224 | 649 | 8.983942% |
| C | 7224 | 178 | 2.464009% |
| D | 7224 | 288 | 3.986711% |
Noise dominated data is calculated using 1-second bins in cleaned event files. If a bin has >2000 counts, and if more than 50% of those come from <1% of pixels, then it is considered to be noise-dominated and hence unusable.
| Quadrant | # 1 sec bins | Bins with >0 counts | Bins with >2000 counts | High rate bins dominated by noise | Noise dominated (total time) | Noise dominated (detector-on time) | Marked lightcurve |
|---|---|---|---|---|---|---|---|
| A | 7224 | 7224 | 2 | 2 | 0.03% | 0.03% | 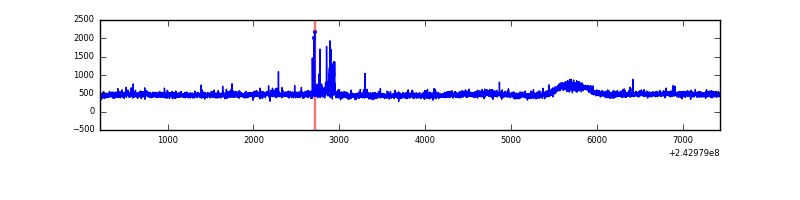 |
| B | 7224 | 7224 | 279 | 279 | 3.86% | 3.86% | 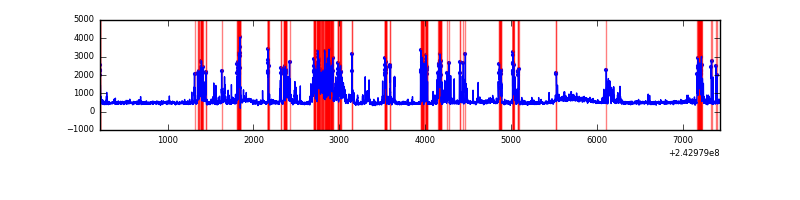 |
| C | 7224 | 7224 | 2 | 2 | 0.03% | 0.03% | 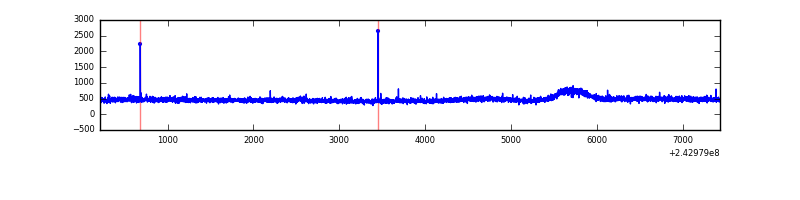 |
| D | 7224 | 7224 | 97 | 97 | 1.34% | 1.34% | 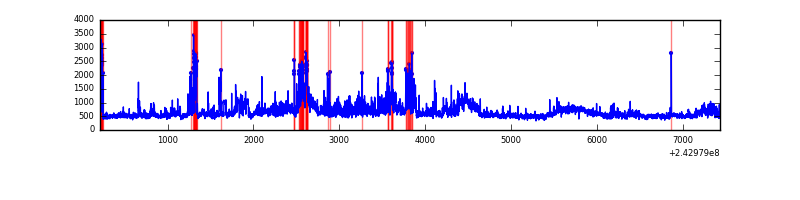 |
Top three noisy pixels from each quadrant. If the there are fewer than three noisy pixels in the level2.evt file, extra rows are filled as -1
| Pixel properties | Quadrant properties | ||||||
|---|---|---|---|---|---|---|---|
| Quadrant | DetID | PixID | Counts | Sigma | Mean | Median | Sigma |
| A | 13 | 251 | 55371 | 295.18 | 879 | 861 | 184.7 |
| A | 1 | 162 | 19604 | 101.5 | 879 | 861 | 184.7 |
| A | 0 | 226 | 7852 | 37.86 | 879 | 861 | 184.7 |
| B | 4 | 239 | 1547545 | 9159.58 | 865 | 846 | 168.9 |
| B | 0 | 219 | 68763 | 402.21 | 865 | 846 | 168.9 |
| B | 0 | 214 | 36992 | 214.06 | 865 | 846 | 168.9 |
| C | 14 | 225 | 10286 | 47.0 | 861 | 869 | 200.3 |
| C | 14 | 234 | 9367 | 42.42 | 861 | 869 | 200.3 |
| C | 13 | 61 | 6535 | 28.28 | 861 | 869 | 200.3 |
| D | 2 | 16 | 677844 | 3249.56 | 850 | 827 | 208.3 |
| D | 1 | 52 | 348075 | 1666.73 | 850 | 827 | 208.3 |
| D | 8 | 195 | 301510 | 1443.22 | 850 | 827 | 208.3 |
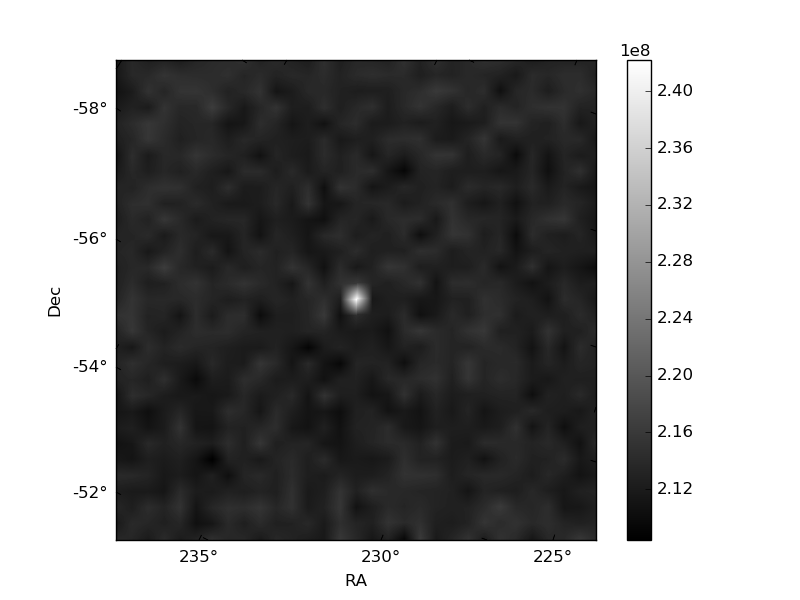
Histogram calculated using DETX and DETY for each event in the final _common_clean file
| Quadrant A | 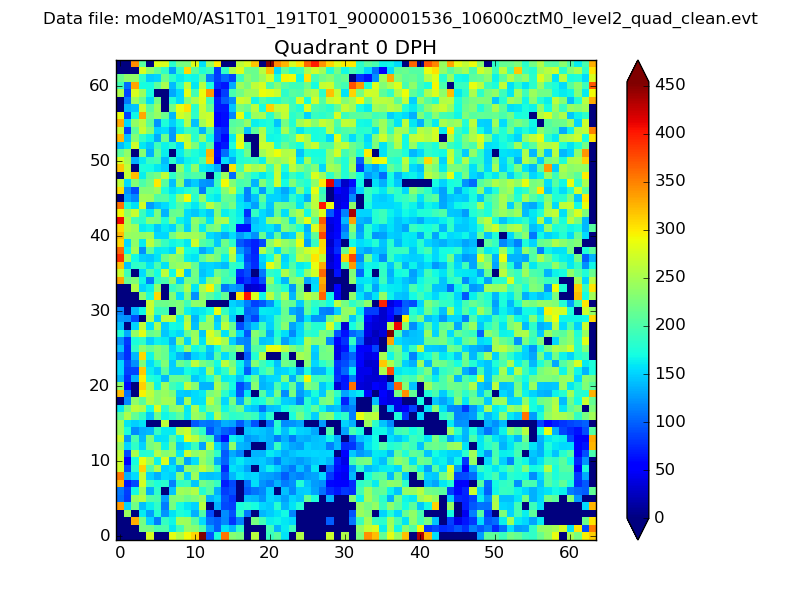 |
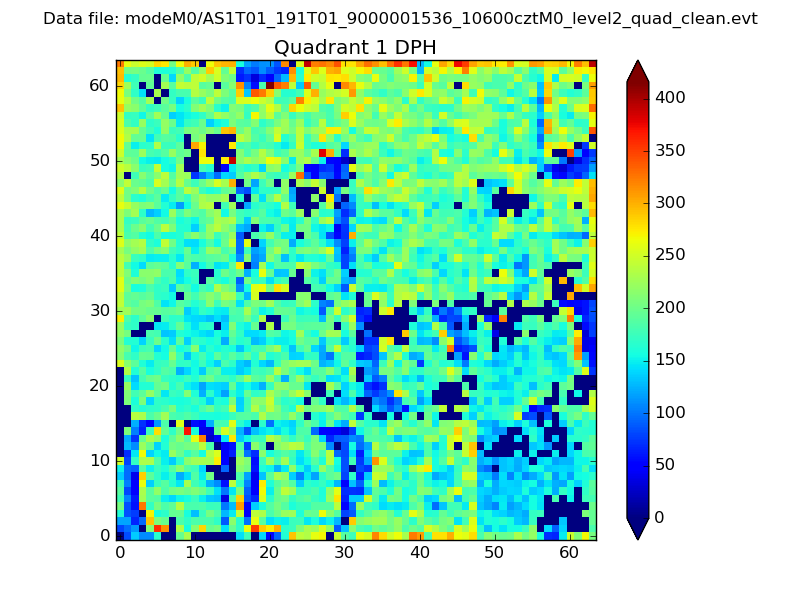 |
Quadrant B |
|---|---|---|---|
| Quadrant D | 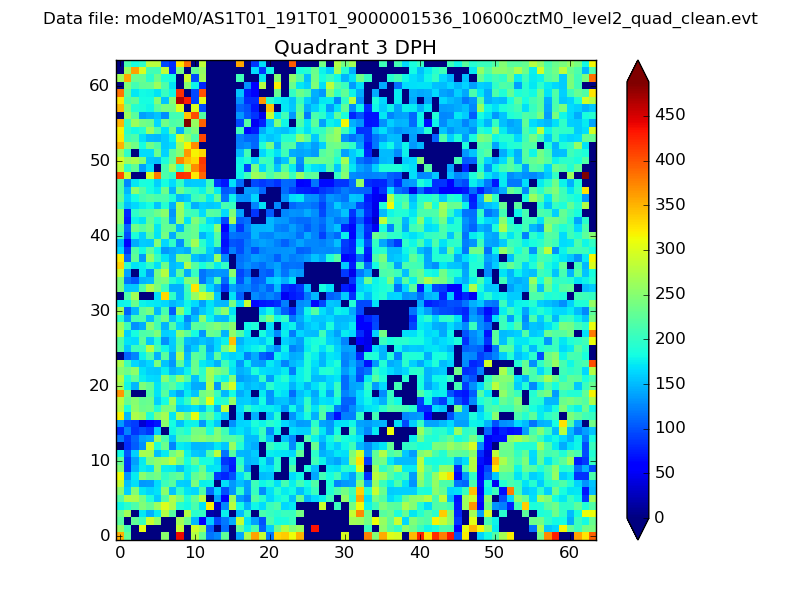 |
 |
Quadrant C |
| Plot type | Count rate plots | Images |
|---|---|---|
| Comparison with Poisson distribution Blue bars denote a histogram of data divided into 1 sec bins. Red curve is a Poisson curve with rate = median count rate of data. |
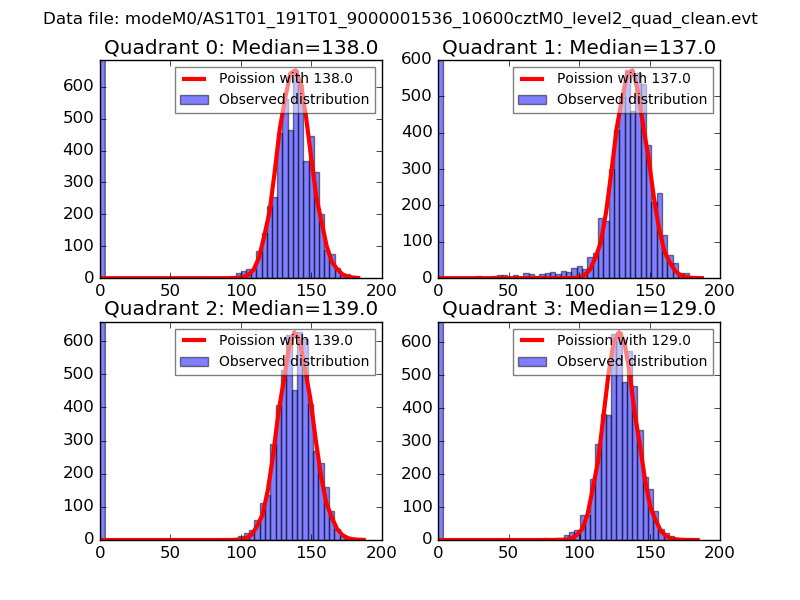 |
 |
| Quadrant-wise count rates Data is divided into 100 sec bins |
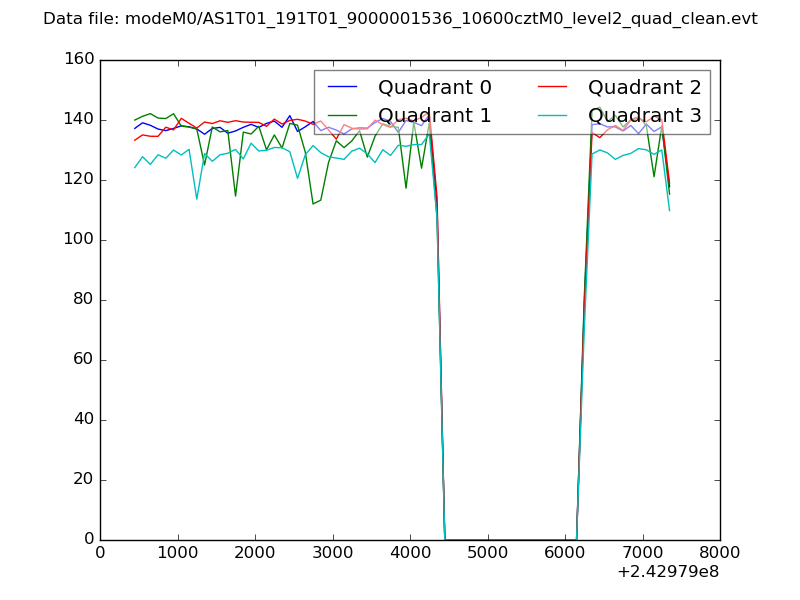 |
|
| Module-wise count rates for Quadrant A Data is divided into 100 sec bins |
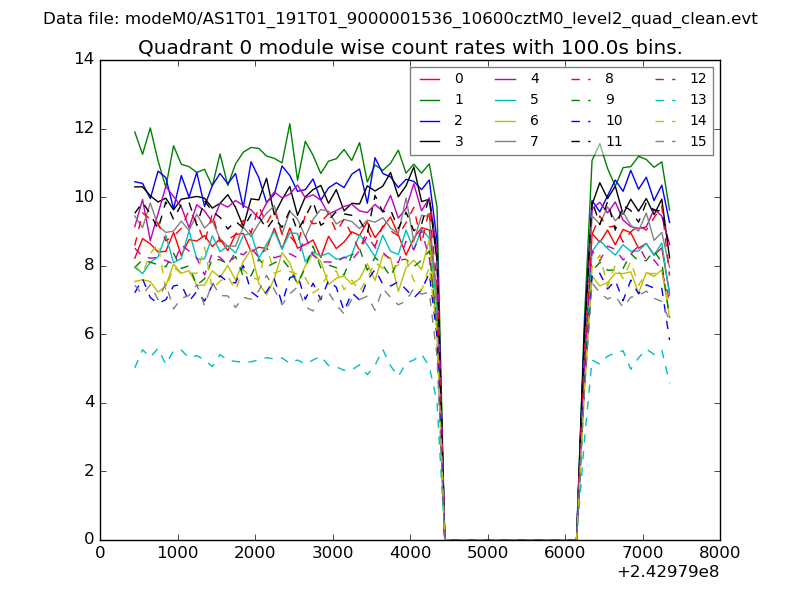 |
 |
| Module-wise count rates for Quadrant B Data is divided into 100 sec bins |
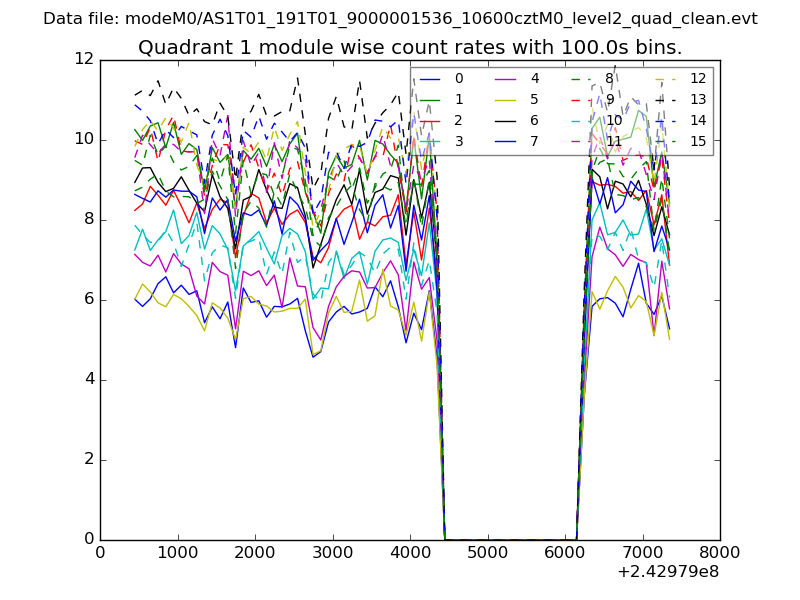 |
 |
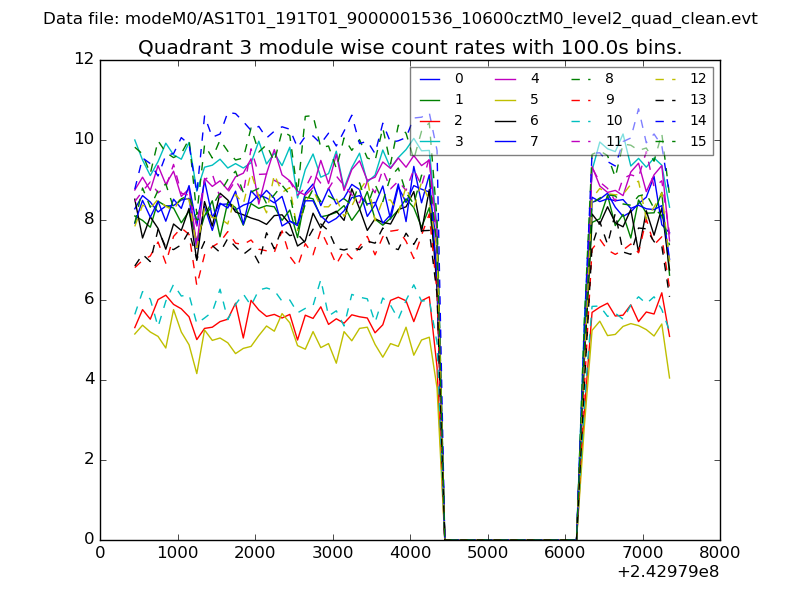
| Module-wise count rates for Quadrant C Data is divided into 100 sec bins |
 |
 |
| Module-wise count rates for Quadrant D Data is divided into 100 sec bins |
 |
 |
| Parameter | Plot |
|---|---|
| CZT HV Monitor | 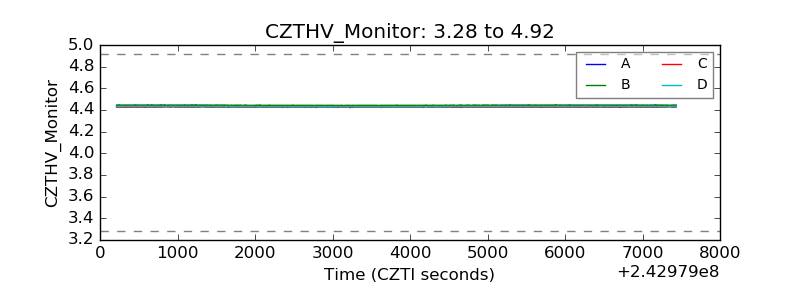 |
| D_VDD | 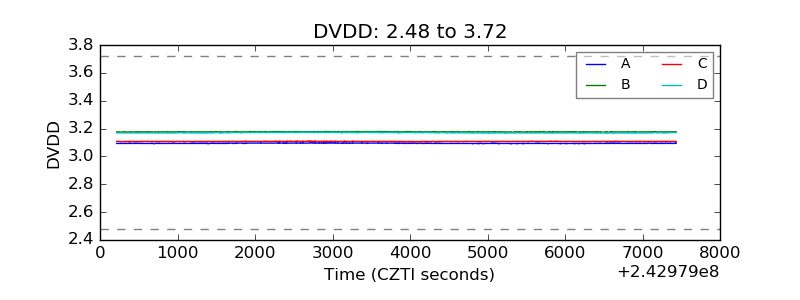 |
| Temperature 1 | 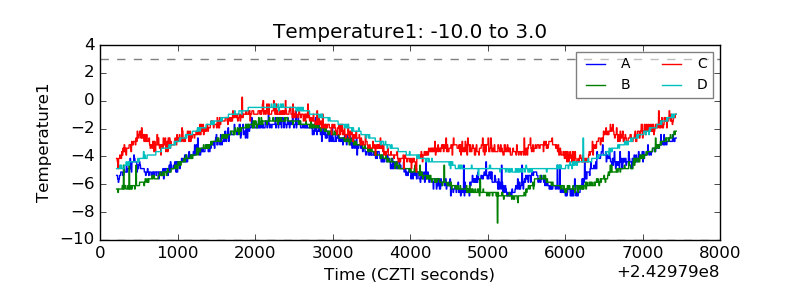 |
| Veto HV Monitor | 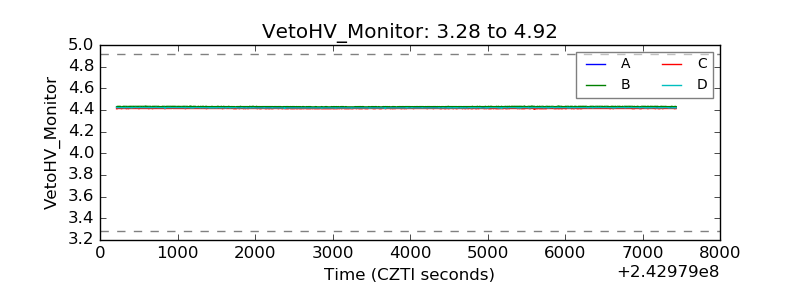 |
| Veto LLD | 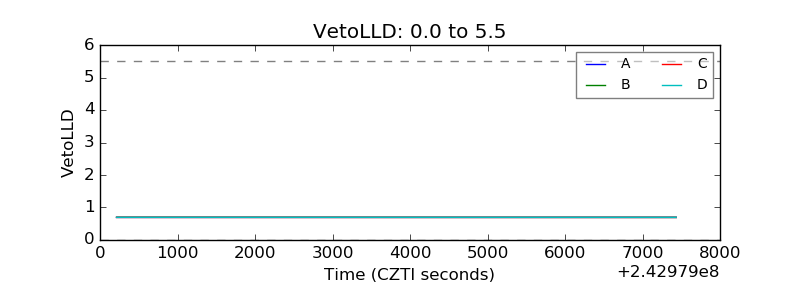 |
| Alpha Counter |  |
| _CPM_Rate | 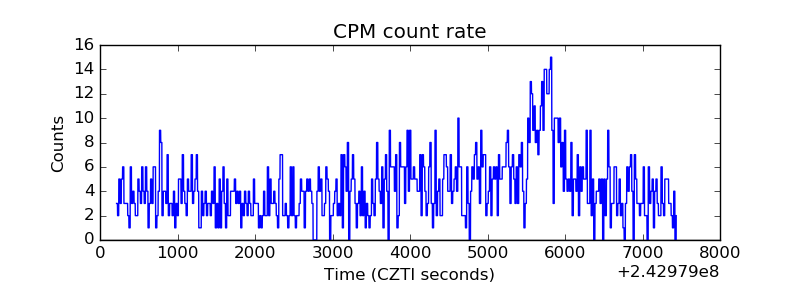 |
| CZT Counter | 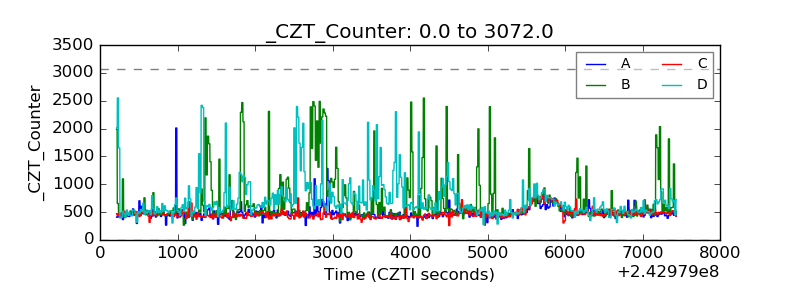 |
| +2.5 Volts monitor |  |
| +5 Volts monitor |  |
| _ROLL_ROT | 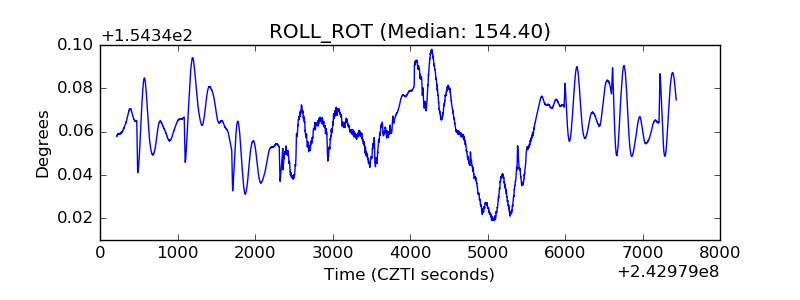 |
| _Roll_DEC | 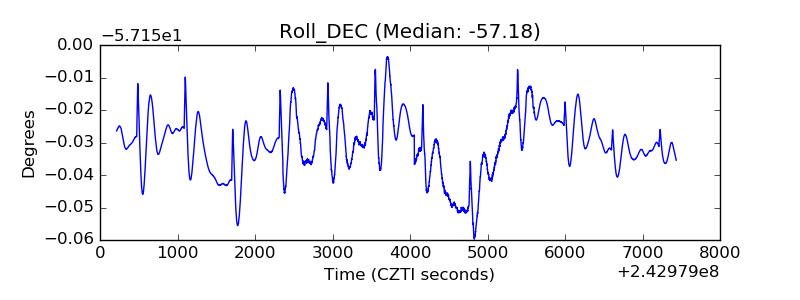 |
| _Roll_RA | 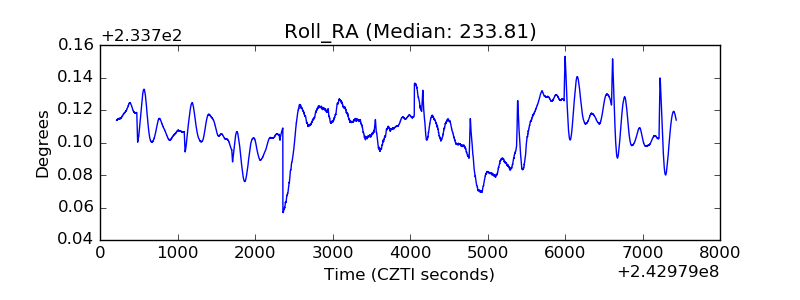 |
| Veto Counter | 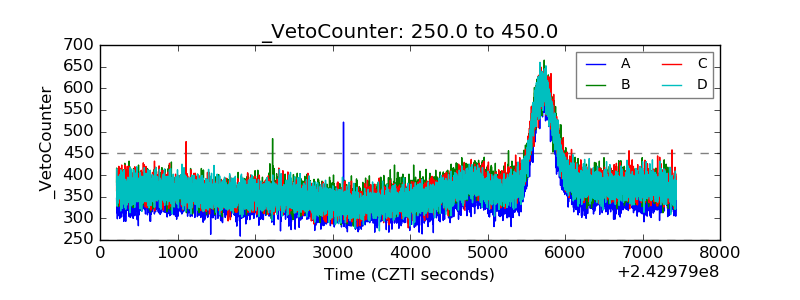 |