| Param | Original file | Final file |
|---|---|---|
| Filename | modeM0/AS1T01_191T01_9000001536_10603cztM0_level2.evt | modeM0/AS1T01_191T01_9000001536_10603cztM0_level2_quad_clean.evt |
| Size (bytes) | 1,431,561,600 | 261,731,520 |
| Size | 1.3 GB | 249.6 MB |
| Events in quadrant A | 8,413,237 | 1,714,857 |
| Events in quadrant B | 12,984,522 | 1,658,610 |
| Events in quadrant C | 8,113,332 | 1,725,625 |
| Events in quadrant D | 12,649,953 | 1,608,447 |
| Mode SS | |||
|---|---|---|---|
| Quadrant | BADHDUFLAG | Total packets | Discarded packets |
| A | 0 | 360 | 0 |
| B | 0 | 360 | 0 |
| C | 0 | 360 | 0 |
| D | 0 | 360 | 0 |
| Mode M9 | |||
|---|---|---|---|
| Quadrant | BADHDUFLAG | Total packets | Discarded packets |
| A | 0 | 16 | 0 |
| B | 0 | 16 | 0 |
| C | 0 | 16 | 0 |
| D | 0 | 16 | 0 |
| Mode M0 | |||
|---|---|---|---|
| Quadrant | BADHDUFLAG | Total packets | Discarded packets |
| A | 0 | 36510 | 4 |
| B | 0 | 49905 | 3 |
| C | 0 | 36293 | 3 |
| D | 0 | 50327 | 3 |
| Quadrant | Total seconds | Saturated seconds | Saturation percentage |
|---|---|---|---|
| A | 17696 | 232 | 1.311031% |
| B | 17696 | 1401 | 7.917043% |
| C | 17696 | 145 | 0.819394% |
| D | 17696 | 419 | 2.367767% |
Noise dominated data is calculated using 1-second bins in cleaned event files. If a bin has >2000 counts, and if more than 50% of those come from <1% of pixels, then it is considered to be noise-dominated and hence unusable.
| Quadrant | # 1 sec bins | Bins with >0 counts | Bins with >2000 counts | High rate bins dominated by noise | Noise dominated (total time) | Noise dominated (detector-on time) | Marked lightcurve |
|---|---|---|---|---|---|---|---|
| A | 19366 | 17699 | 2 | 2 | 0.01% | 0.01% | 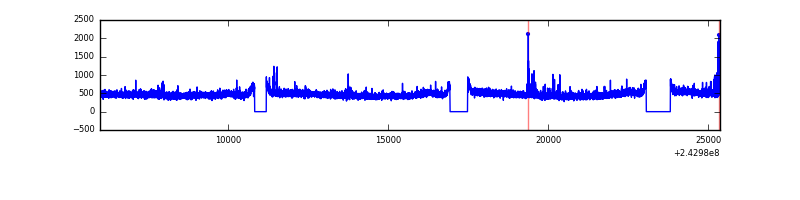 |
| B | 19366 | 17699 | 823 | 823 | 4.25% | 4.65% | 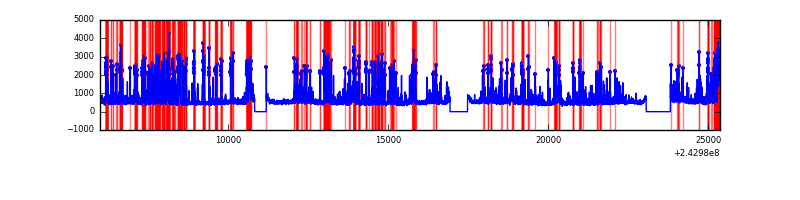 |
| C | 19366 | 17699 | 2 | 2 | 0.01% | 0.01% | 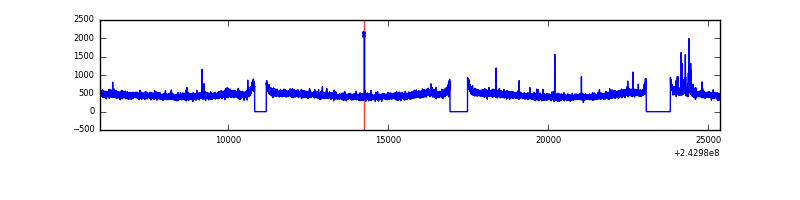 |
| D | 19366 | 17699 | 231 | 231 | 1.19% | 1.31% | 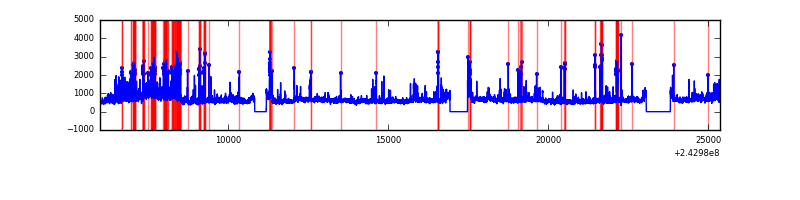 |
Top three noisy pixels from each quadrant. If the there are fewer than three noisy pixels in the level2.evt file, extra rows are filled as -1
| Pixel properties | Quadrant properties | ||||||
|---|---|---|---|---|---|---|---|
| Quadrant | DetID | PixID | Counts | Sigma | Mean | Median | Sigma |
| A | 1 | 162 | 86783 | 193.98 | 2119 | 2080 | 436.6 |
| A | 15 | 239 | 35787 | 77.19 | 2119 | 2080 | 436.6 |
| A | 1 | 178 | 32028 | 68.59 | 2119 | 2080 | 436.6 |
| B | 4 | 239 | 4364198 | 10976.77 | 2071 | 2026 | 397.4 |
| B | 0 | 214 | 126934 | 314.31 | 2071 | 2026 | 397.4 |
| B | 0 | 219 | 118501 | 293.09 | 2071 | 2026 | 397.4 |
| C | 15 | 48 | 68148 | 138.45 | 2049 | 2070 | 477.3 |
| C | 4 | 175 | 17766 | 32.89 | 2049 | 2070 | 477.3 |
| C | 13 | 61 | 15252 | 27.62 | 2049 | 2070 | 477.3 |
| D | 2 | 16 | 2384211 | 4840.01 | 2029 | 1976 | 492.2 |
| D | 8 | 195 | 1536522 | 3117.75 | 2029 | 1976 | 492.2 |
| D | 1 | 52 | 389033 | 786.39 | 2029 | 1976 | 492.2 |
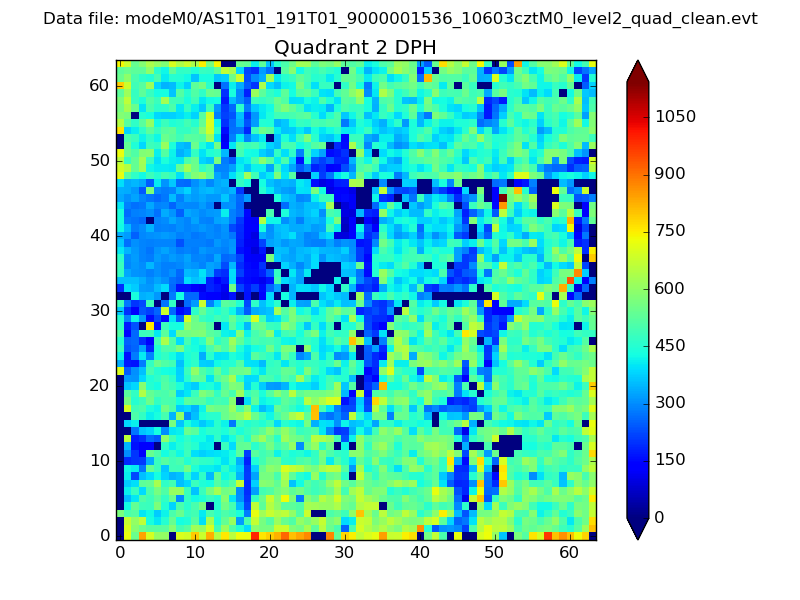
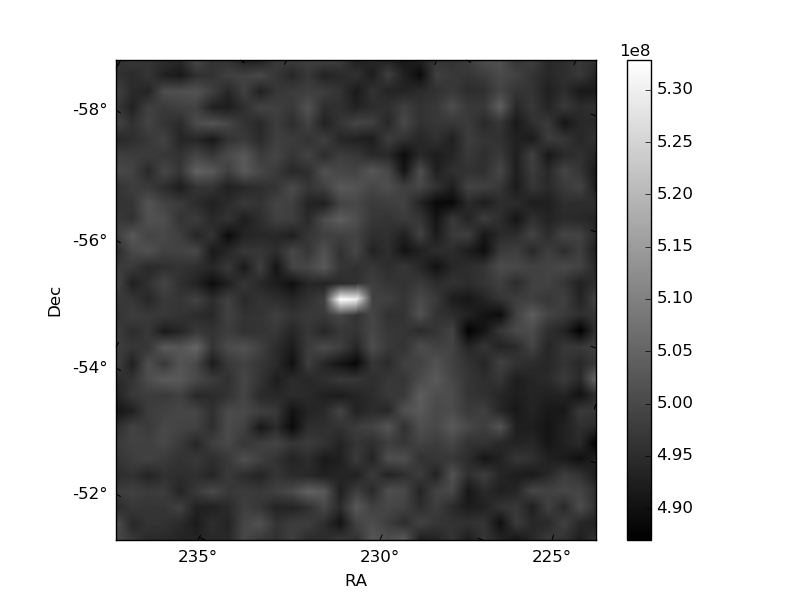
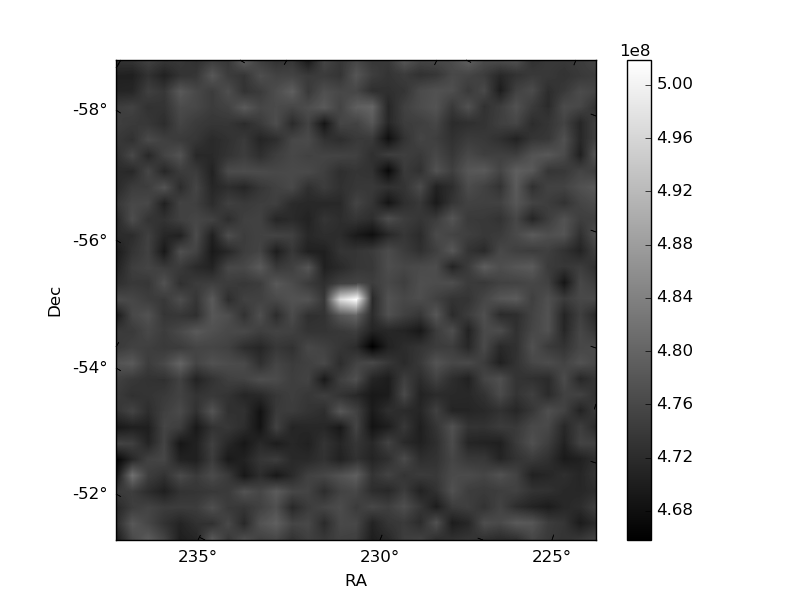
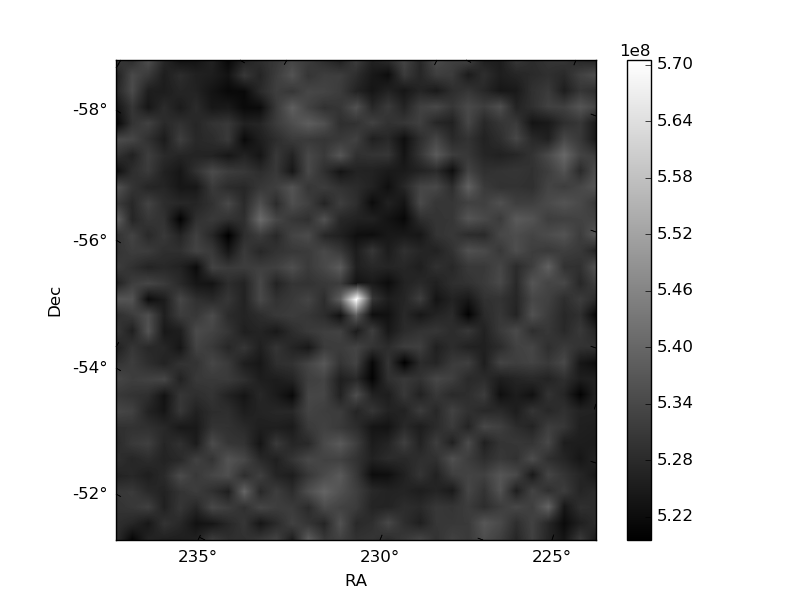
Histogram calculated using DETX and DETY for each event in the final _common_clean file
| Quadrant A |  |
 |
Quadrant B |
|---|---|---|---|
| Quadrant D | 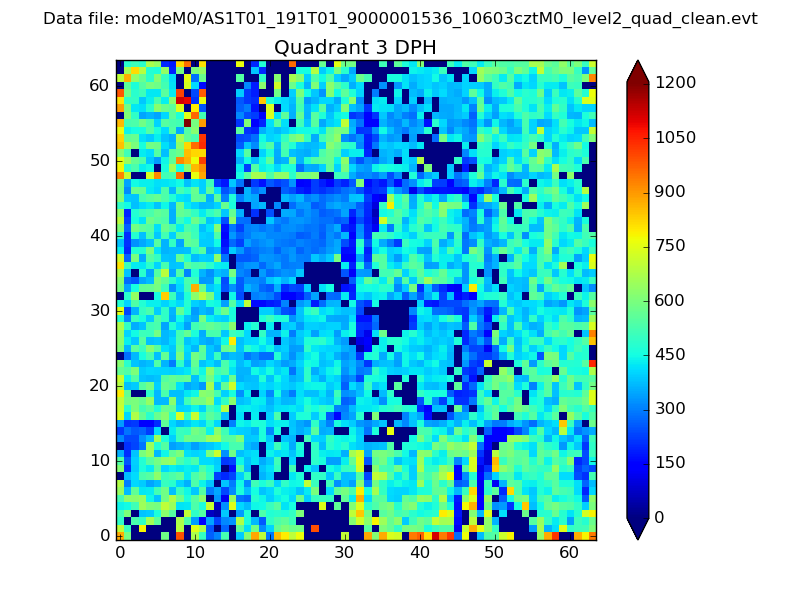 |
 |
Quadrant C |
| Plot type | Count rate plots | Images |
|---|---|---|
| Comparison with Poisson distribution Blue bars denote a histogram of data divided into 1 sec bins. Red curve is a Poisson curve with rate = median count rate of data. |
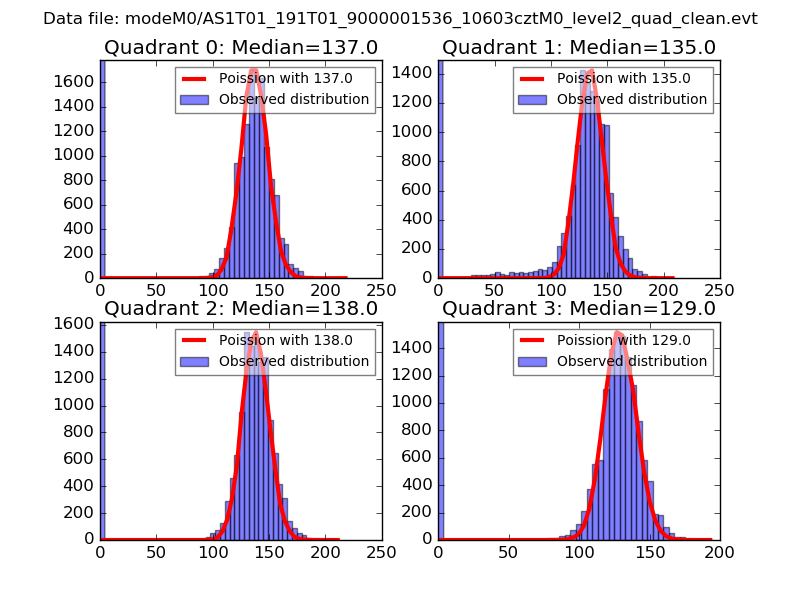 |
 |
| Quadrant-wise count rates Data is divided into 100 sec bins |
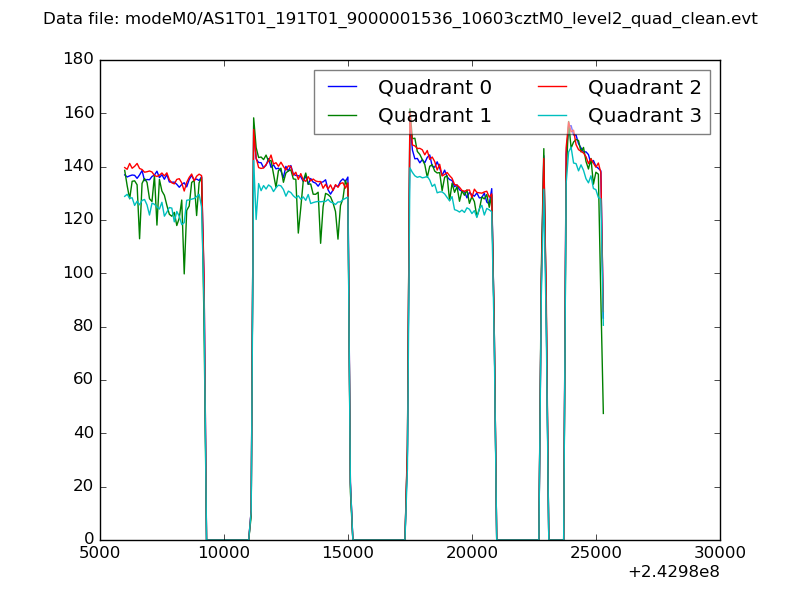 |
|
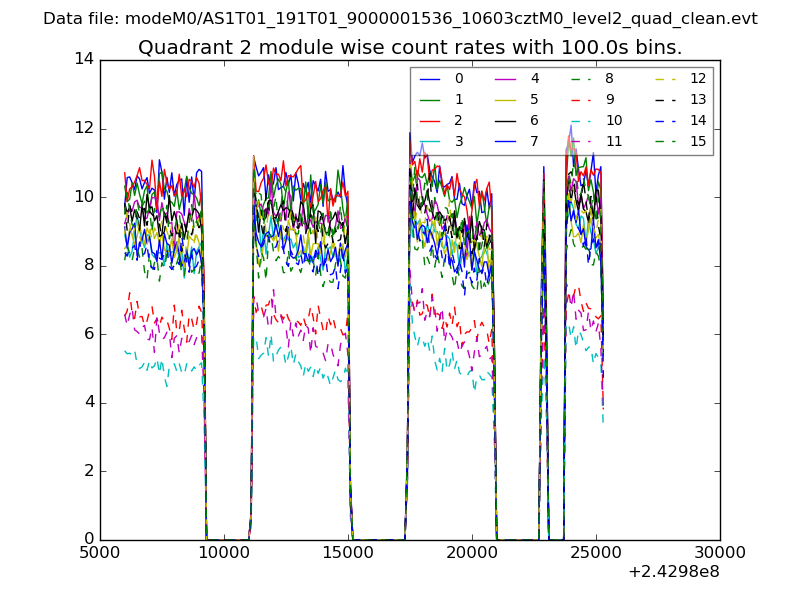
| Module-wise count rates for Quadrant A Data is divided into 100 sec bins |
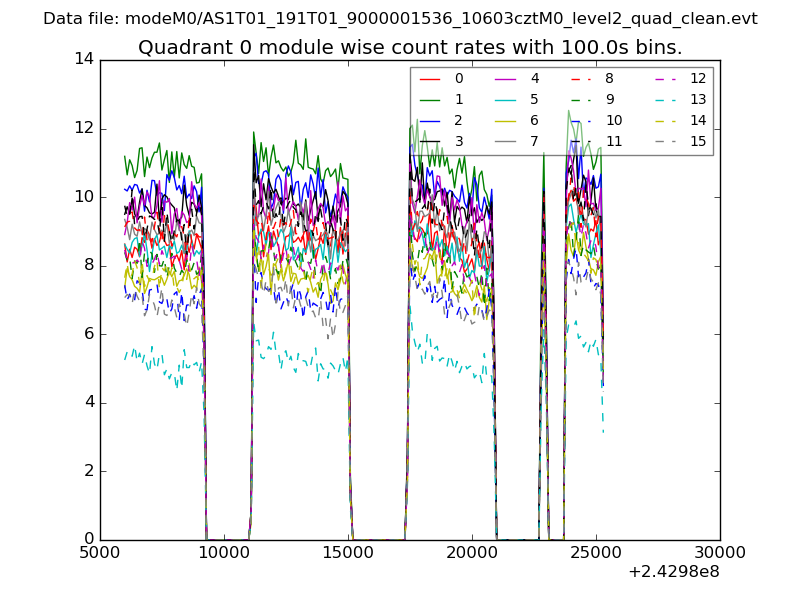 |
 |
| Module-wise count rates for Quadrant B Data is divided into 100 sec bins |
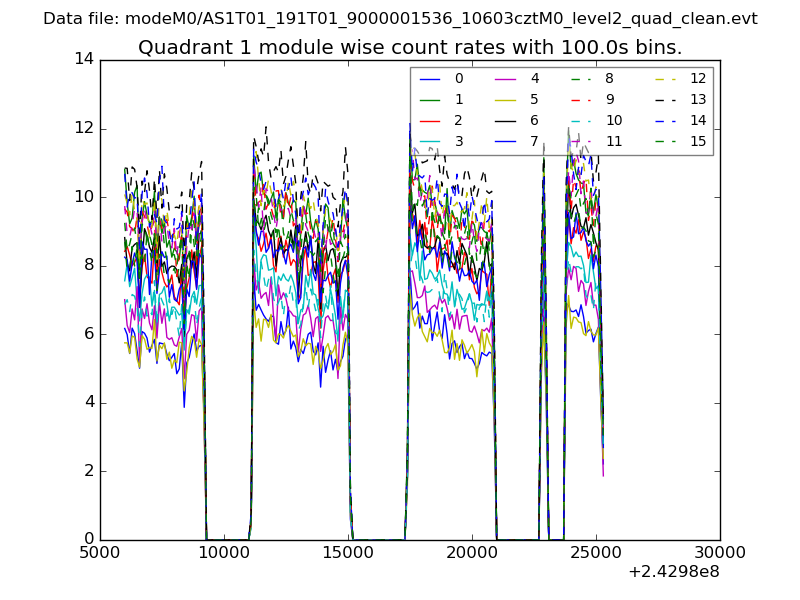 |
 |
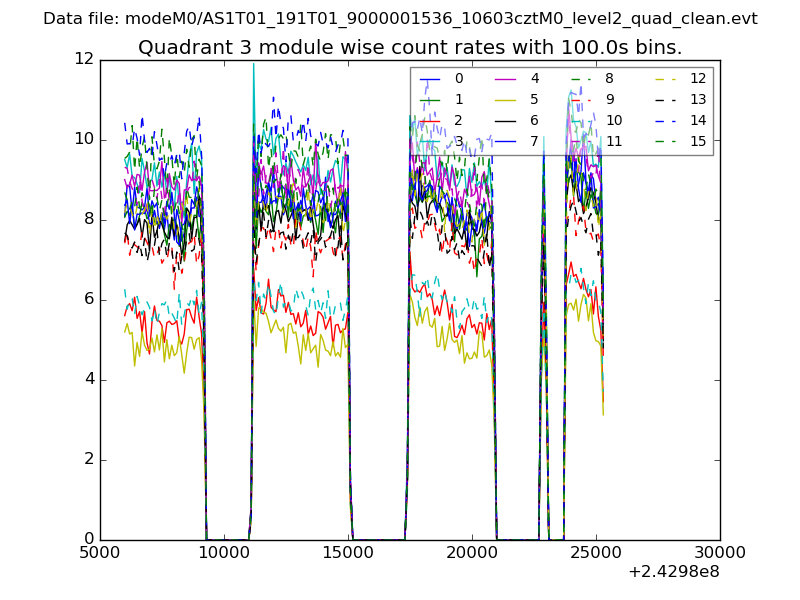
| Module-wise count rates for Quadrant C Data is divided into 100 sec bins |
 |
 |
| Module-wise count rates for Quadrant D Data is divided into 100 sec bins |
 |
 |
| Parameter | Plot |
|---|---|
| CZT HV Monitor | 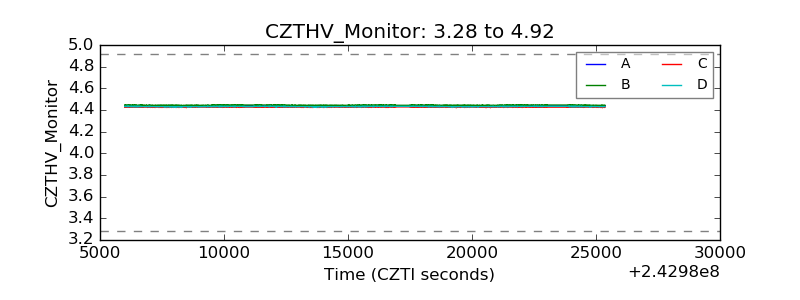 |
| D_VDD | 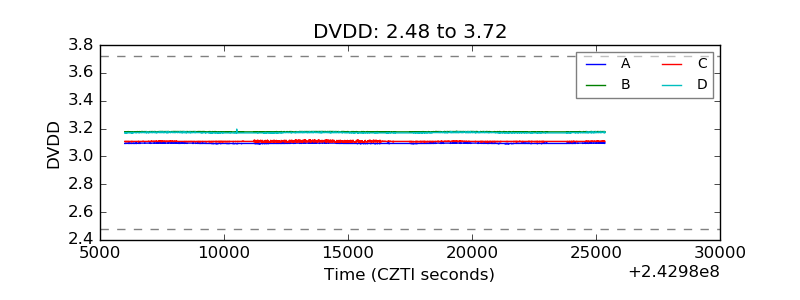 |
| Temperature 1 | 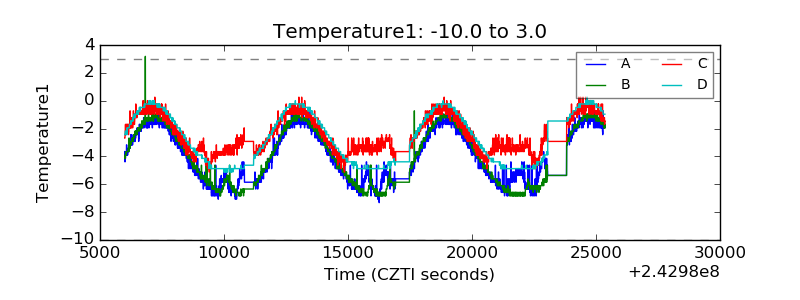 |
| Veto HV Monitor |  |
| Veto LLD |  |
| Alpha Counter | 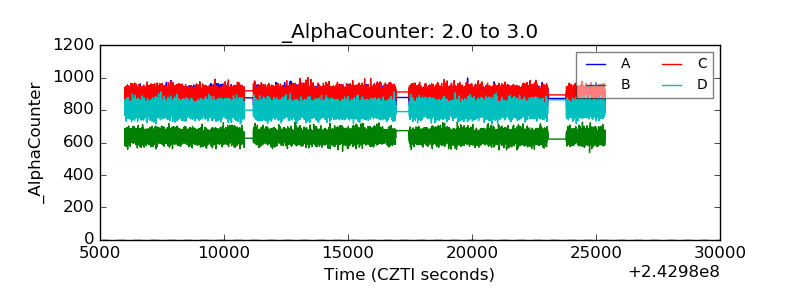 |
| _CPM_Rate | 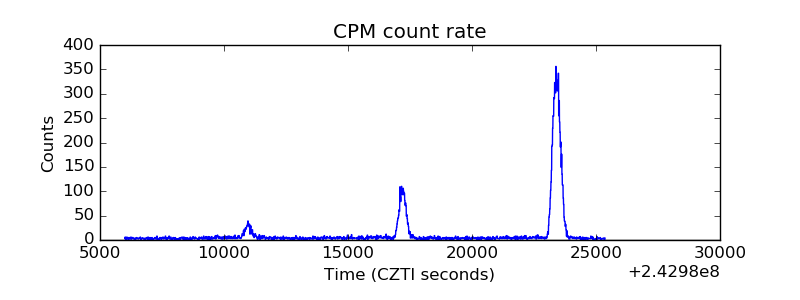 |
| CZT Counter | 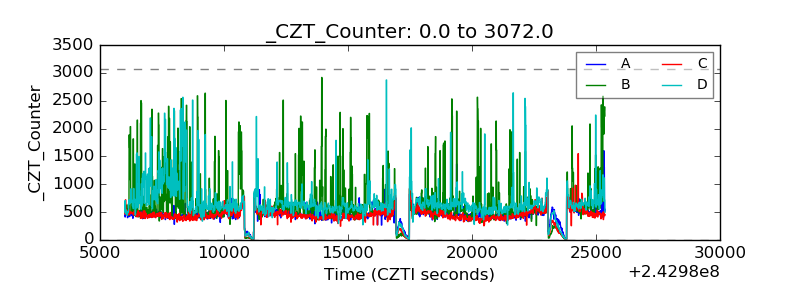 |
| +2.5 Volts monitor |  |
| +5 Volts monitor |  |
| _ROLL_ROT | 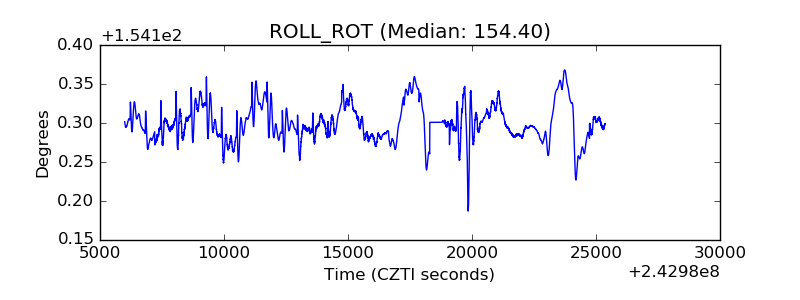 |
| _Roll_DEC | 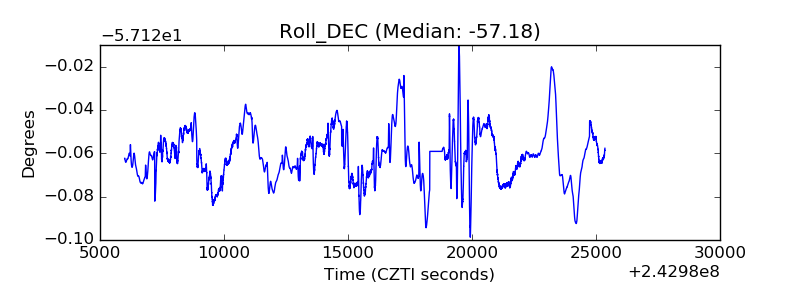 |
| _Roll_RA |  |
| Veto Counter | 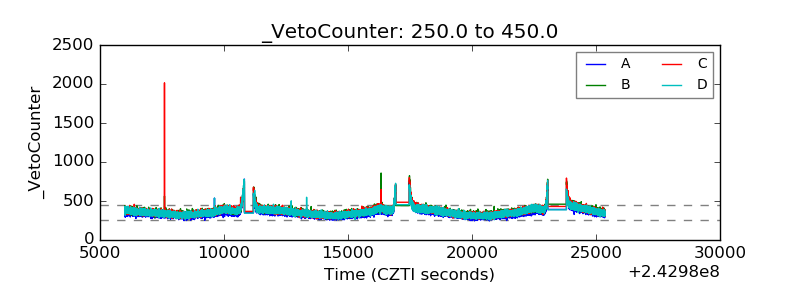 |