| Param | Original file | Final file |
|---|---|---|
| Filename | modeM0/AS1T01_191T01_9000001536_10604cztM0_level2.evt | modeM0/AS1T01_191T01_9000001536_10604cztM0_level2_quad_clean.evt |
| Size (bytes) | 470,744,640 | 83,128,320 |
| Size | 448.9 MB | 79.3 MB |
| Events in quadrant A | 2,779,065 | 552,972 |
| Events in quadrant B | 4,893,155 | 498,677 |
| Events in quadrant C | 2,549,484 | 547,823 |
| Events in quadrant D | 3,650,763 | 521,953 |
| Mode SS | |||
|---|---|---|---|
| Quadrant | BADHDUFLAG | Total packets | Discarded packets |
| A | 0 | 116 | 0 |
| B | 0 | 116 | 0 |
| C | 0 | 116 | 0 |
| D | 0 | 116 | 0 |
| Mode M9 | |||
|---|---|---|---|
| Quadrant | BADHDUFLAG | Total packets | Discarded packets |
| A | 0 | 10 | 0 |
| B | 0 | 10 | 0 |
| C | 0 | 10 | 0 |
| D | 0 | 10 | 0 |
| Mode M0 | |||
|---|---|---|---|
| Quadrant | BADHDUFLAG | Total packets | Discarded packets |
| A | 0 | 12023 | 2 |
| B | 0 | 18287 | 1 |
| C | 0 | 11580 | 1 |
| D | 0 | 14717 | 1 |
| Quadrant | Total seconds | Saturated seconds | Saturation percentage |
|---|---|---|---|
| A | 5653 | 47 | 0.831417% |
| B | 5653 | 700 | 12.382806% |
| C | 5653 | 21 | 0.371484% |
| D | 5653 | 40 | 0.707589% |
Noise dominated data is calculated using 1-second bins in cleaned event files. If a bin has >2000 counts, and if more than 50% of those come from <1% of pixels, then it is considered to be noise-dominated and hence unusable.
| Quadrant | # 1 sec bins | Bins with >0 counts | Bins with >2000 counts | High rate bins dominated by noise | Noise dominated (total time) | Noise dominated (detector-on time) | Marked lightcurve |
|---|---|---|---|---|---|---|---|
| A | 6628 | 5654 | 1 | 1 | 0.02% | 0.02% | 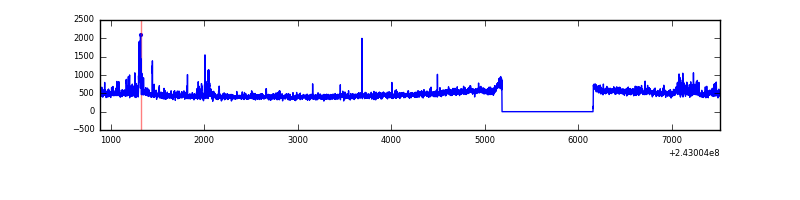 |
| B | 6628 | 5654 | 518 | 518 | 7.82% | 9.16% | 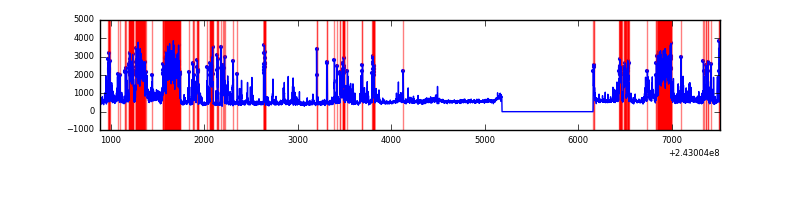 |
| C | 6628 | 5654 | 0 | 0 | 0.00% | 0.00% | 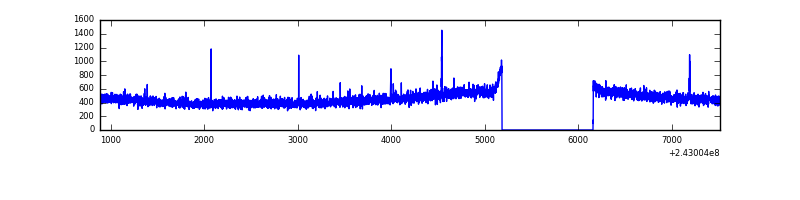 |
| D | 6628 | 5654 | 10 | 10 | 0.15% | 0.18% | 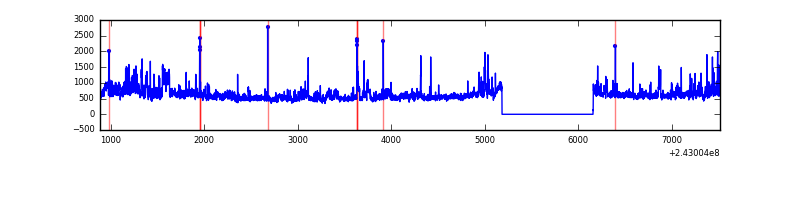 |
Top three noisy pixels from each quadrant. If the there are fewer than three noisy pixels in the level2.evt file, extra rows are filled as -1
| Pixel properties | Quadrant properties | ||||||
|---|---|---|---|---|---|---|---|
| Quadrant | DetID | PixID | Counts | Sigma | Mean | Median | Sigma |
| A | 1 | 162 | 57857 | 407.48 | 675 | 665 | 140.4 |
| A | 15 | 239 | 41846 | 293.41 | 675 | 665 | 140.4 |
| A | 1 | 178 | 23620 | 163.55 | 675 | 665 | 140.4 |
| B | 4 | 239 | 2113161 | 16870.65 | 639 | 627 | 125.2 |
| B | 0 | 219 | 116861 | 928.24 | 639 | 627 | 125.2 |
| B | 11 | 51 | 57755 | 456.22 | 639 | 627 | 125.2 |
| C | 15 | 48 | 12588 | 77.98 | 648 | 654 | 153.0 |
| C | 14 | 234 | 5440 | 31.27 | 648 | 654 | 153.0 |
| C | 13 | 61 | 4956 | 28.11 | 648 | 654 | 153.0 |
| D | 2 | 16 | 600458 | 3725.14 | 647 | 631 | 161.0 |
| D | 8 | 195 | 288597 | 1788.37 | 647 | 631 | 161.0 |
| D | 1 | 52 | 152971 | 946.09 | 647 | 631 | 161.0 |
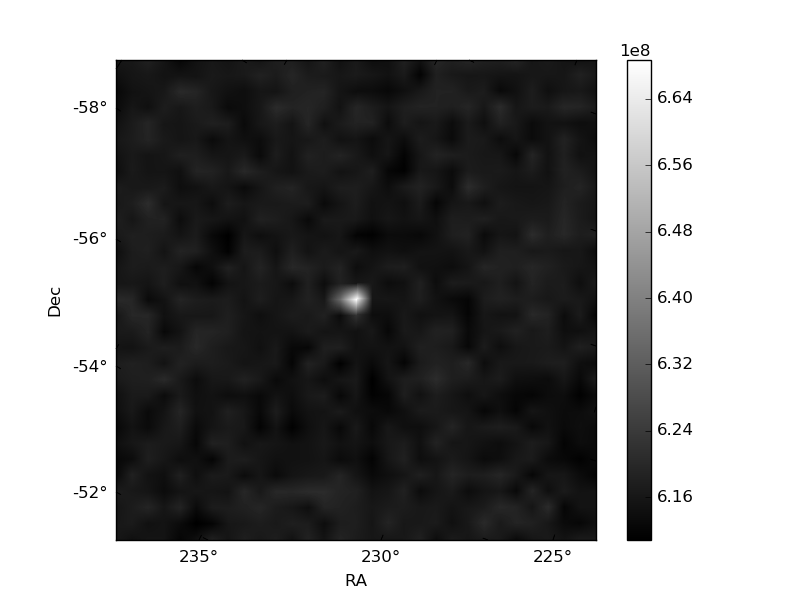
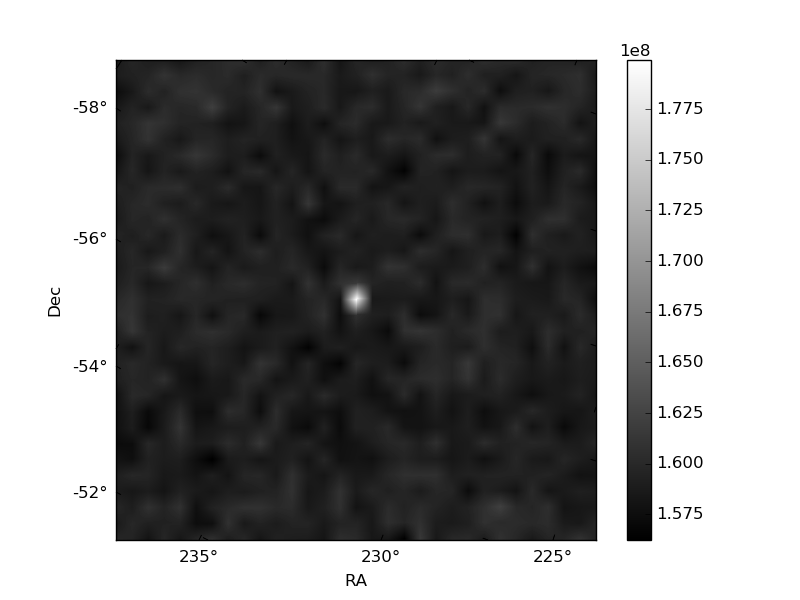
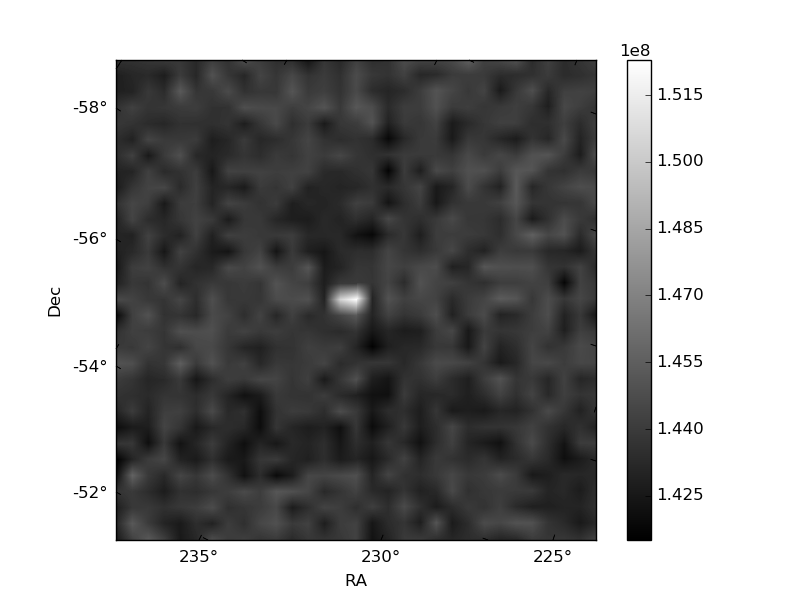
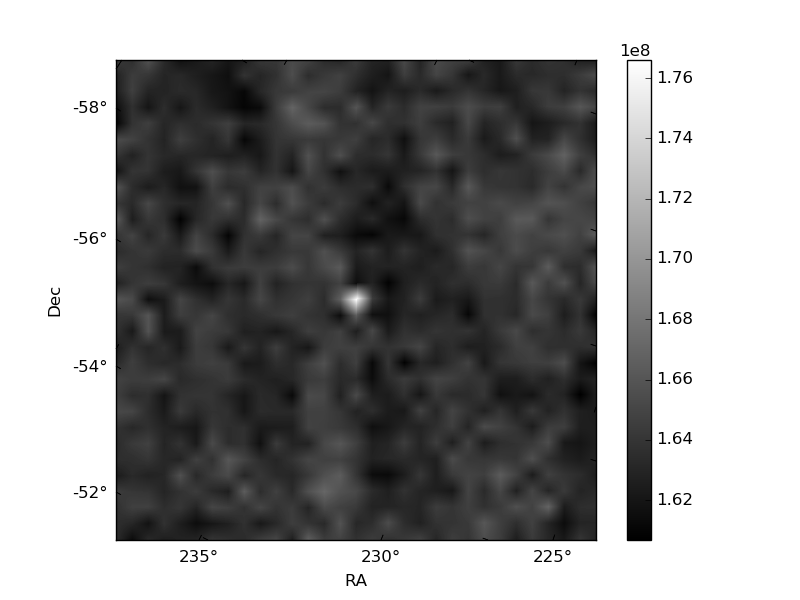
Histogram calculated using DETX and DETY for each event in the final _common_clean file
| Quadrant A | 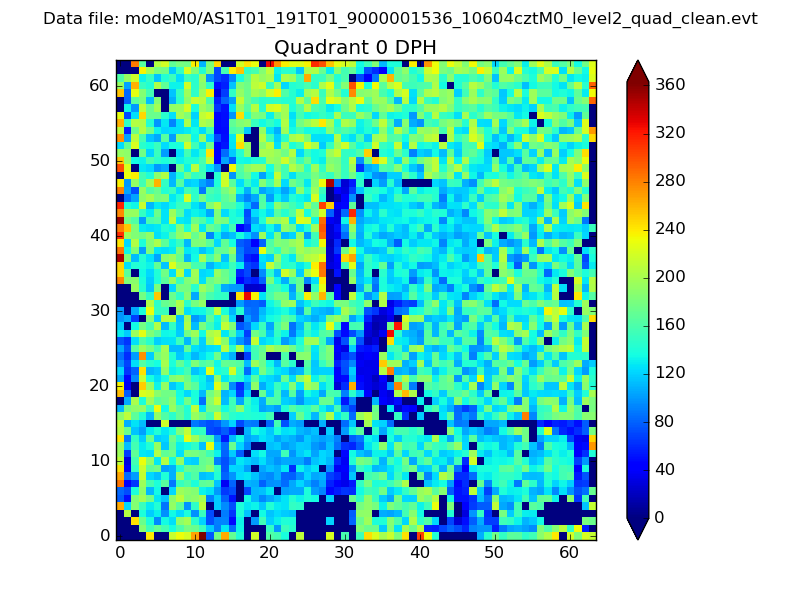 |
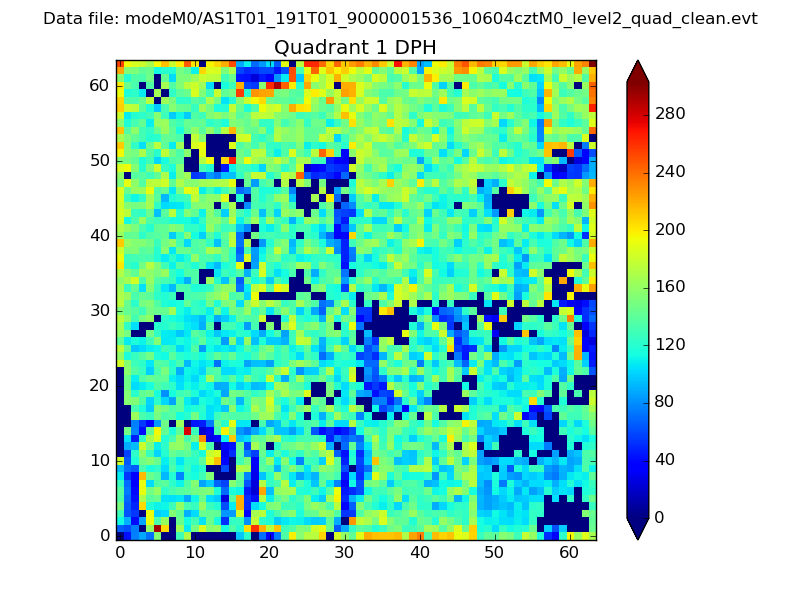 |
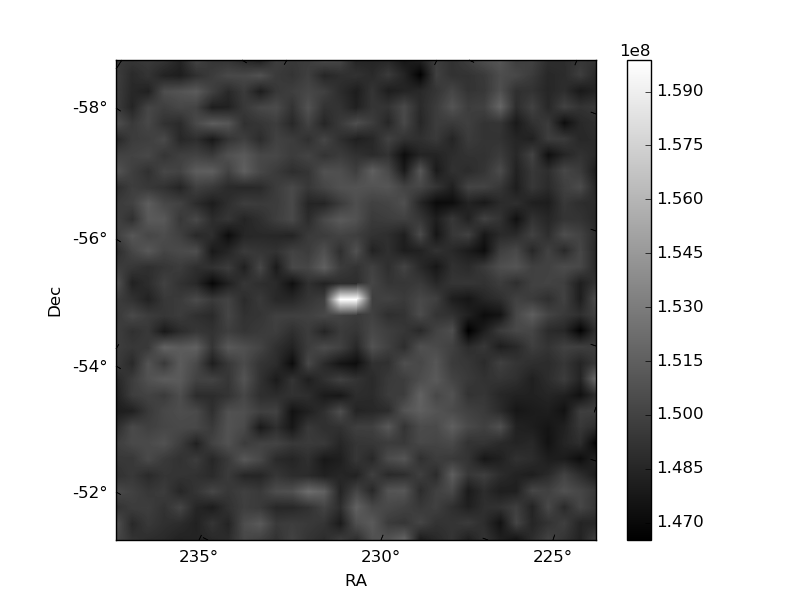
Quadrant B |
|---|---|---|---|
| Quadrant D | 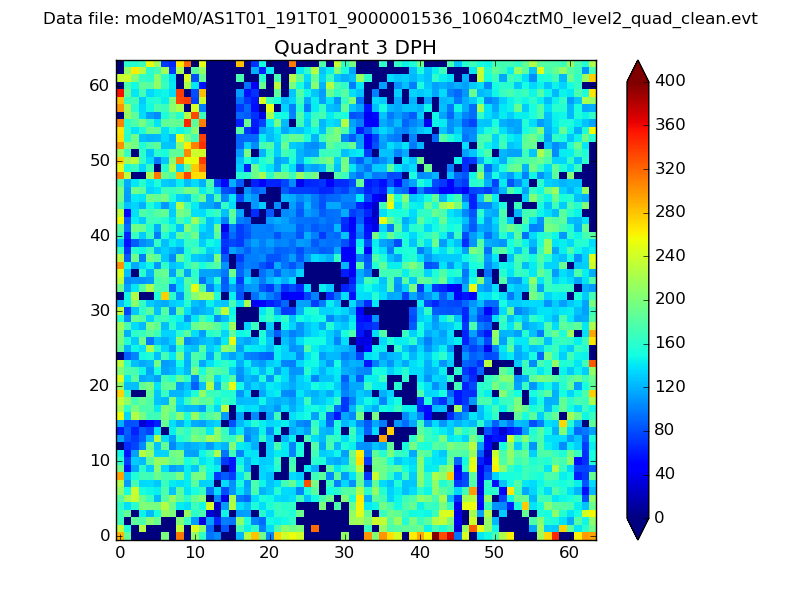 |
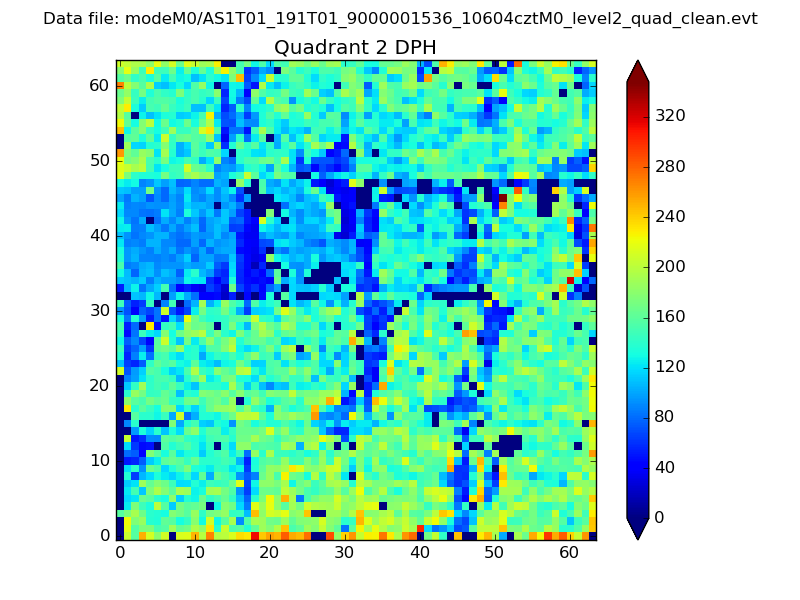 |
Quadrant C |
| Plot type | Count rate plots | Images |
|---|---|---|
| Comparison with Poisson distribution Blue bars denote a histogram of data divided into 1 sec bins. Red curve is a Poisson curve with rate = median count rate of data. |
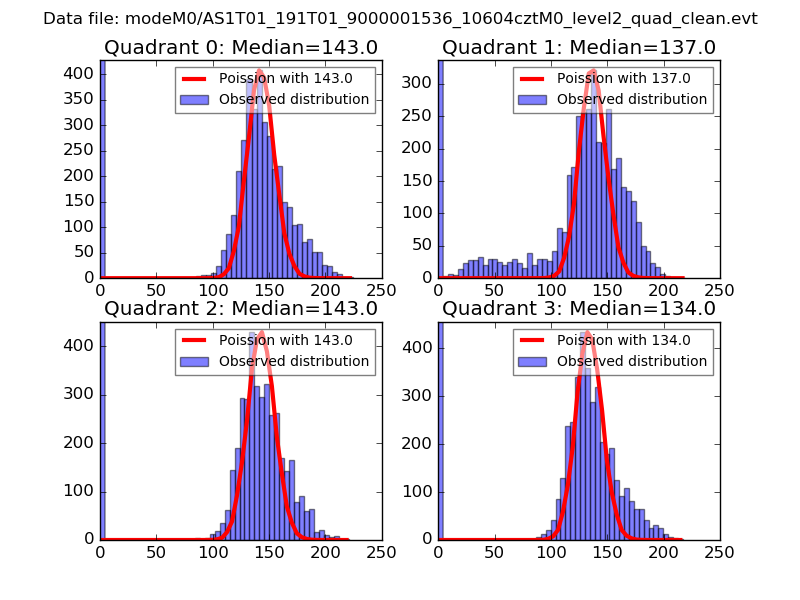 |
 |
| Quadrant-wise count rates Data is divided into 100 sec bins |
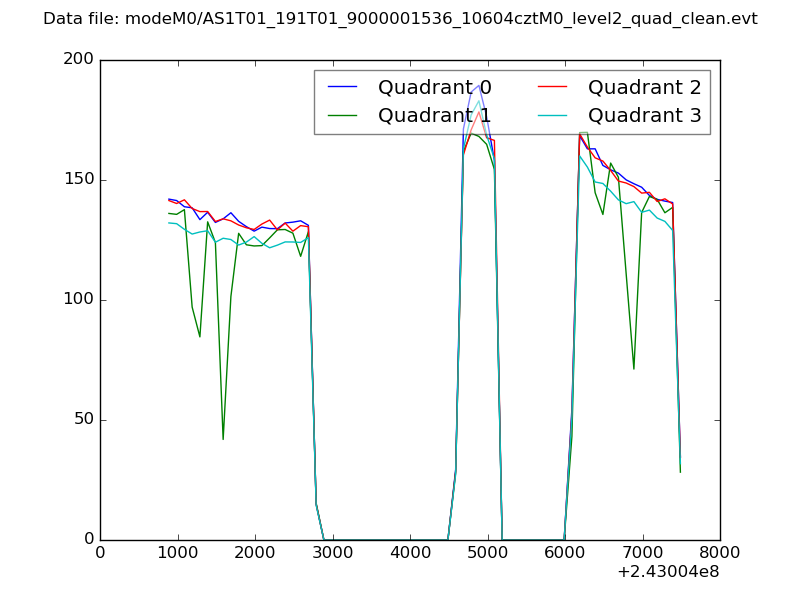 |
|
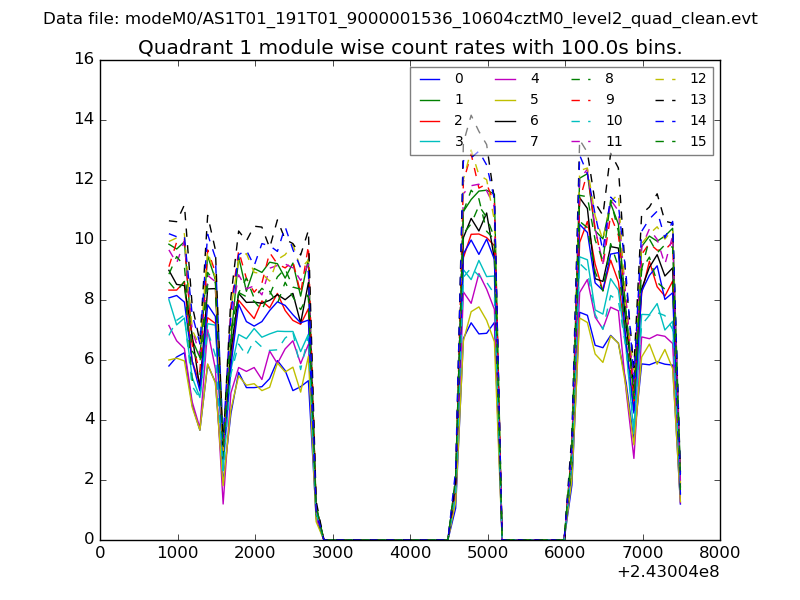
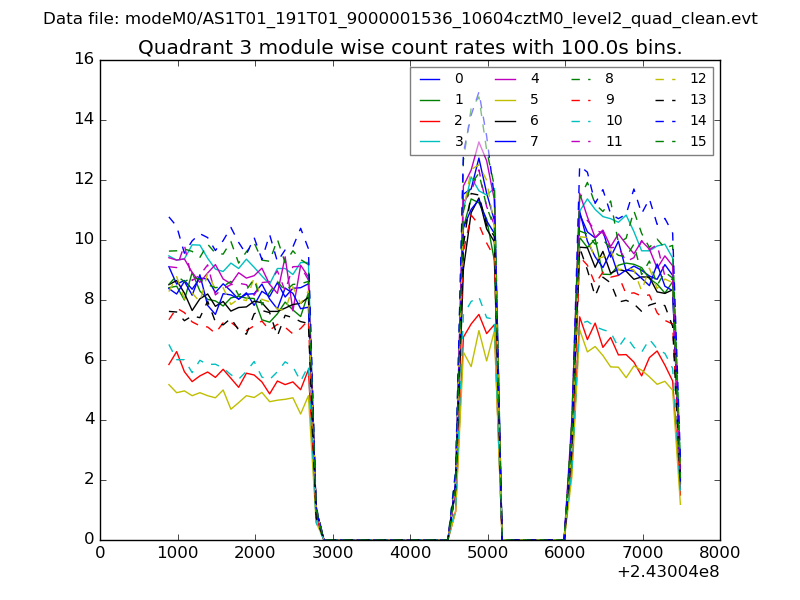
| Module-wise count rates for Quadrant A Data is divided into 100 sec bins |
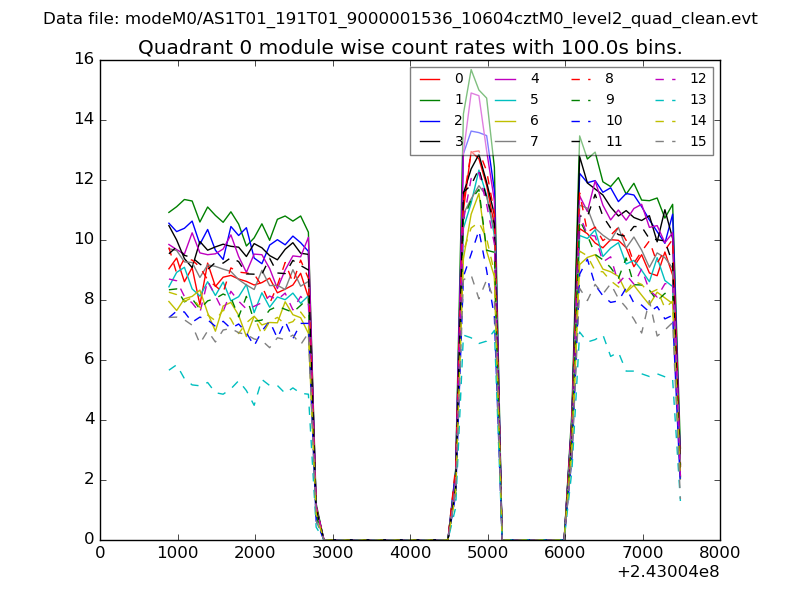 |
 |
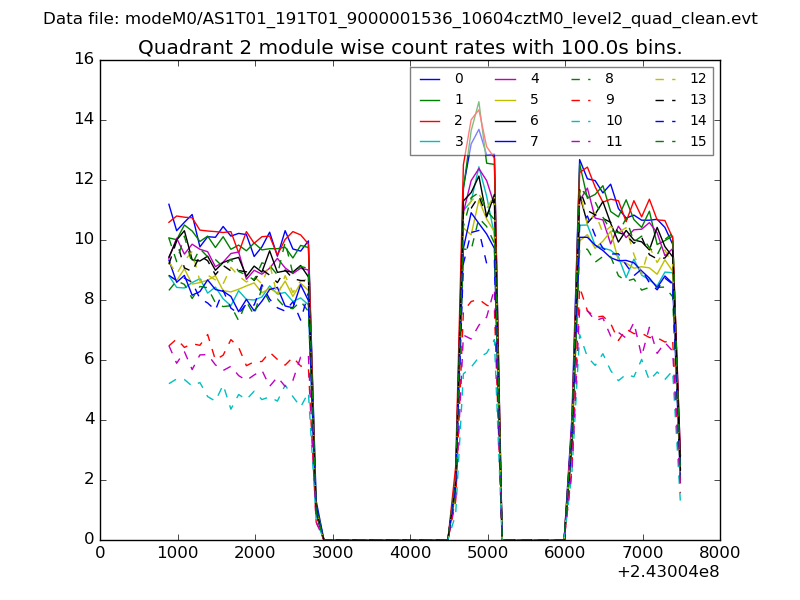
| Module-wise count rates for Quadrant B Data is divided into 100 sec bins |
 |
 |
| Module-wise count rates for Quadrant C Data is divided into 100 sec bins |
 |
 |
| Module-wise count rates for Quadrant D Data is divided into 100 sec bins |
 |
 |
| Parameter | Plot |
|---|---|
| CZT HV Monitor | 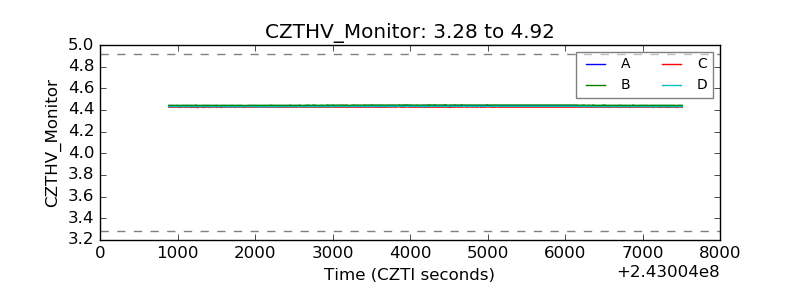 |
| D_VDD | 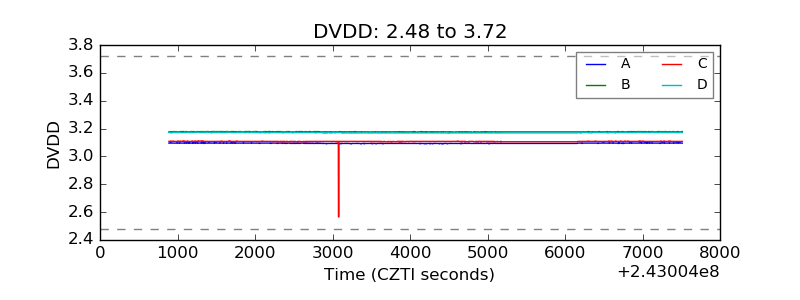 |
| Temperature 1 | 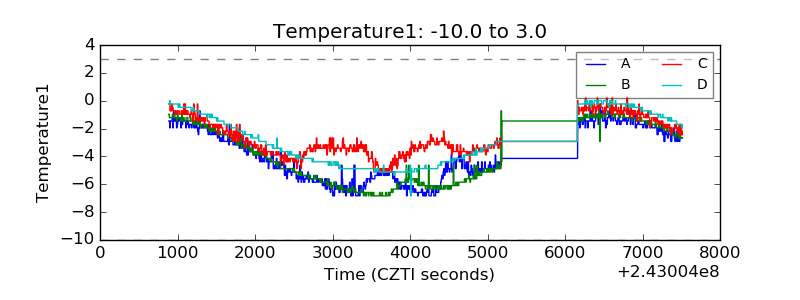 |
| Veto HV Monitor | 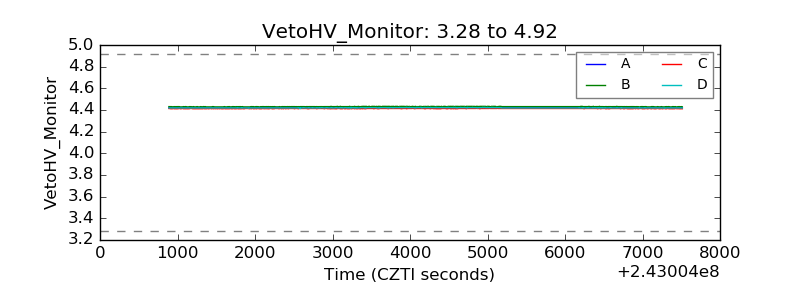 |
| Veto LLD | 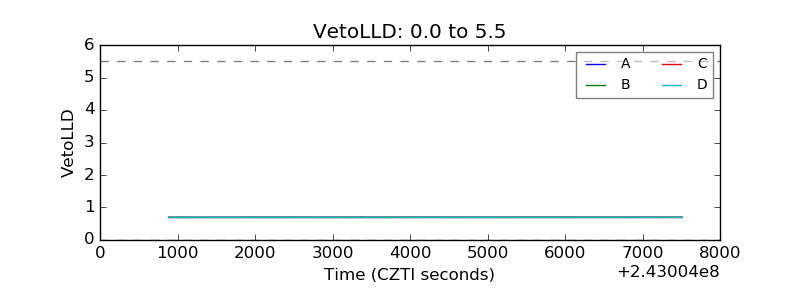 |
| Alpha Counter | 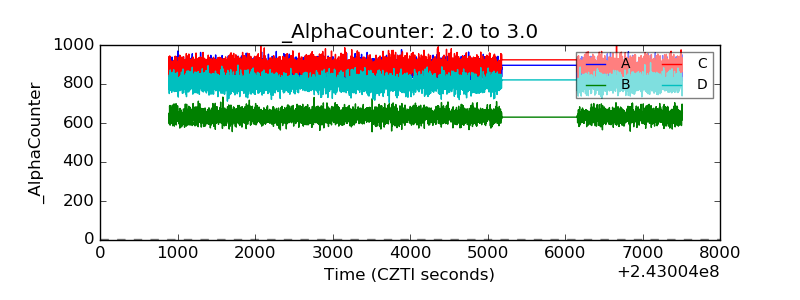 |
| _CPM_Rate | 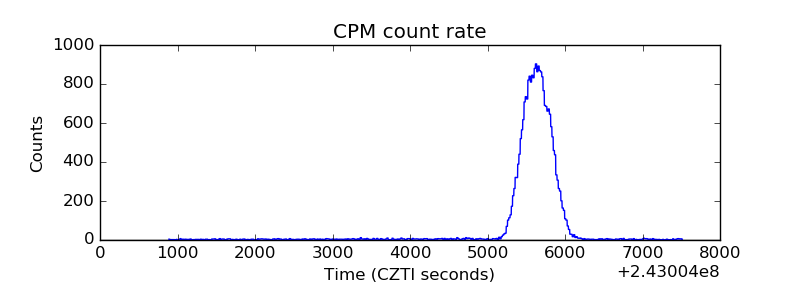 |
| CZT Counter | 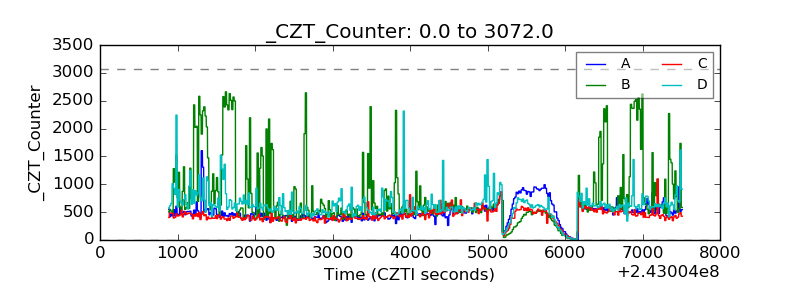 |
| +2.5 Volts monitor |  |
| +5 Volts monitor |  |
| _ROLL_ROT | 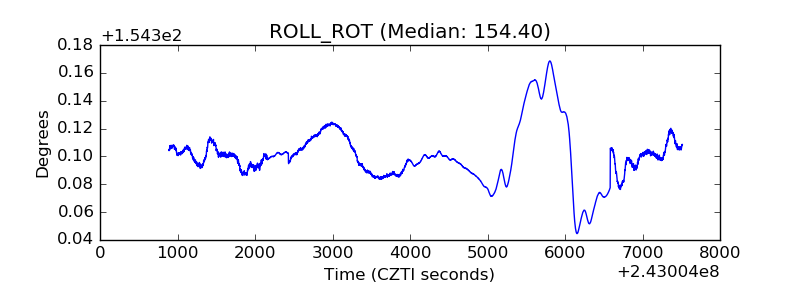 |
| _Roll_DEC | 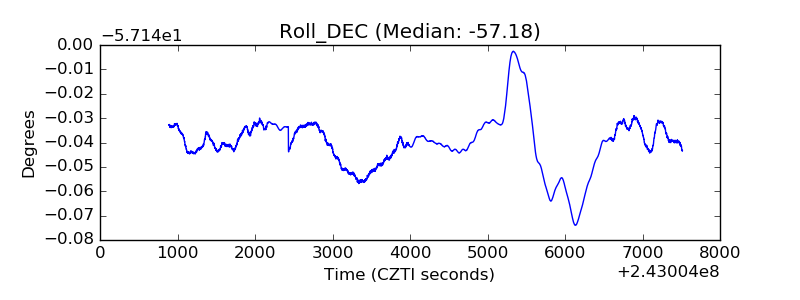 |
| _Roll_RA | 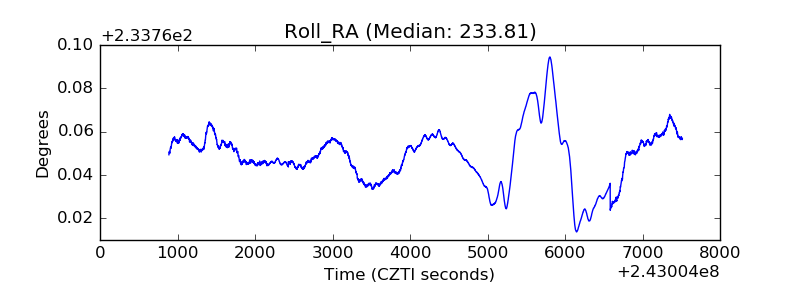 |
| Veto Counter | 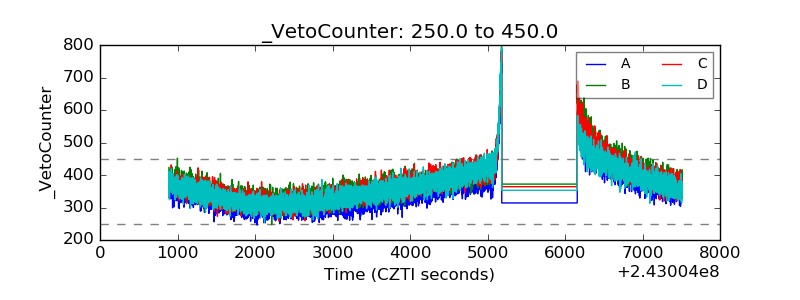 |