| Param | Original file | Final file |
|---|---|---|
| Filename | modeM0/AS1T01_191T01_9000001536_10606cztM0_level2.evt | modeM0/AS1T01_191T01_9000001536_10606cztM0_level2_quad_clean.evt |
| Size (bytes) | 439,372,800 | 83,871,360 |
| Size | 419.0 MB | 80.0 MB |
| Events in quadrant A | 2,720,929 | 555,232 |
| Events in quadrant B | 4,147,331 | 525,824 |
| Events in quadrant C | 2,517,183 | 549,715 |
| Events in quadrant D | 3,543,649 | 520,311 |
| Mode SS | |||
|---|---|---|---|
| Quadrant | BADHDUFLAG | Total packets | Discarded packets |
| A | 0 | 114 | 0 |
| B | 0 | 114 | 0 |
| C | 0 | 114 | 0 |
| D | 0 | 114 | 0 |
| Mode M9 | |||
|---|---|---|---|
| Quadrant | BADHDUFLAG | Total packets | Discarded packets |
| A | 0 | 11 | 0 |
| B | 0 | 11 | 0 |
| C | 0 | 11 | 0 |
| D | 0 | 11 | 0 |
| Mode M0 | |||
|---|---|---|---|
| Quadrant | BADHDUFLAG | Total packets | Discarded packets |
| A | 0 | 11816 | 14 |
| B | 0 | 15989 | 7 |
| C | 0 | 11423 | 1 |
| D | 0 | 14408 | 5 |
| Quadrant | Total seconds | Saturated seconds | Saturation percentage |
|---|---|---|---|
| A | 5547 | 26 | 0.468722% |
| B | 5551 | 417 | 7.512160% |
| C | 5553 | 18 | 0.324149% |
| D | 5552 | 41 | 0.738473% |
Noise dominated data is calculated using 1-second bins in cleaned event files. If a bin has >2000 counts, and if more than 50% of those come from <1% of pixels, then it is considered to be noise-dominated and hence unusable.
| Quadrant | # 1 sec bins | Bins with >0 counts | Bins with >2000 counts | High rate bins dominated by noise | Noise dominated (total time) | Noise dominated (detector-on time) | Marked lightcurve |
|---|---|---|---|---|---|---|---|
| A | 6668 | 5553 | 0 | 0 | 0.00% | 0.00% | 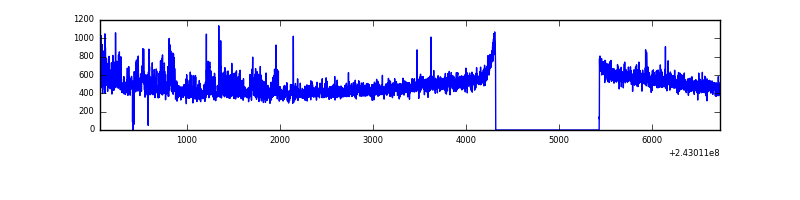 |
| B | 6668 | 5554 | 290 | 290 | 4.35% | 5.22% | 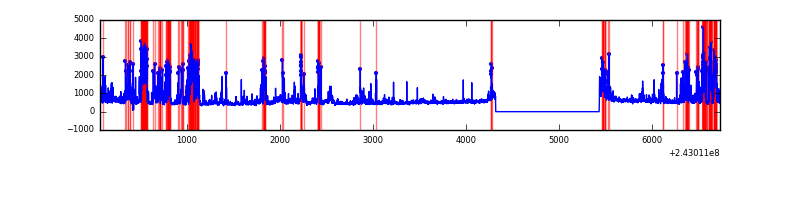 |
| C | 6668 | 5554 | 3 | 3 | 0.04% | 0.05% | 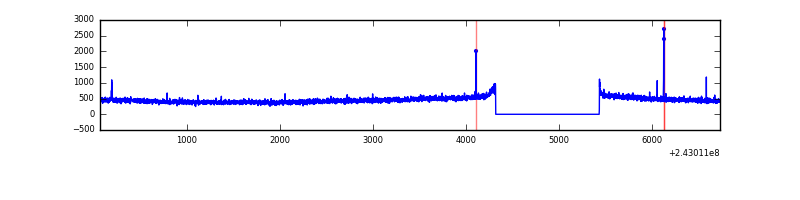 |
| D | 6668 | 5554 | 14 | 14 | 0.21% | 0.25% | 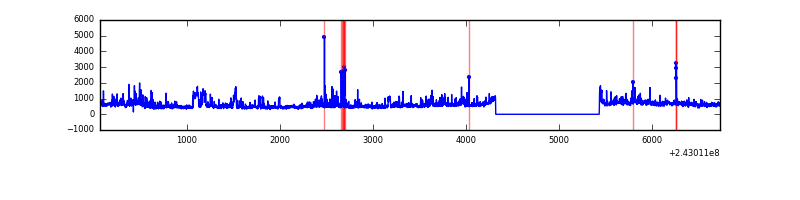 |
Top three noisy pixels from each quadrant. If the there are fewer than three noisy pixels in the level2.evt file, extra rows are filled as -1
| Pixel properties | Quadrant properties | ||||||
|---|---|---|---|---|---|---|---|
| Quadrant | DetID | PixID | Counts | Sigma | Mean | Median | Sigma |
| A | 1 | 162 | 73157 | 523.83 | 665 | 653 | 138.4 |
| A | 1 | 178 | 30312 | 214.28 | 665 | 653 | 138.4 |
| A | 1 | 161 | 27213 | 191.89 | 665 | 653 | 138.4 |
| B | 4 | 239 | 1305956 | 10419.65 | 649 | 635 | 125.3 |
| B | 0 | 219 | 139452 | 1108.1 | 649 | 635 | 125.3 |
| B | 11 | 51 | 112344 | 891.71 | 649 | 635 | 125.3 |
| C | 0 | 207 | 9236 | 57.64 | 638 | 646 | 149.0 |
| C | 14 | 234 | 8038 | 49.6 | 638 | 646 | 149.0 |
| C | 13 | 61 | 4896 | 28.52 | 638 | 646 | 149.0 |
| D | 2 | 16 | 371949 | 2401.69 | 631 | 616 | 154.6 |
| D | 1 | 52 | 304048 | 1962.53 | 631 | 616 | 154.6 |
| D | 8 | 195 | 252136 | 1626.77 | 631 | 616 | 154.6 |
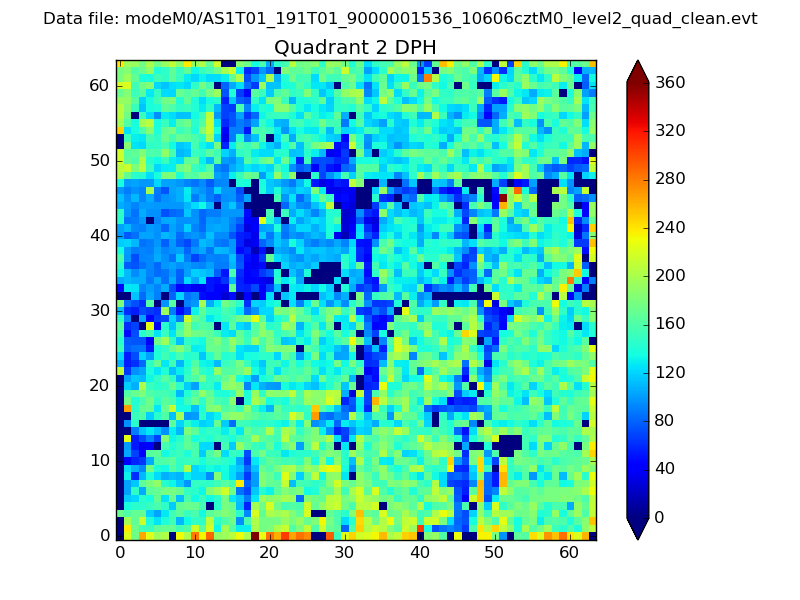
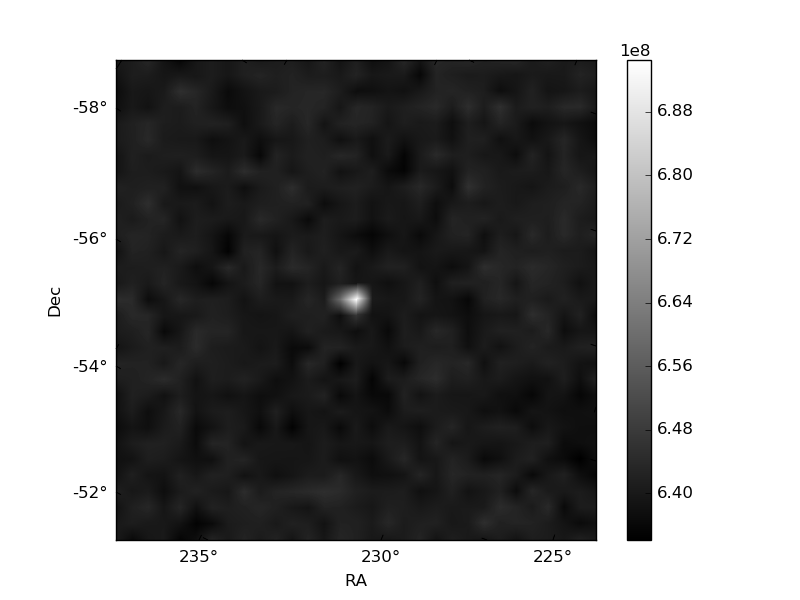
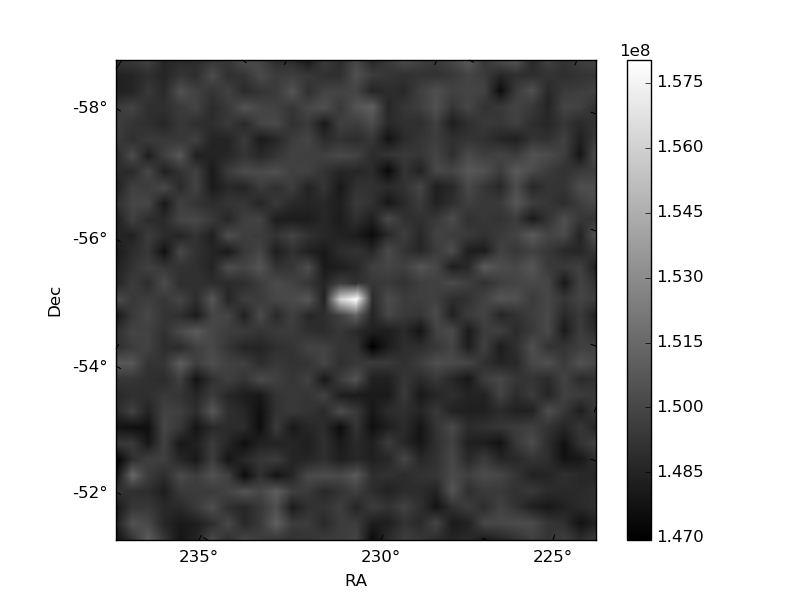
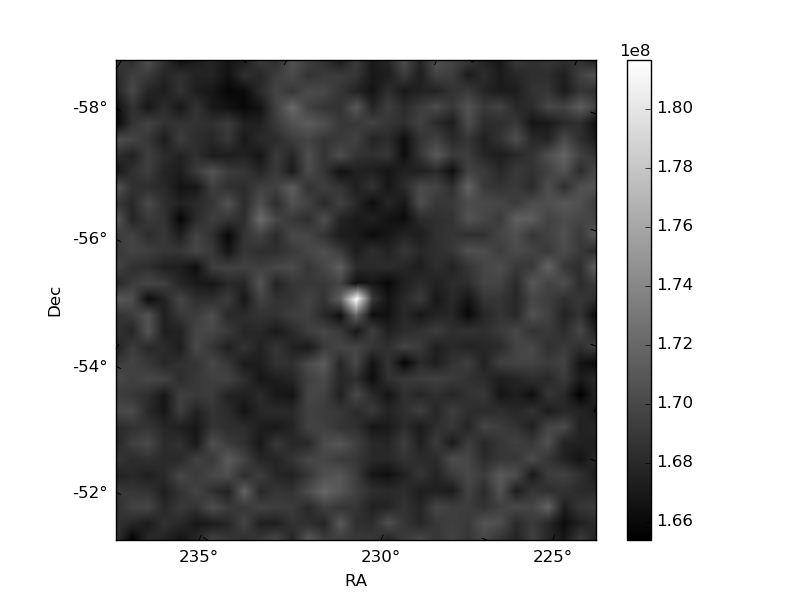
Histogram calculated using DETX and DETY for each event in the final _common_clean file
| Quadrant A | 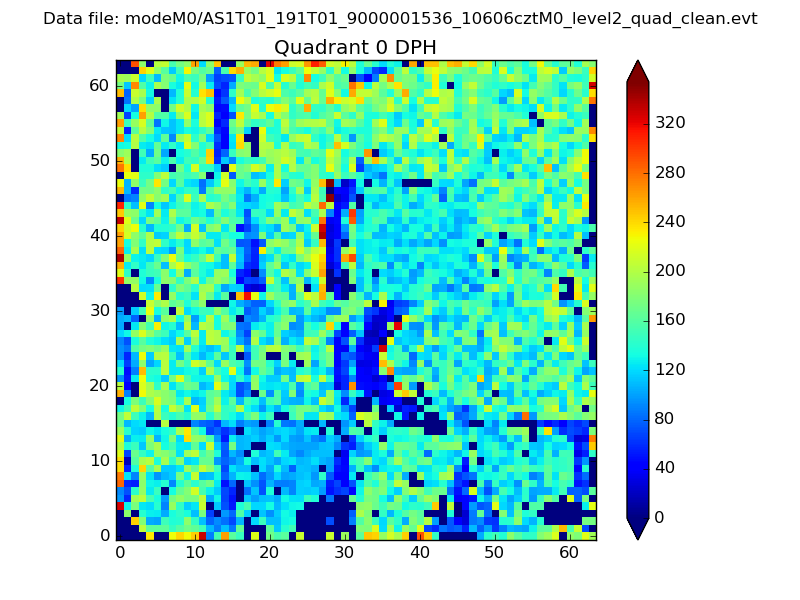 |
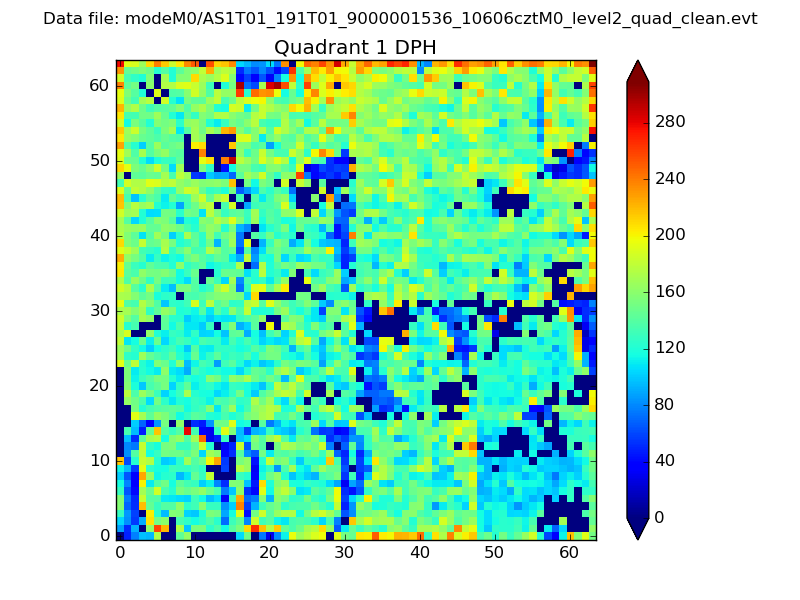 |
Quadrant B |
|---|---|---|---|
| Quadrant D | 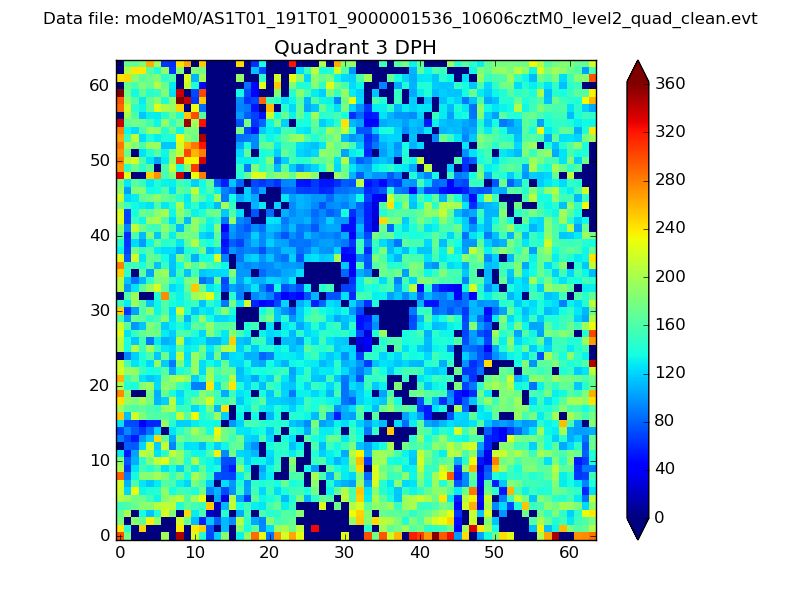 |
 |
Quadrant C |
| Plot type | Count rate plots | Images |
|---|---|---|
| Comparison with Poisson distribution Blue bars denote a histogram of data divided into 1 sec bins. Red curve is a Poisson curve with rate = median count rate of data. |
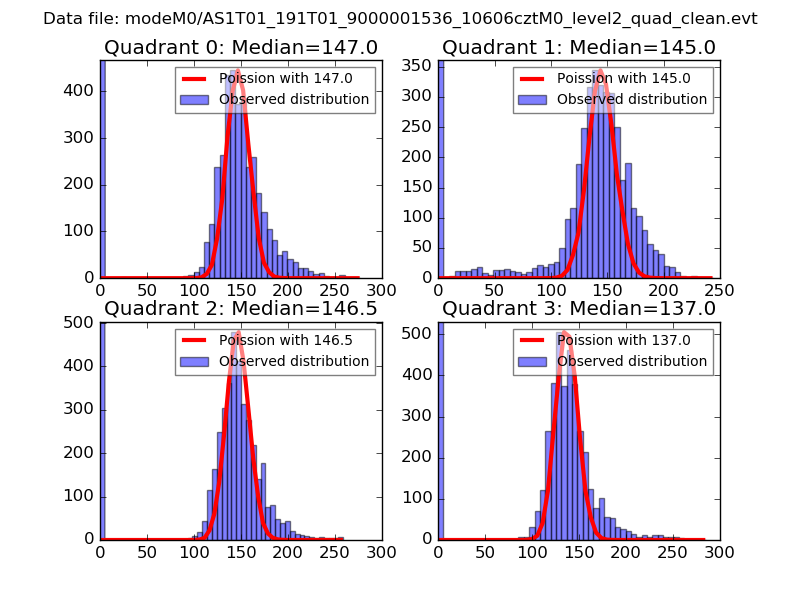 |
 |
| Quadrant-wise count rates Data is divided into 100 sec bins |
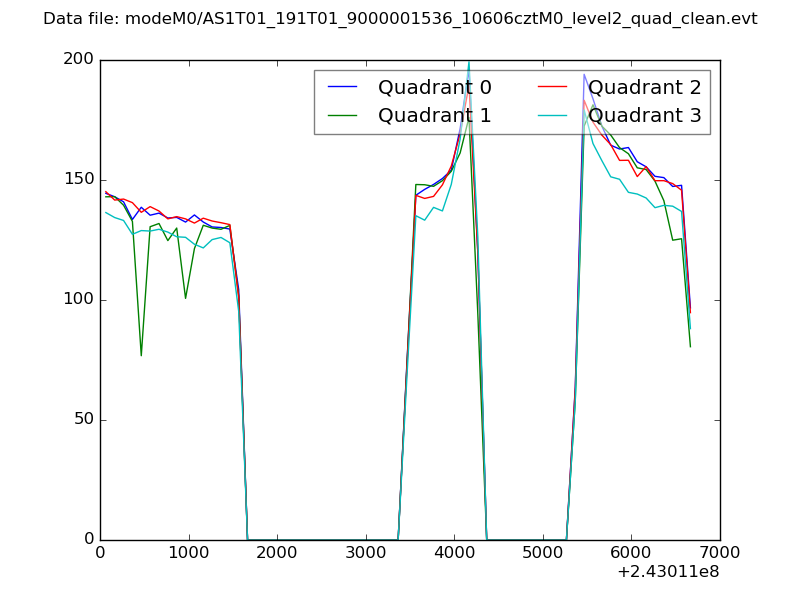 |
|
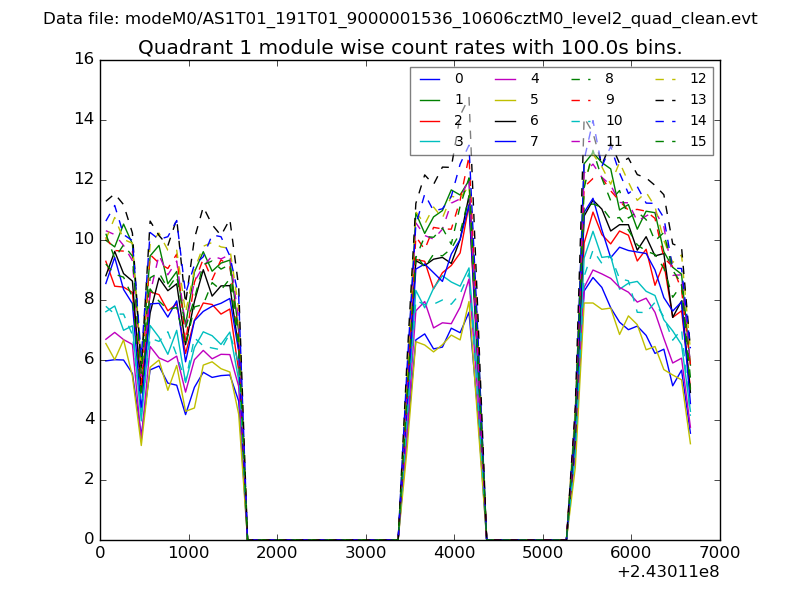
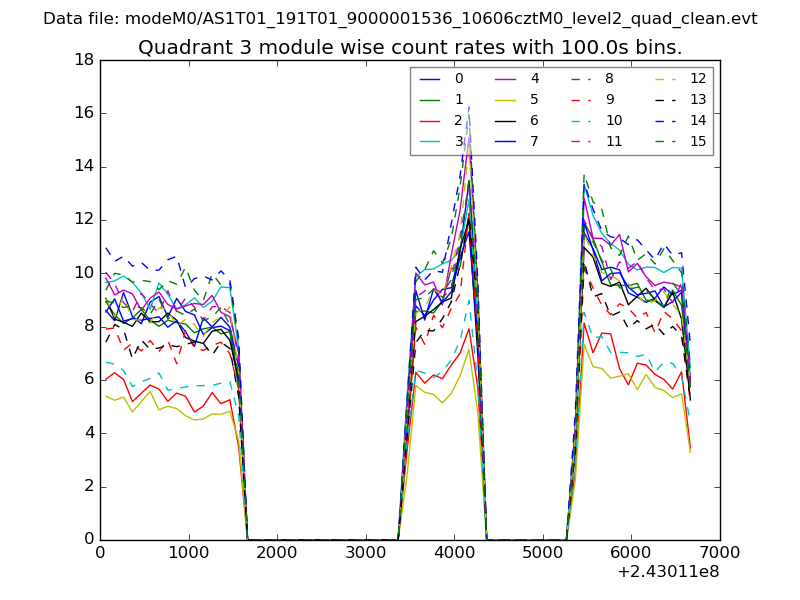
| Module-wise count rates for Quadrant A Data is divided into 100 sec bins |
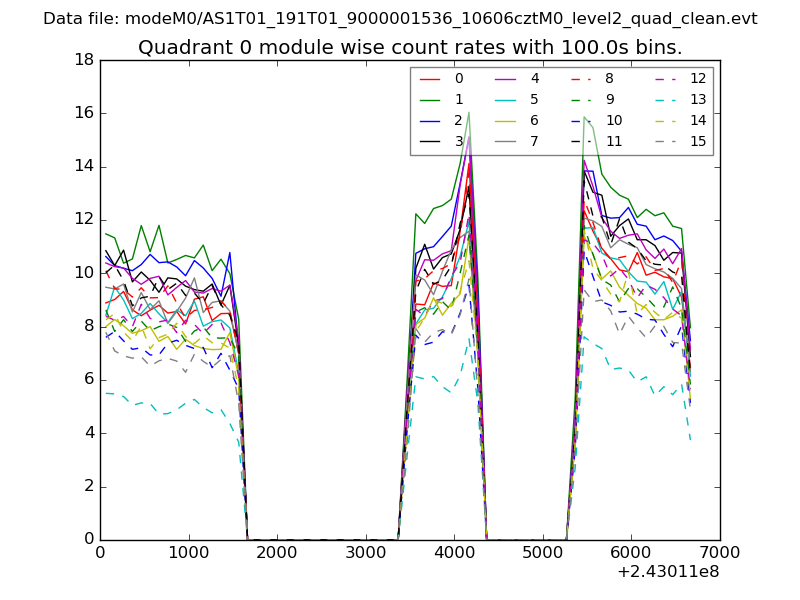 |
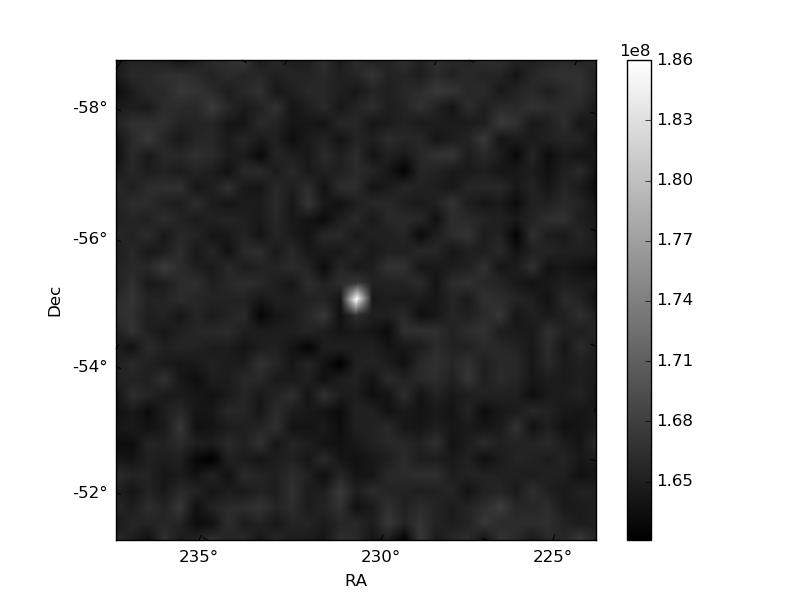 |
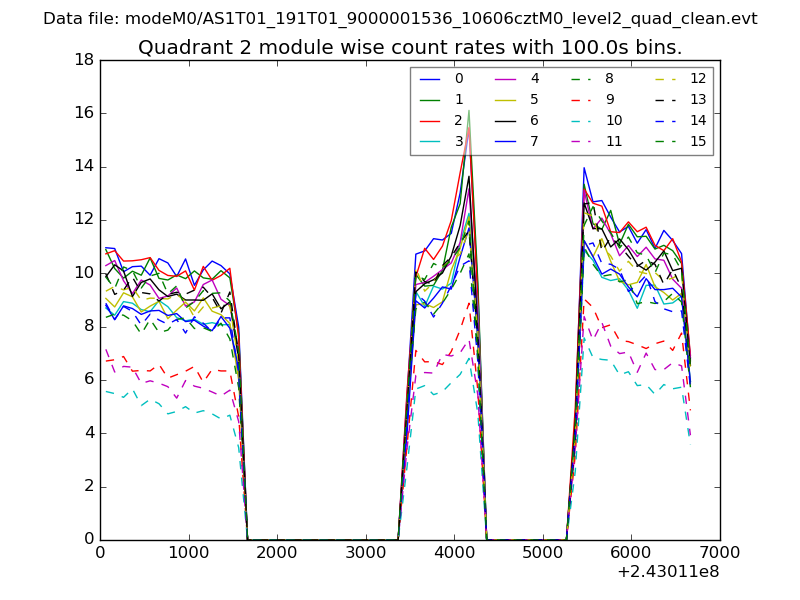
| Module-wise count rates for Quadrant B Data is divided into 100 sec bins |
 |
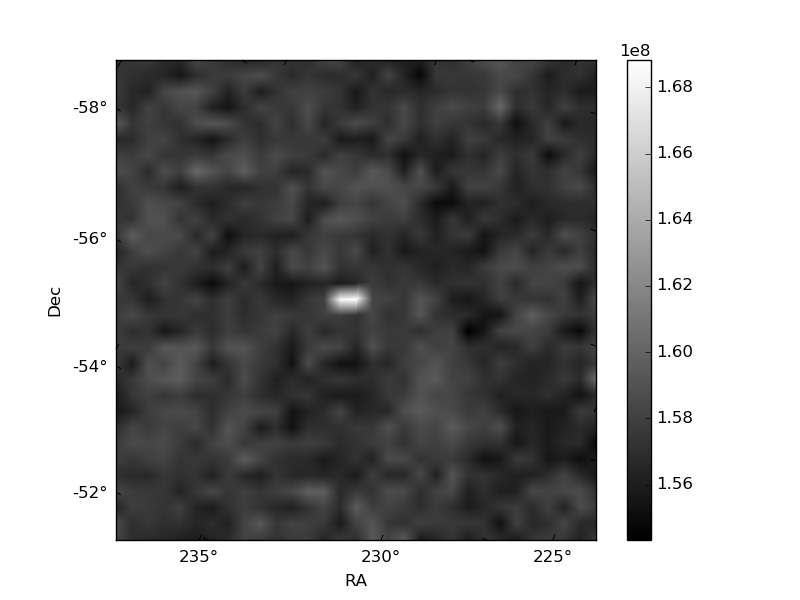 |
| Module-wise count rates for Quadrant C Data is divided into 100 sec bins |
 |
 |
| Module-wise count rates for Quadrant D Data is divided into 100 sec bins |
 |
 |
| Parameter | Plot |
|---|---|
| CZT HV Monitor | 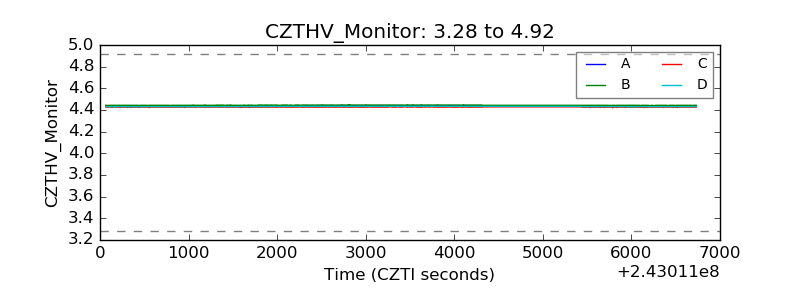 |
| D_VDD | 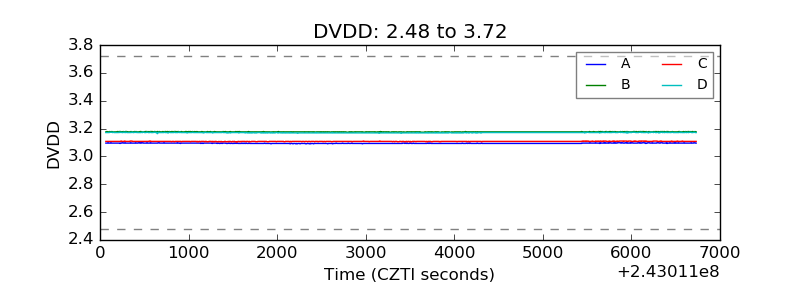 |
| Temperature 1 | 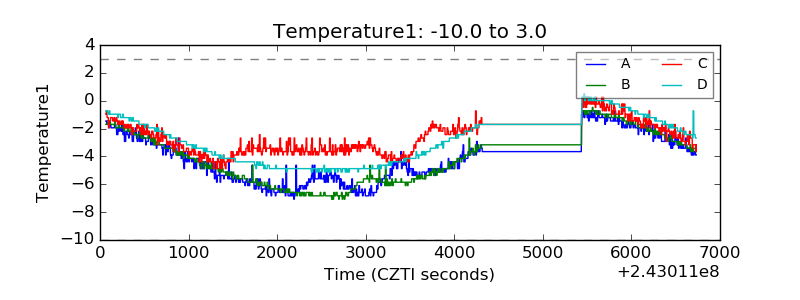 |
| Veto HV Monitor | 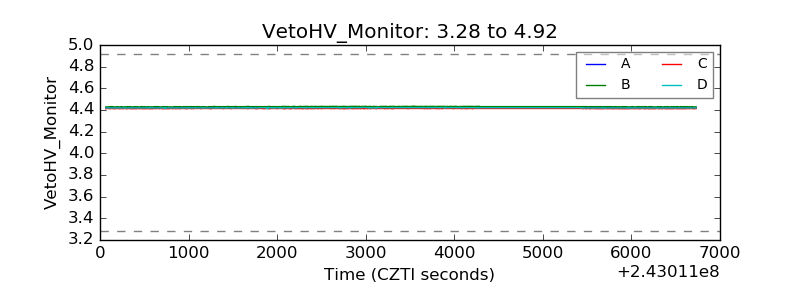 |
| Veto LLD | 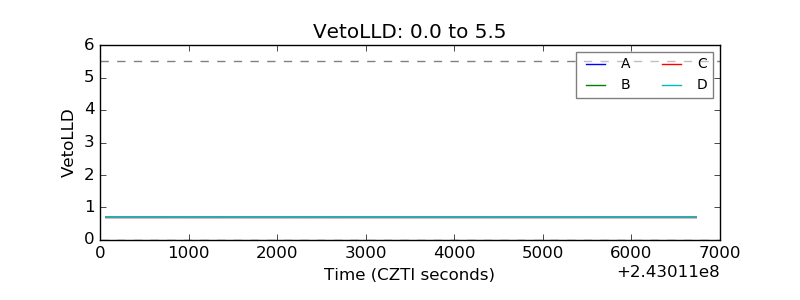 |
| Alpha Counter | 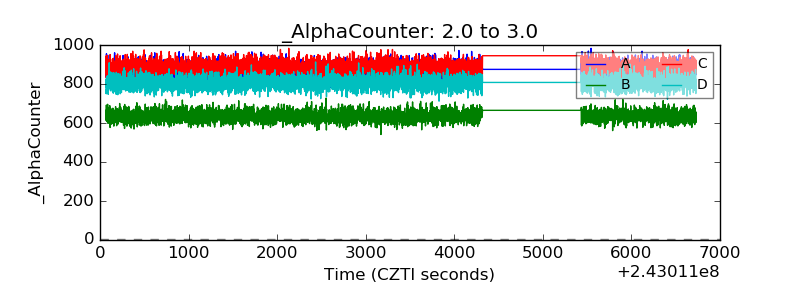 |
| _CPM_Rate | 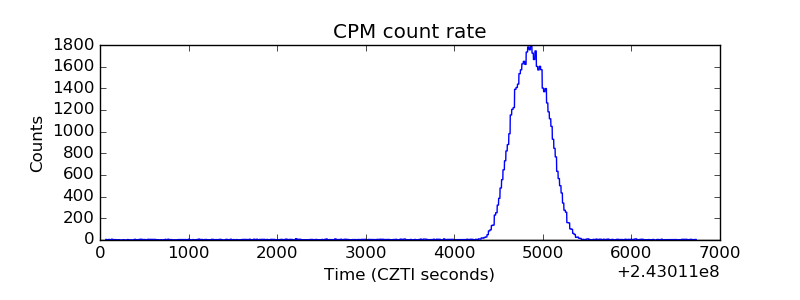 |
| CZT Counter | 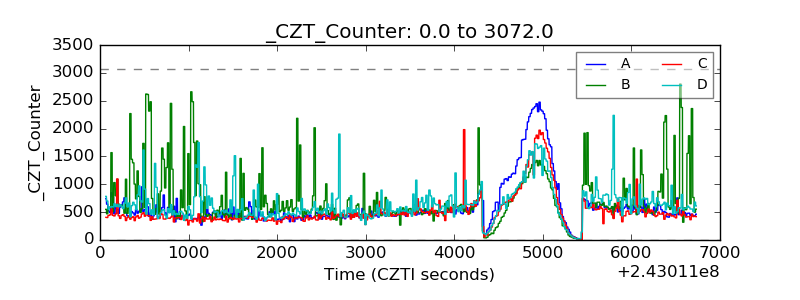 |
| +2.5 Volts monitor |  |
| +5 Volts monitor |  |
| _ROLL_ROT | 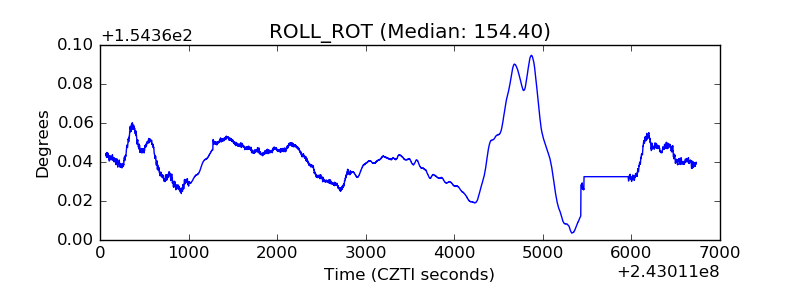 |
| _Roll_DEC |  |
| _Roll_RA | 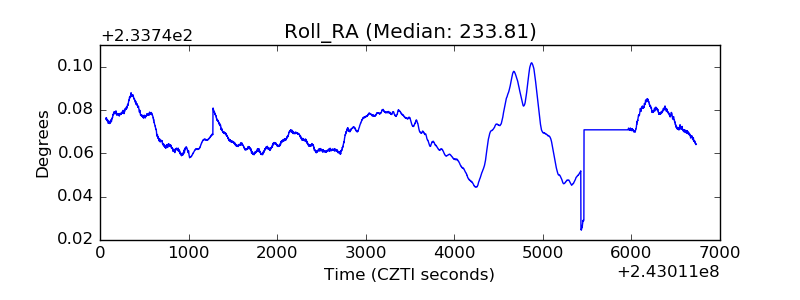 |
| Veto Counter | 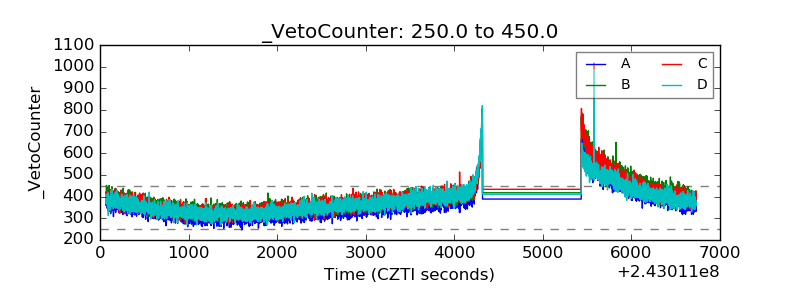 |