| Param | Original file | Final file |
|---|---|---|
| Filename | modeM0/AS1T01_191T01_9000001536_10607cztM0_level2.evt | modeM0/AS1T01_191T01_9000001536_10607cztM0_level2_quad_clean.evt |
| Size (bytes) | 463,426,560 | 91,742,400 |
| Size | 442.0 MB | 87.5 MB |
| Events in quadrant A | 2,821,178 | 612,486 |
| Events in quadrant B | 4,604,665 | 587,703 |
| Events in quadrant C | 2,695,767 | 605,820 |
| Events in quadrant D | 3,519,632 | 566,796 |
| Mode SS | |||
|---|---|---|---|
| Quadrant | BADHDUFLAG | Total packets | Discarded packets |
| A | 0 | 118 | 0 |
| B | 0 | 118 | 0 |
| C | 0 | 118 | 0 |
| D | 0 | 118 | 0 |
| Mode M9 | |||
|---|---|---|---|
| Quadrant | BADHDUFLAG | Total packets | Discarded packets |
| A | 0 | 12 | 0 |
| B | 0 | 12 | 0 |
| C | 0 | 12 | 0 |
| D | 0 | 12 | 0 |
| Mode M0 | |||
|---|---|---|---|
| Quadrant | BADHDUFLAG | Total packets | Discarded packets |
| A | 0 | 12184 | 4 |
| B | 0 | 17511 | 7 |
| C | 0 | 11988 | 5 |
| D | 0 | 14269 | 10 |
| Quadrant | Total seconds | Saturated seconds | Saturation percentage |
|---|---|---|---|
| A | 5799 | 24 | 0.413864% |
| B | 5799 | 485 | 8.363511% |
| C | 5798 | 6 | 0.103484% |
| D | 5798 | 18 | 0.310452% |
Noise dominated data is calculated using 1-second bins in cleaned event files. If a bin has >2000 counts, and if more than 50% of those come from <1% of pixels, then it is considered to be noise-dominated and hence unusable.
| Quadrant | # 1 sec bins | Bins with >0 counts | Bins with >2000 counts | High rate bins dominated by noise | Noise dominated (total time) | Noise dominated (detector-on time) | Marked lightcurve |
|---|---|---|---|---|---|---|---|
| A | 7020 | 5801 | 1 | 1 | 0.01% | 0.02% | 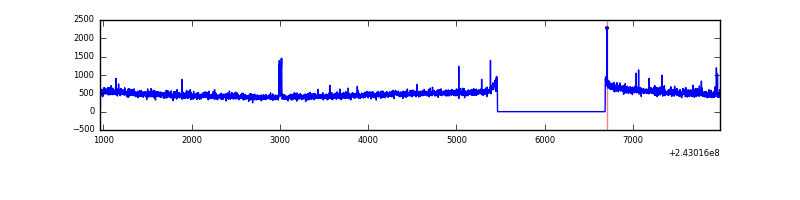 |
| B | 7020 | 5801 | 342 | 342 | 4.87% | 5.90% | 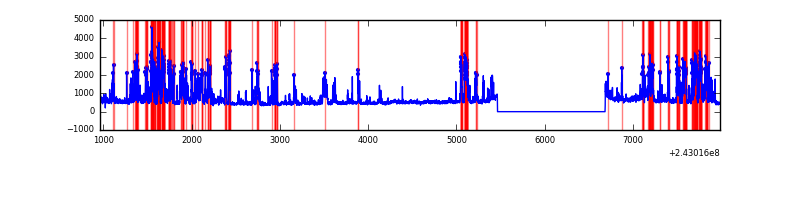 |
| C | 7020 | 5801 | 2 | 2 | 0.03% | 0.03% | 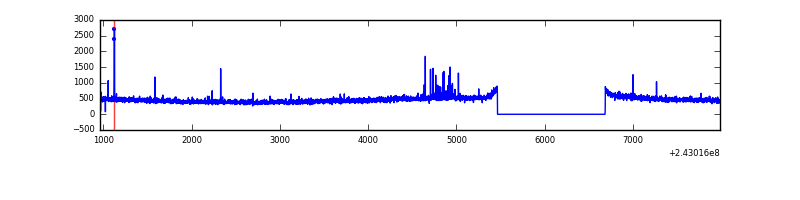 |
| D | 7020 | 5801 | 13 | 13 | 0.19% | 0.22% | 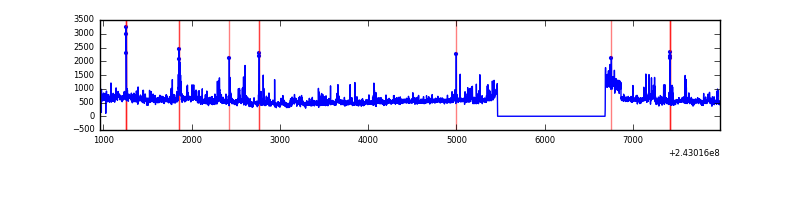 |
Top three noisy pixels from each quadrant. If the there are fewer than three noisy pixels in the level2.evt file, extra rows are filled as -1
| Pixel properties | Quadrant properties | ||||||
|---|---|---|---|---|---|---|---|
| Quadrant | DetID | PixID | Counts | Sigma | Mean | Median | Sigma |
| A | 1 | 162 | 29866 | 199.47 | 709 | 697 | 146.2 |
| A | 15 | 174 | 17525 | 115.08 | 709 | 697 | 146.2 |
| A | 1 | 178 | 10361 | 66.09 | 709 | 697 | 146.2 |
| B | 4 | 239 | 1681005 | 12770.89 | 696 | 683 | 131.6 |
| B | 0 | 219 | 95024 | 717.02 | 696 | 683 | 131.6 |
| B | 11 | 51 | 54797 | 411.28 | 696 | 683 | 131.6 |
| C | 14 | 234 | 32332 | 201.12 | 679 | 687 | 157.3 |
| C | 0 | 207 | 11007 | 65.59 | 679 | 687 | 157.3 |
| C | 13 | 61 | 5115 | 28.14 | 679 | 687 | 157.3 |
| D | 2 | 16 | 550373 | 3355.64 | 670 | 655 | 163.8 |
| D | 8 | 195 | 180639 | 1098.68 | 670 | 655 | 163.8 |
| D | 5 | 222 | 77245 | 467.53 | 670 | 655 | 163.8 |
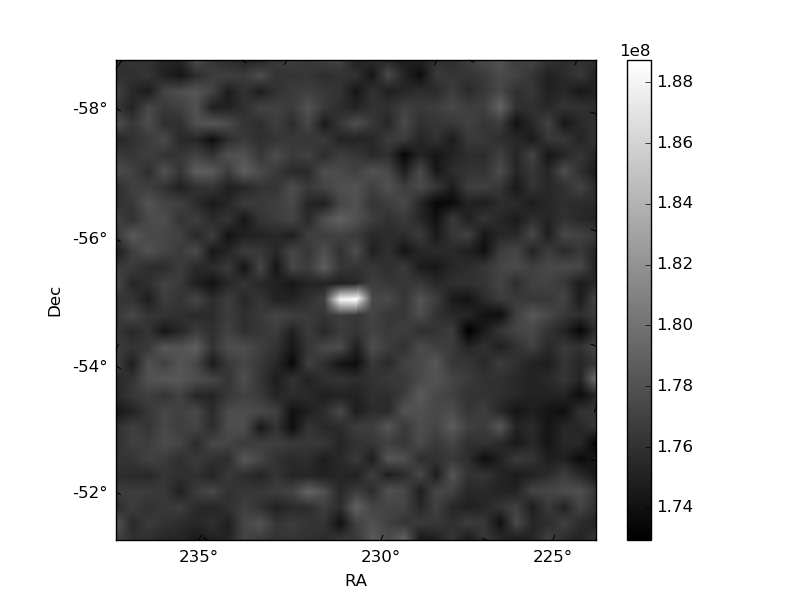
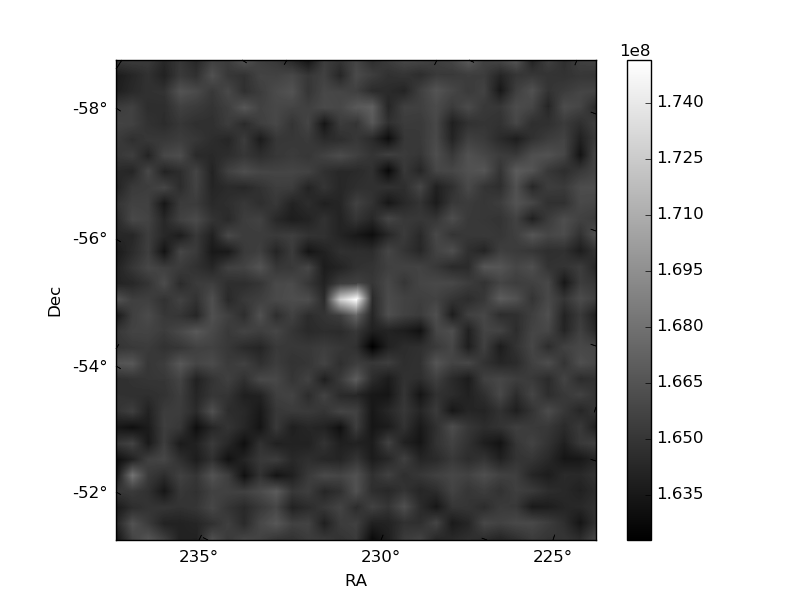
Histogram calculated using DETX and DETY for each event in the final _common_clean file
| Quadrant A | 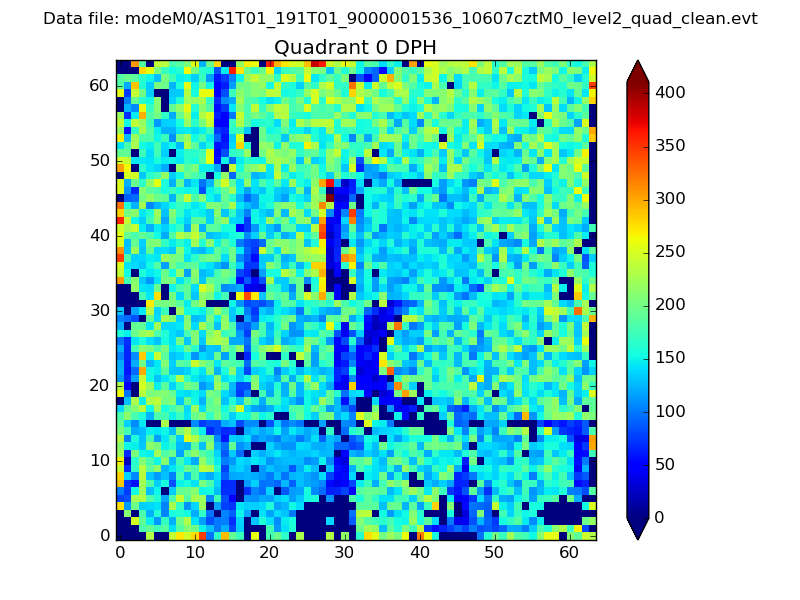 |
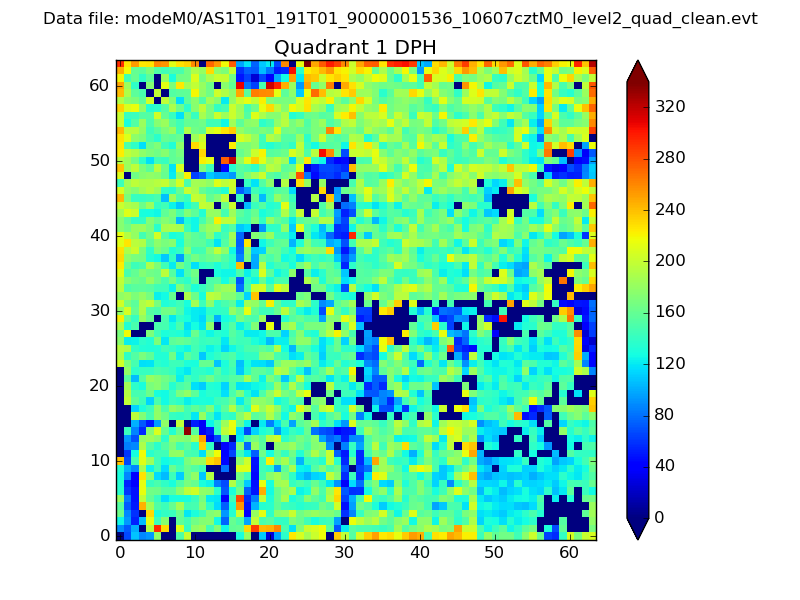 |
Quadrant B |
|---|---|---|---|
| Quadrant D | 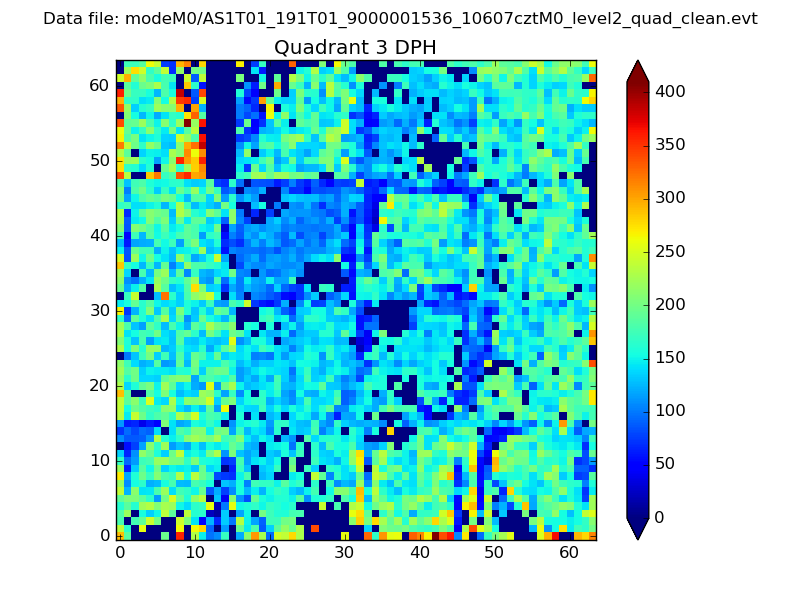 |
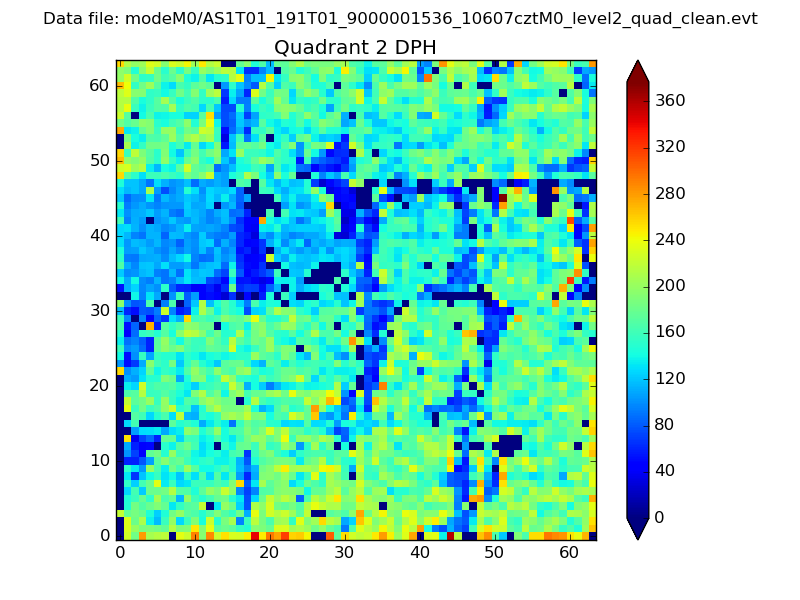 |
Quadrant C |
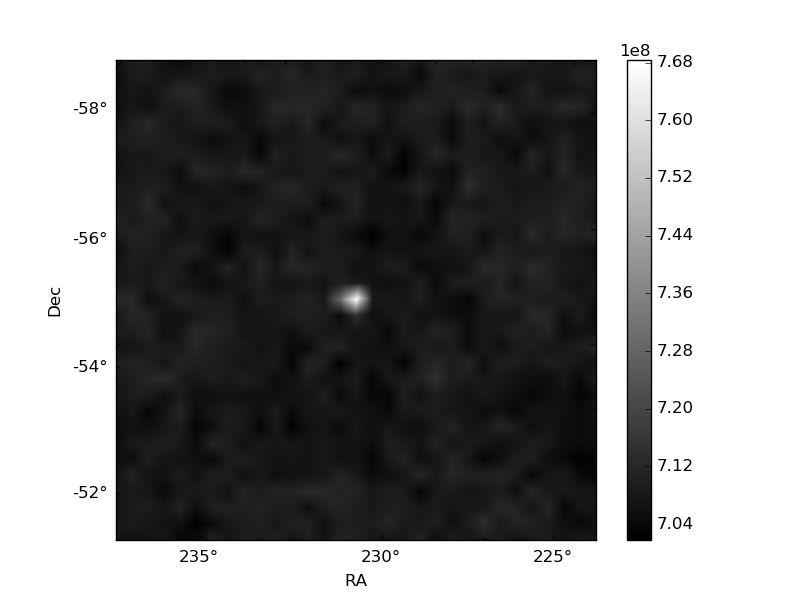
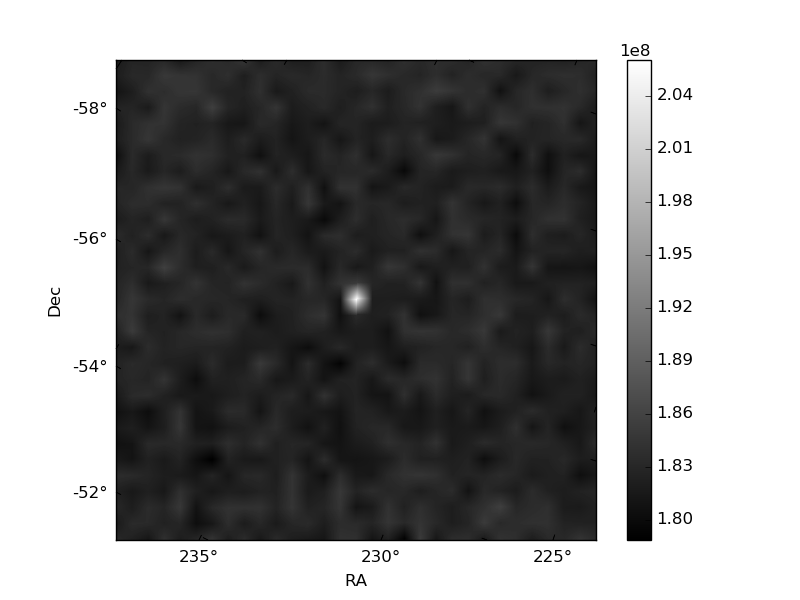
| Plot type | Count rate plots | Images |
|---|---|---|
| Comparison with Poisson distribution Blue bars denote a histogram of data divided into 1 sec bins. Red curve is a Poisson curve with rate = median count rate of data. |
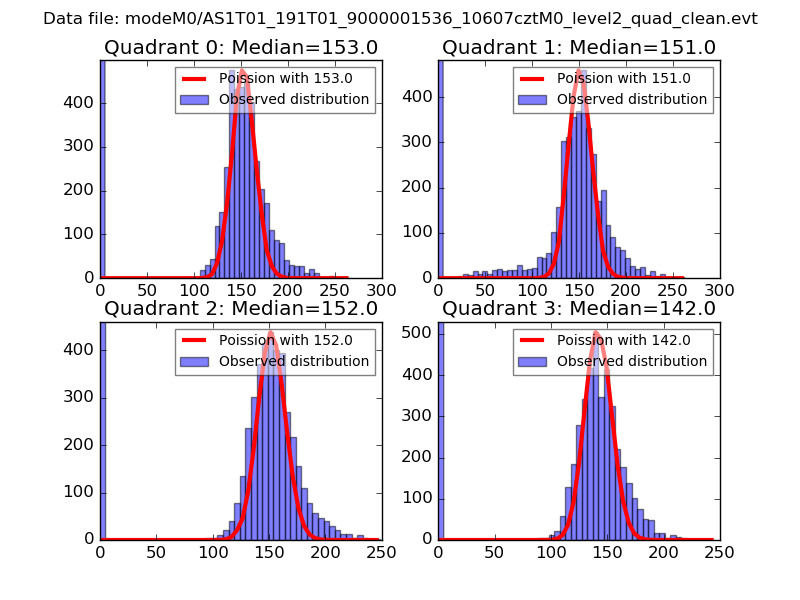 |
 |
| Quadrant-wise count rates Data is divided into 100 sec bins |
 |
|
| Module-wise count rates for Quadrant A Data is divided into 100 sec bins |
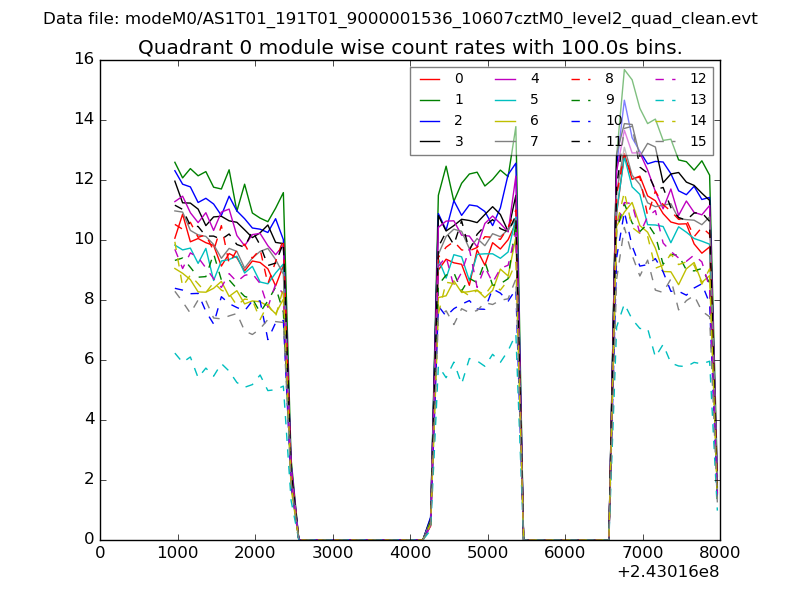 |
 |
| Module-wise count rates for Quadrant B Data is divided into 100 sec bins |
 |
 |
| Module-wise count rates for Quadrant C Data is divided into 100 sec bins |
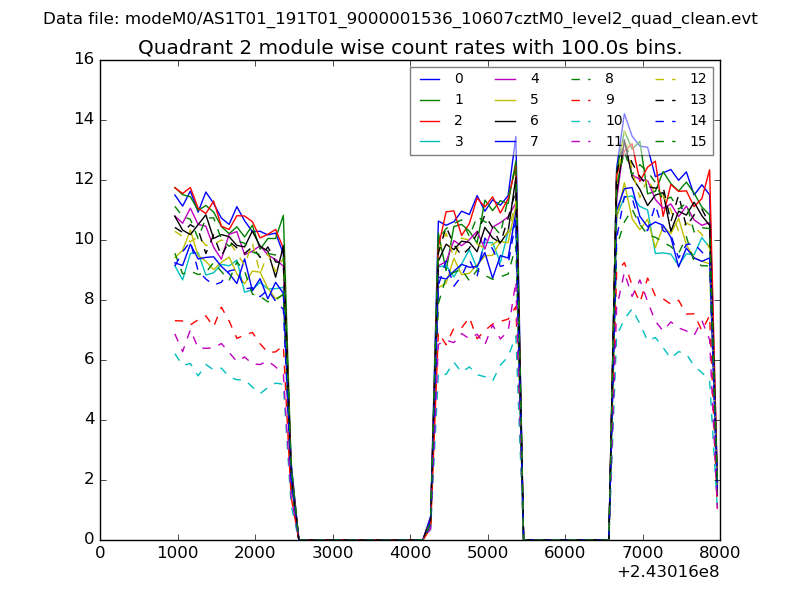 |
 |
| Module-wise count rates for Quadrant D Data is divided into 100 sec bins |
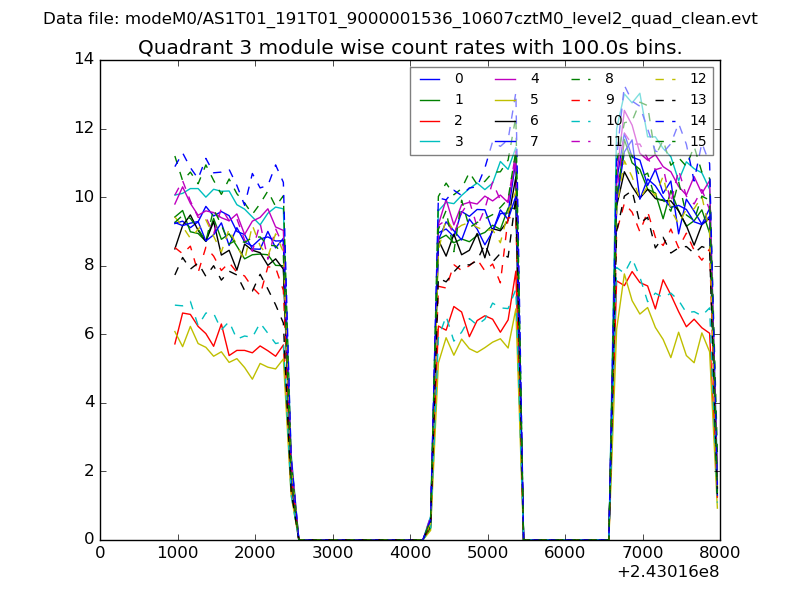 |
 |
| Parameter | Plot |
|---|---|
| CZT HV Monitor | 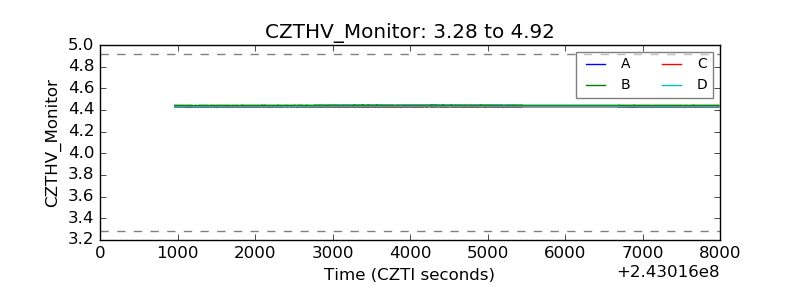 |
| D_VDD | 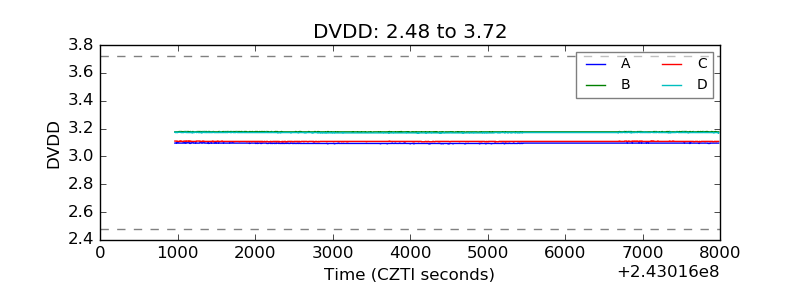 |
| Temperature 1 | 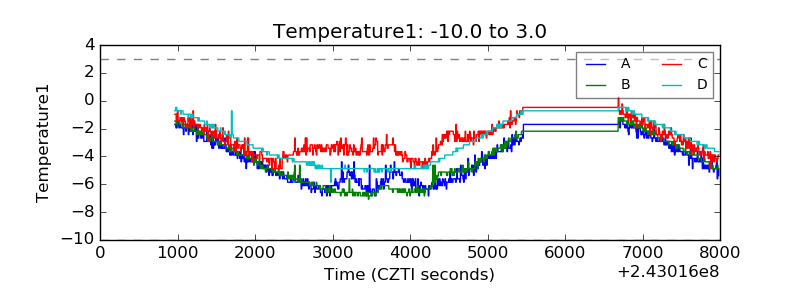 |
| Veto HV Monitor | 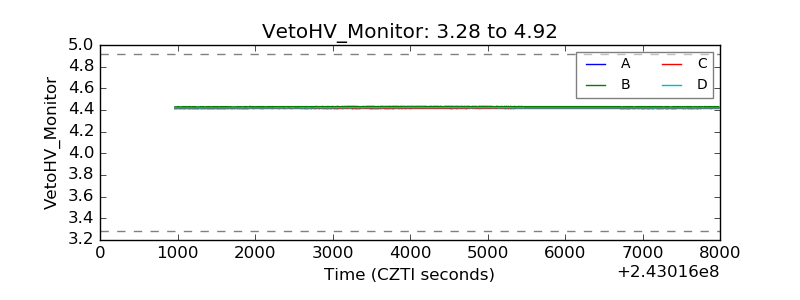 |
| Veto LLD | 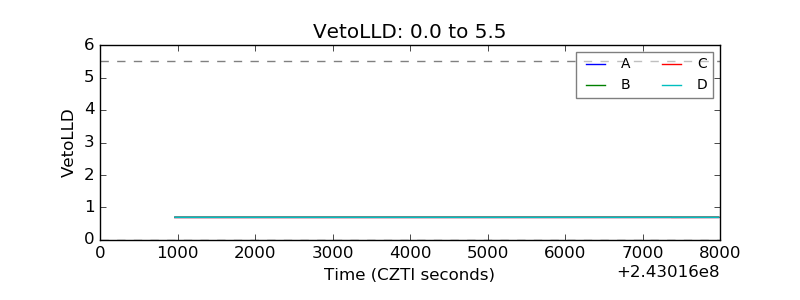 |
| Alpha Counter | 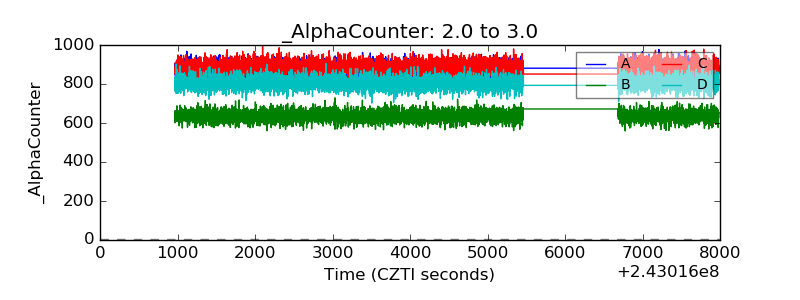 |
| _CPM_Rate | 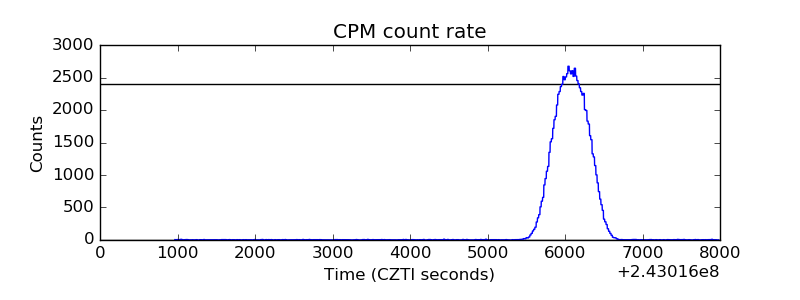 |
| CZT Counter | 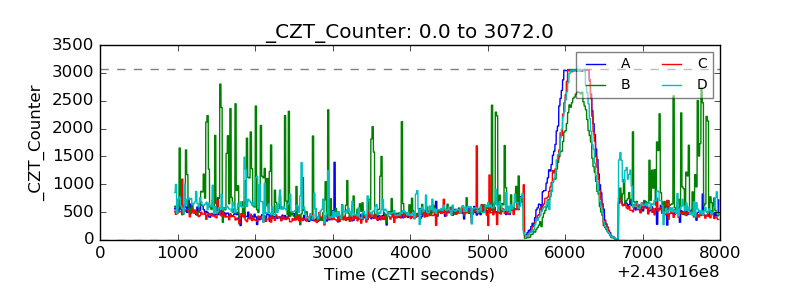 |
| +2.5 Volts monitor | 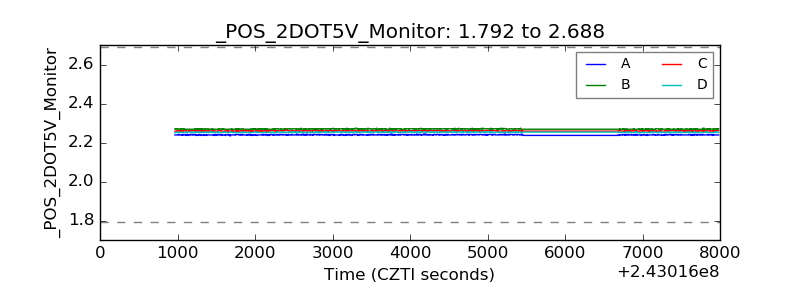 |
| +5 Volts monitor |  |
| _ROLL_ROT | 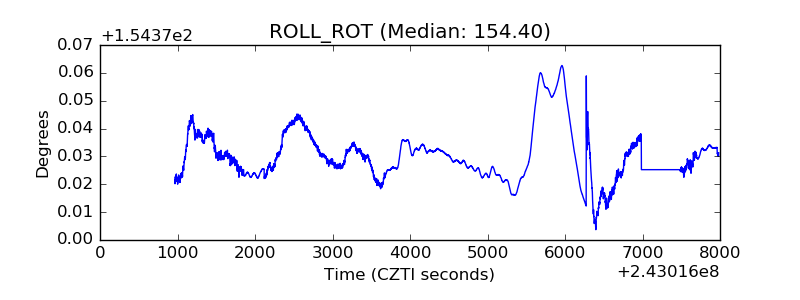 |
| _Roll_DEC | 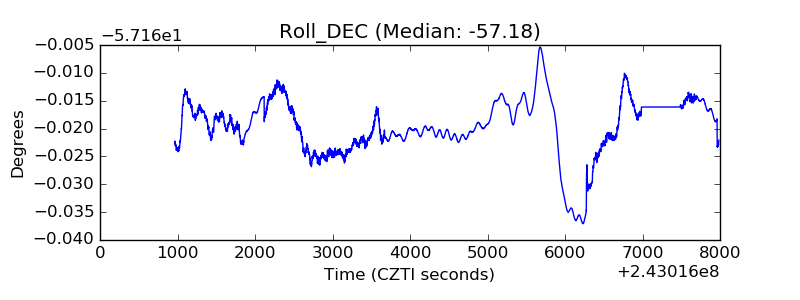 |
| _Roll_RA | 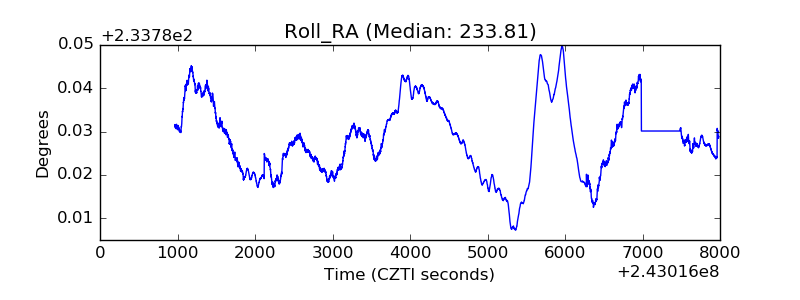 |
| Veto Counter | 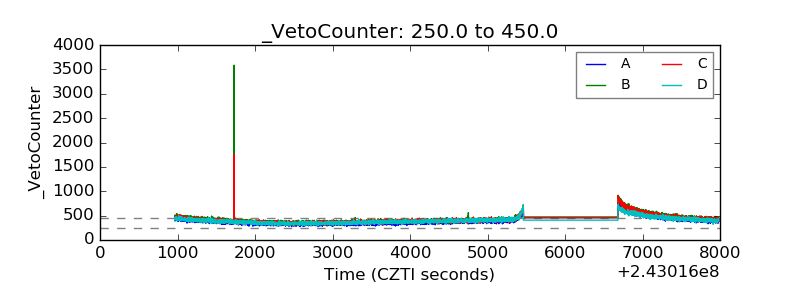 |