| Param | Original file | Final file |
|---|---|---|
| Filename | modeM0/AS1T01_191T01_9000001536_10608cztM0_level2.evt | modeM0/AS1T01_191T01_9000001536_10608cztM0_level2_quad_clean.evt |
| Size (bytes) | 426,856,320 | 84,594,240 |
| Size | 407.1 MB | 80.7 MB |
| Events in quadrant A | 2,652,977 | 563,850 |
| Events in quadrant B | 4,455,427 | 535,669 |
| Events in quadrant C | 2,533,323 | 559,770 |
| Events in quadrant D | 2,917,180 | 522,961 |
| Mode SS | |||
|---|---|---|---|
| Quadrant | BADHDUFLAG | Total packets | Discarded packets |
| A | 0 | 112 | 0 |
| B | 0 | 112 | 0 |
| C | 0 | 112 | 0 |
| D | 0 | 112 | 0 |
| Mode M9 | |||
|---|---|---|---|
| Quadrant | BADHDUFLAG | Total packets | Discarded packets |
| A | 0 | 13 | 0 |
| B | 0 | 13 | 0 |
| C | 0 | 13 | 0 |
| D | 0 | 13 | 0 |
| Mode M0 | |||
|---|---|---|---|
| Quadrant | BADHDUFLAG | Total packets | Discarded packets |
| A | 0 | 11328 | 2 |
| B | 0 | 16776 | 1 |
| C | 0 | 11109 | 1 |
| D | 0 | 12147 | 1 |
| Quadrant | Total seconds | Saturated seconds | Saturation percentage |
|---|---|---|---|
| A | 5413 | 19 | 0.351007% |
| B | 5413 | 581 | 10.733420% |
| C | 5413 | 4 | 0.073896% |
| D | 5413 | 10 | 0.184740% |
Noise dominated data is calculated using 1-second bins in cleaned event files. If a bin has >2000 counts, and if more than 50% of those come from <1% of pixels, then it is considered to be noise-dominated and hence unusable.
| Quadrant | # 1 sec bins | Bins with >0 counts | Bins with >2000 counts | High rate bins dominated by noise | Noise dominated (total time) | Noise dominated (detector-on time) | Marked lightcurve |
|---|---|---|---|---|---|---|---|
| A | 6738 | 5414 | 0 | 0 | 0.00% | 0.00% | 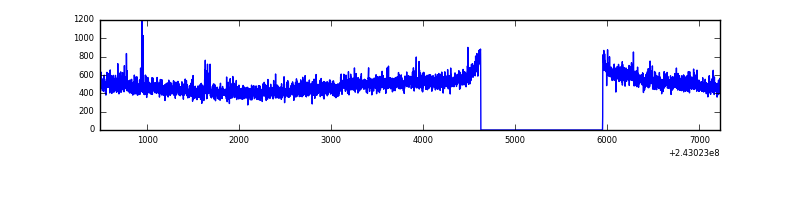 |
| B | 6738 | 5414 | 408 | 408 | 6.06% | 7.54% | 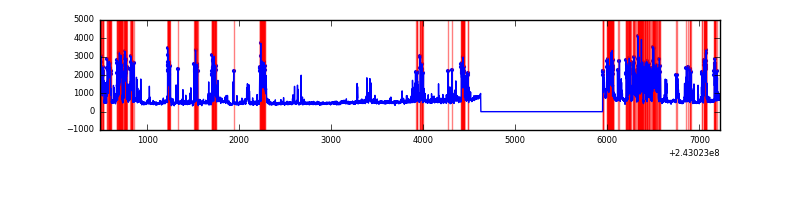 |
| C | 6738 | 5414 | 0 | 0 | 0.00% | 0.00% | 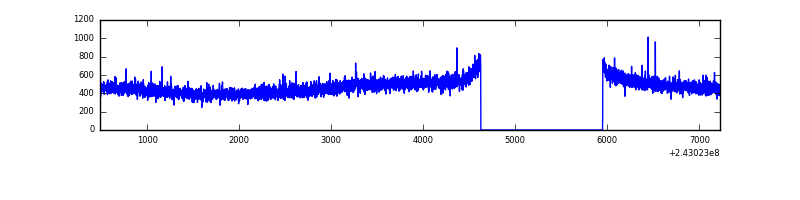 |
| D | 6738 | 5414 | 8 | 8 | 0.12% | 0.15% | 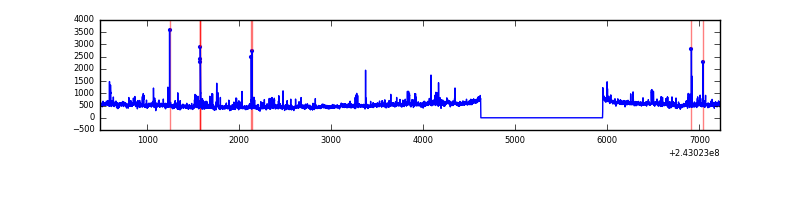 |
Top three noisy pixels from each quadrant. If the there are fewer than three noisy pixels in the level2.evt file, extra rows are filled as -1
| Pixel properties | Quadrant properties | ||||||
|---|---|---|---|---|---|---|---|
| Quadrant | DetID | PixID | Counts | Sigma | Mean | Median | Sigma |
| A | 1 | 162 | 29117 | 206.6 | 671 | 661 | 137.7 |
| A | 13 | 251 | 13335 | 92.02 | 671 | 661 | 137.7 |
| A | 1 | 178 | 10204 | 69.28 | 671 | 661 | 137.7 |
| B | 4 | 239 | 1691303 | 13580.29 | 653 | 640 | 124.5 |
| B | 0 | 219 | 127960 | 1022.7 | 653 | 640 | 124.5 |
| B | 4 | 81 | 38104 | 300.93 | 653 | 640 | 124.5 |
| C | 14 | 67 | 5564 | 32.89 | 646 | 654 | 149.3 |
| C | 13 | 61 | 4845 | 28.08 | 646 | 654 | 149.3 |
| C | 8 | 128 | 3607 | 19.78 | 646 | 654 | 149.3 |
| D | 2 | 16 | 263947 | 1678.23 | 638 | 623 | 156.9 |
| D | 1 | 52 | 96558 | 611.42 | 638 | 623 | 156.9 |
| D | 13 | 104 | 37138 | 232.72 | 638 | 623 | 156.9 |
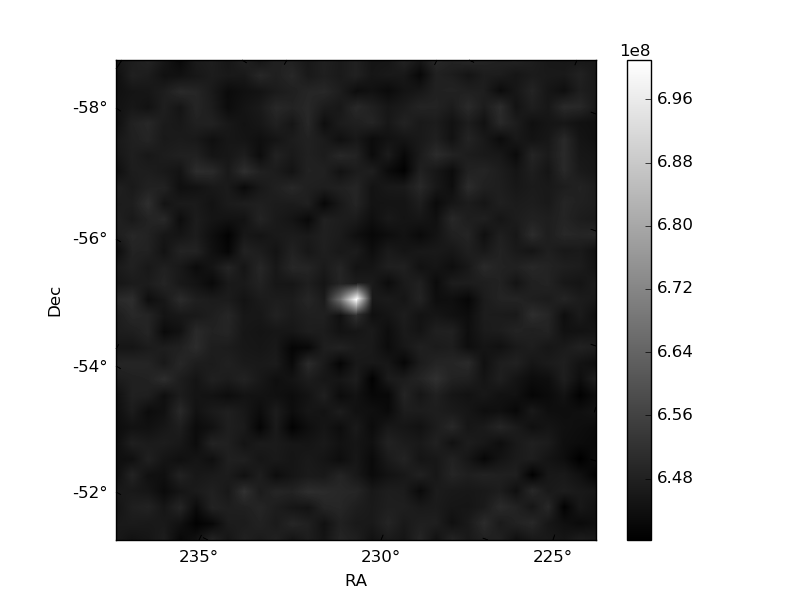
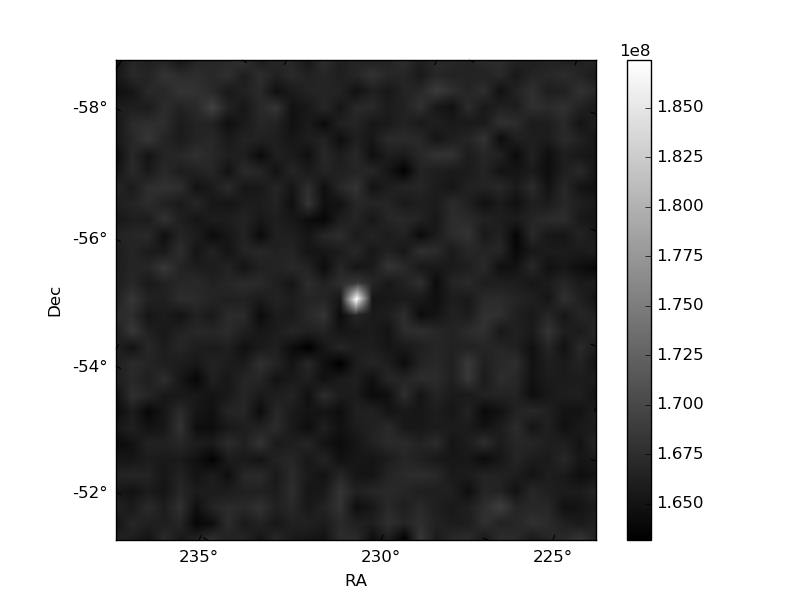
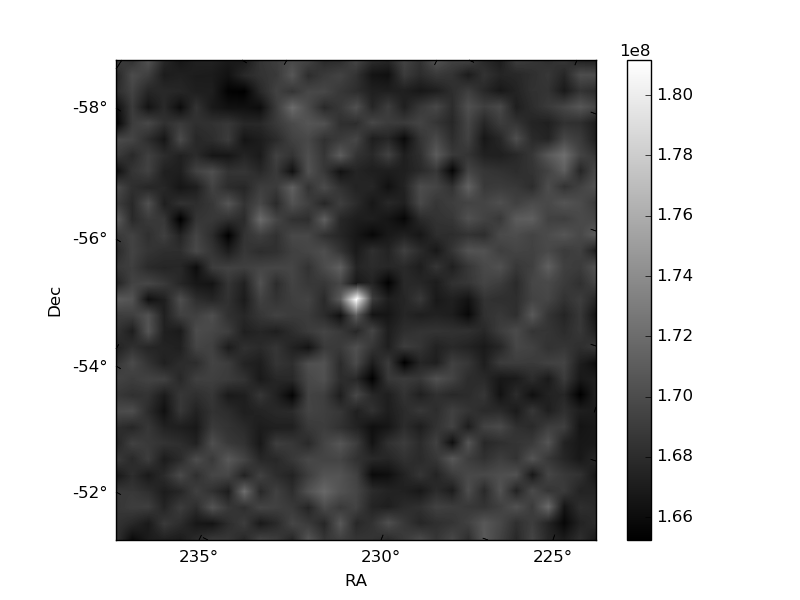
Histogram calculated using DETX and DETY for each event in the final _common_clean file
| Quadrant A | 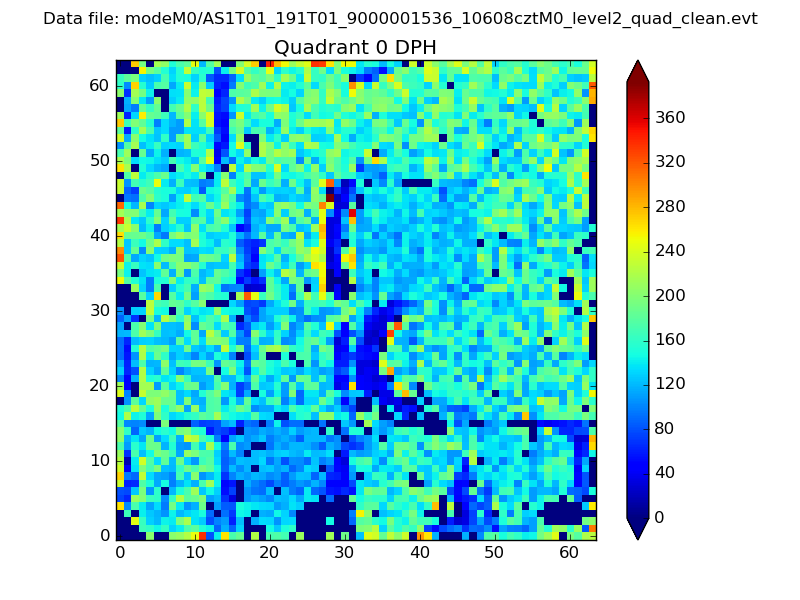 |
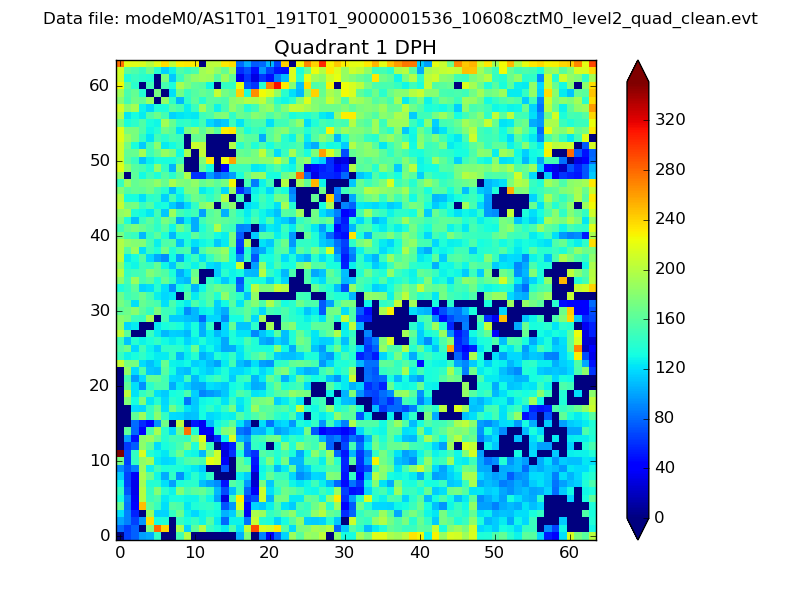 |
Quadrant B |
|---|---|---|---|
| Quadrant D | 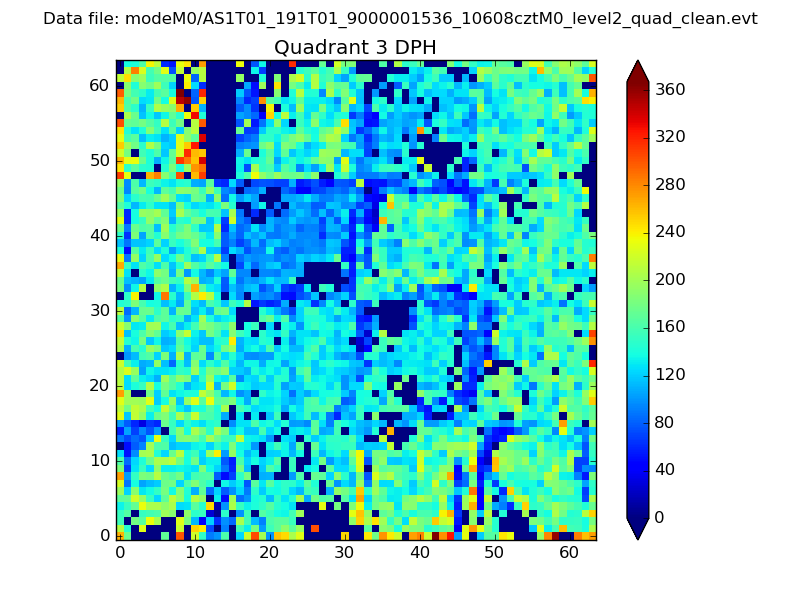 |
 |
Quadrant C |
| Plot type | Count rate plots | Images |
|---|---|---|
| Comparison with Poisson distribution Blue bars denote a histogram of data divided into 1 sec bins. Red curve is a Poisson curve with rate = median count rate of data. |
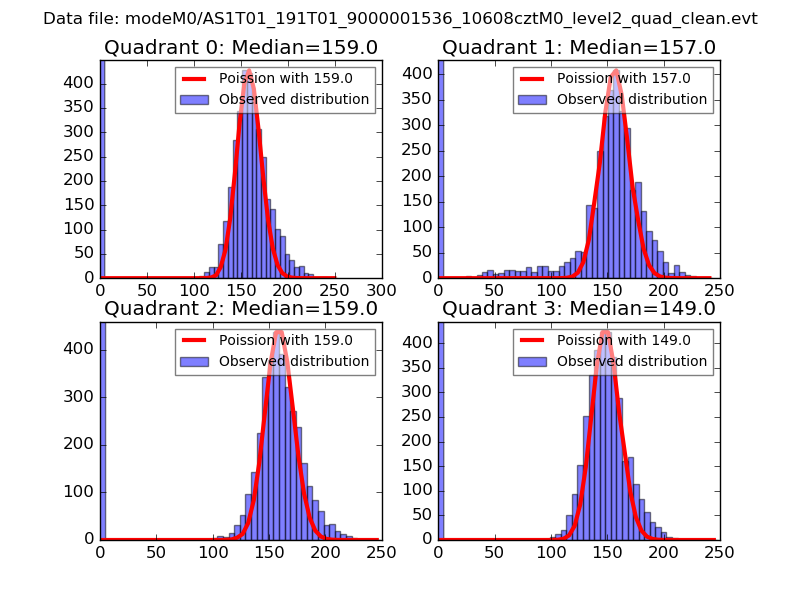 |
 |
| Quadrant-wise count rates Data is divided into 100 sec bins |
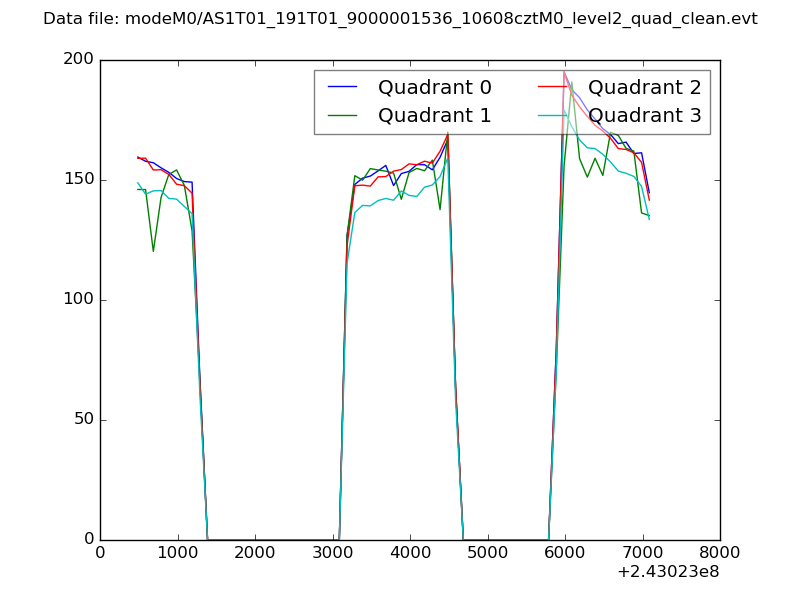 |
|
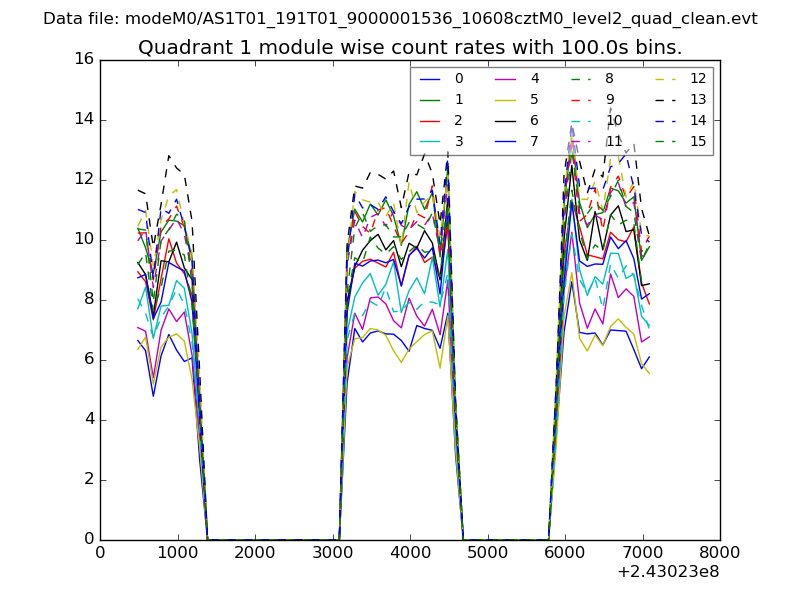
| Module-wise count rates for Quadrant A Data is divided into 100 sec bins |
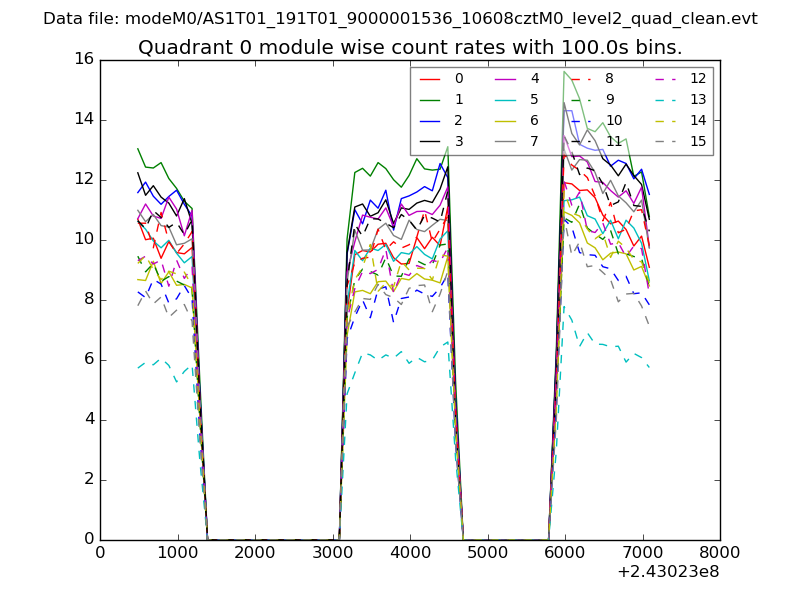 |
 |
| Module-wise count rates for Quadrant B Data is divided into 100 sec bins |
 |
 |
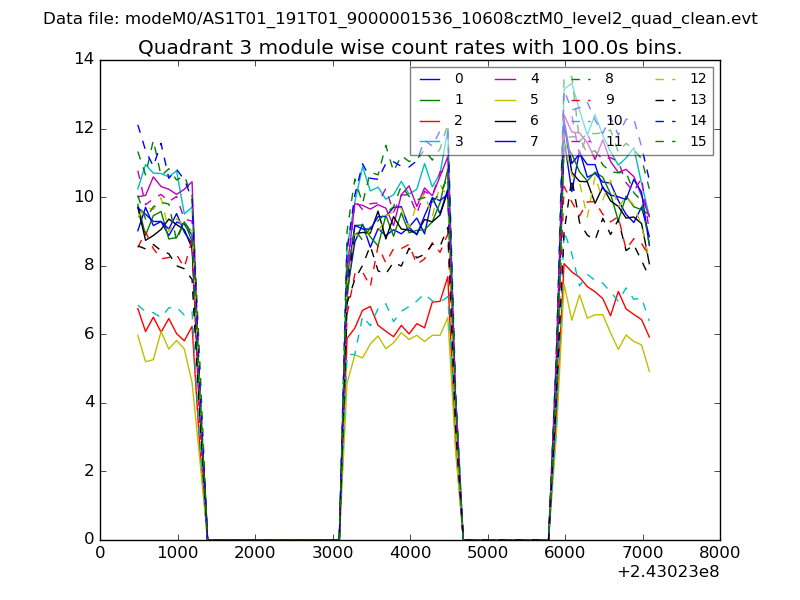
| Module-wise count rates for Quadrant C Data is divided into 100 sec bins |
 |
 |
| Module-wise count rates for Quadrant D Data is divided into 100 sec bins |
 |
 |
| Parameter | Plot |
|---|---|
| CZT HV Monitor | 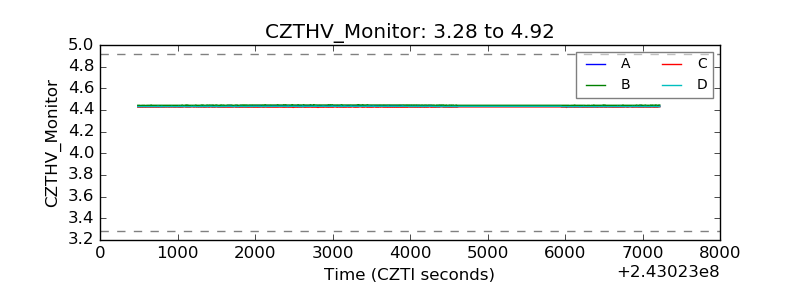 |
| D_VDD | 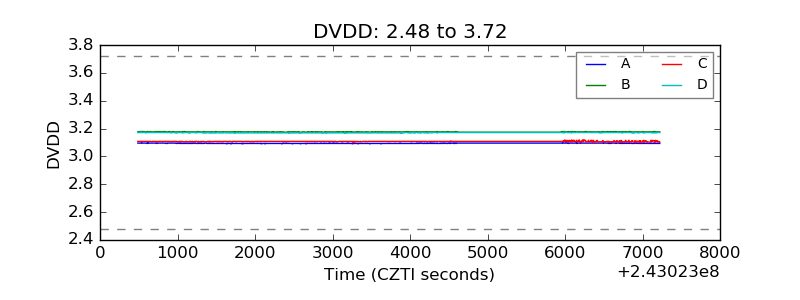 |
| Temperature 1 | 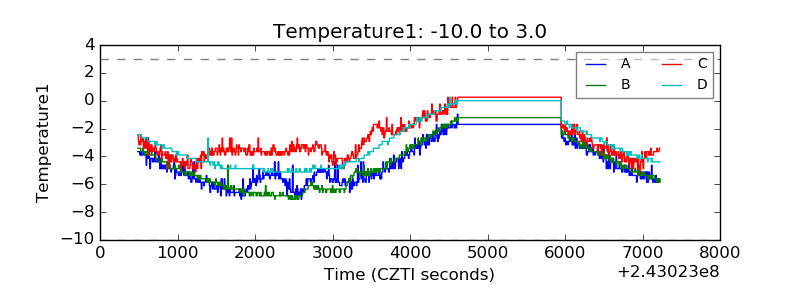 |
| Veto HV Monitor | 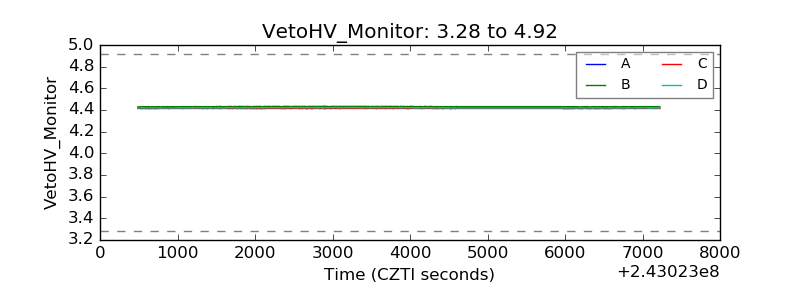 |
| Veto LLD | 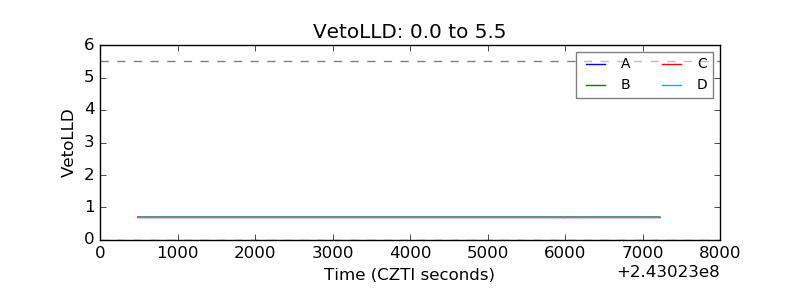 |
| Alpha Counter | 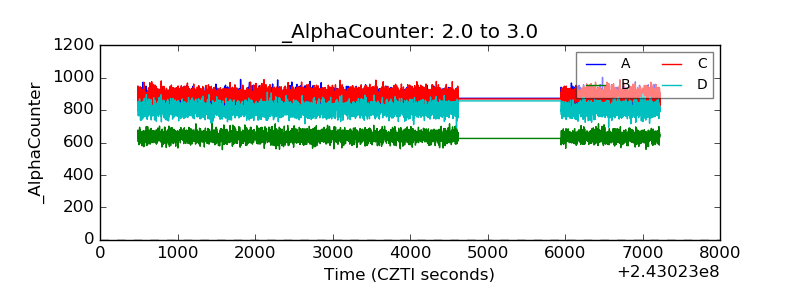 |
| _CPM_Rate | 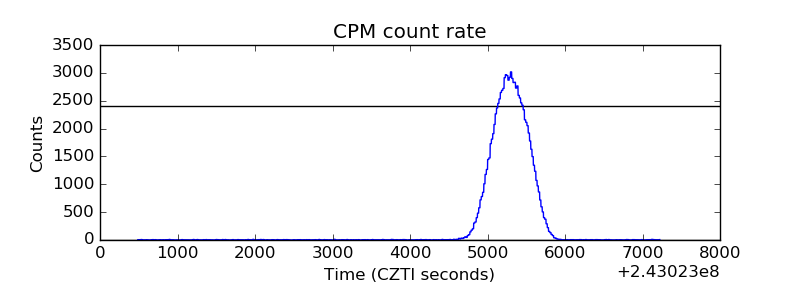 |
| CZT Counter |  |
| +2.5 Volts monitor | 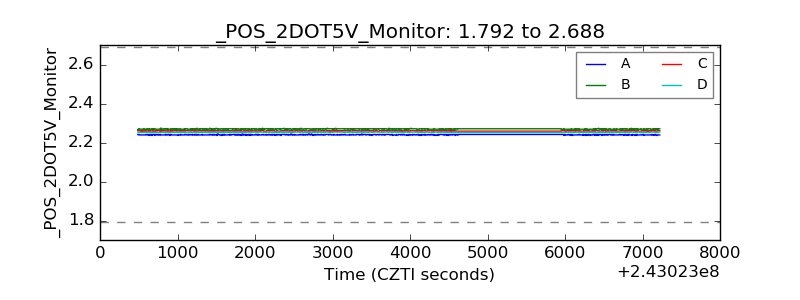 |
| +5 Volts monitor |  |
| _ROLL_ROT | 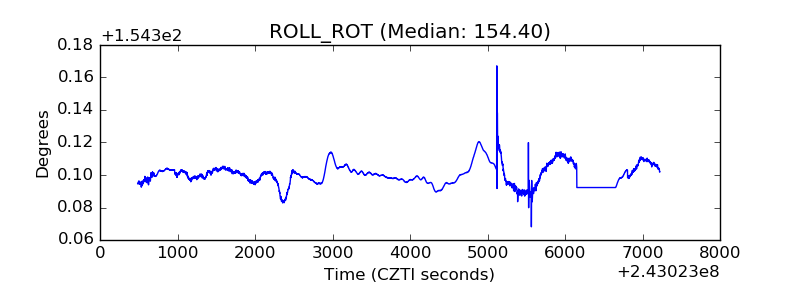 |
| _Roll_DEC | 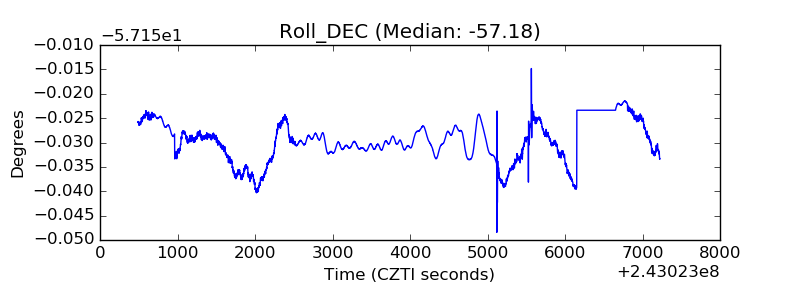 |
| _Roll_RA | 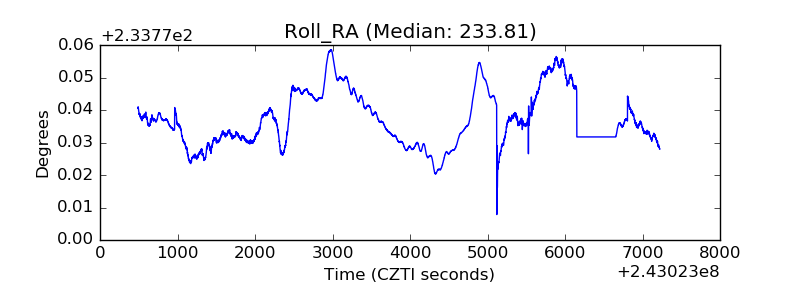 |
| Veto Counter | 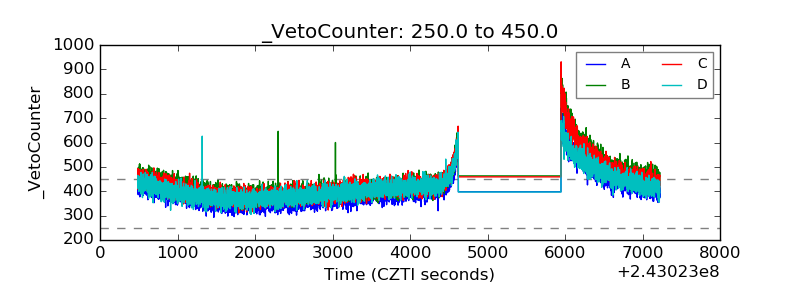 |