| Param | Original file | Final file |
|---|---|---|
| Filename | modeM0/AS1T01_191T01_9000001536_10609cztM0_level2.evt | modeM0/AS1T01_191T01_9000001536_10609cztM0_level2_quad_clean.evt |
| Size (bytes) | 392,316,480 | 77,160,960 |
| Size | 374.1 MB | 73.6 MB |
| Events in quadrant A | 2,550,612 | 505,772 |
| Events in quadrant B | 3,717,161 | 495,277 |
| Events in quadrant C | 2,441,510 | 503,792 |
| Events in quadrant D | 2,822,388 | 471,438 |
| Mode SS | |||
|---|---|---|---|
| Quadrant | BADHDUFLAG | Total packets | Discarded packets |
| A | 0 | 110 | 2 |
| B | 0 | 110 | 2 |
| C | 0 | 110 | 2 |
| D | 0 | 110 | 0 |
| Mode M9 | |||
|---|---|---|---|
| Quadrant | BADHDUFLAG | Total packets | Discarded packets |
| A | 0 | 13 | 0 |
| B | 0 | 13 | 0 |
| C | 0 | 13 | 0 |
| D | 0 | 13 | 0 |
| Mode M0 | |||
|---|---|---|---|
| Quadrant | BADHDUFLAG | Total packets | Discarded packets |
| A | 0 | 10978 | 244 |
| B | 0 | 14778 | 431 |
| C | 0 | 10758 | 267 |
| D | 0 | 11968 | 253 |
| Quadrant | Total seconds | Saturated seconds | Saturation percentage |
|---|---|---|---|
| A | 5142 | 12 | 0.233372% |
| B | 5102 | 323 | 6.330851% |
| C | 5130 | 4 | 0.077973% |
| D | 5138 | 20 | 0.389257% |
Noise dominated data is calculated using 1-second bins in cleaned event files. If a bin has >2000 counts, and if more than 50% of those come from <1% of pixels, then it is considered to be noise-dominated and hence unusable.
| Quadrant | # 1 sec bins | Bins with >0 counts | Bins with >2000 counts | High rate bins dominated by noise | Noise dominated (total time) | Noise dominated (detector-on time) | Marked lightcurve |
|---|---|---|---|---|---|---|---|
| A | 6653 | 5214 | 0 | 0 | 0.00% | 0.00% |  |
| B | 6653 | 5188 | 192 | 192 | 2.89% | 3.70% | 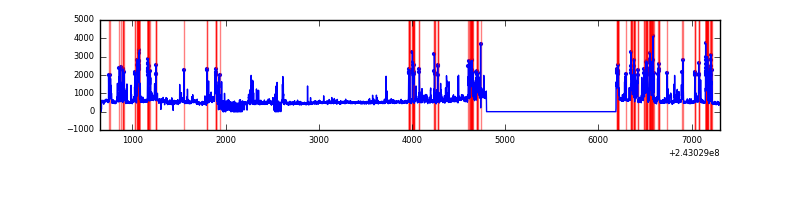 |
| C | 6653 | 5217 | 0 | 0 | 0.00% | 0.00% | 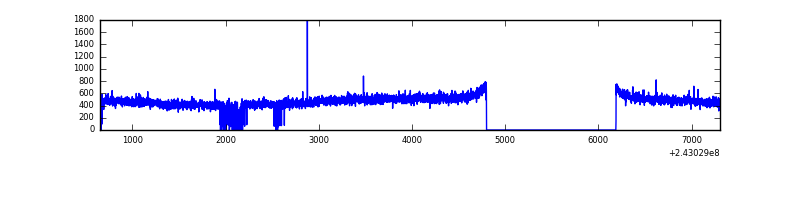 |
| D | 6653 | 5216 | 15 | 15 | 0.23% | 0.29% |  |
Top three noisy pixels from each quadrant. If the there are fewer than three noisy pixels in the level2.evt file, extra rows are filled as -1
| Pixel properties | Quadrant properties | ||||||
|---|---|---|---|---|---|---|---|
| Quadrant | DetID | PixID | Counts | Sigma | Mean | Median | Sigma |
| A | 1 | 162 | 24306 | 179.56 | 644 | 635 | 131.8 |
| A | 13 | 251 | 21883 | 161.18 | 644 | 635 | 131.8 |
| A | 1 | 178 | 7789 | 54.27 | 644 | 635 | 131.8 |
| B | 4 | 239 | 1013014 | 8445.6 | 634 | 622 | 119.9 |
| B | 0 | 219 | 134541 | 1117.18 | 634 | 622 | 119.9 |
| B | 0 | 214 | 35001 | 286.8 | 634 | 622 | 119.9 |
| C | 13 | 61 | 4715 | 28.24 | 623 | 632 | 144.6 |
| C | 14 | 234 | 4120 | 24.12 | 623 | 632 | 144.6 |
| C | 8 | 128 | 2799 | 14.99 | 623 | 632 | 144.6 |
| D | 2 | 16 | 201410 | 1343.64 | 611 | 595 | 149.5 |
| D | 8 | 195 | 103712 | 689.95 | 611 | 595 | 149.5 |
| D | 1 | 52 | 90032 | 598.42 | 611 | 595 | 149.5 |
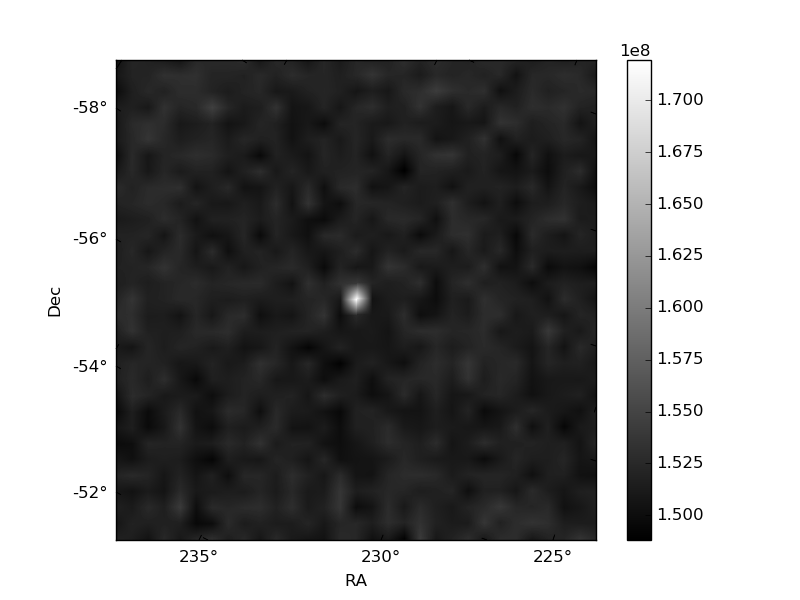
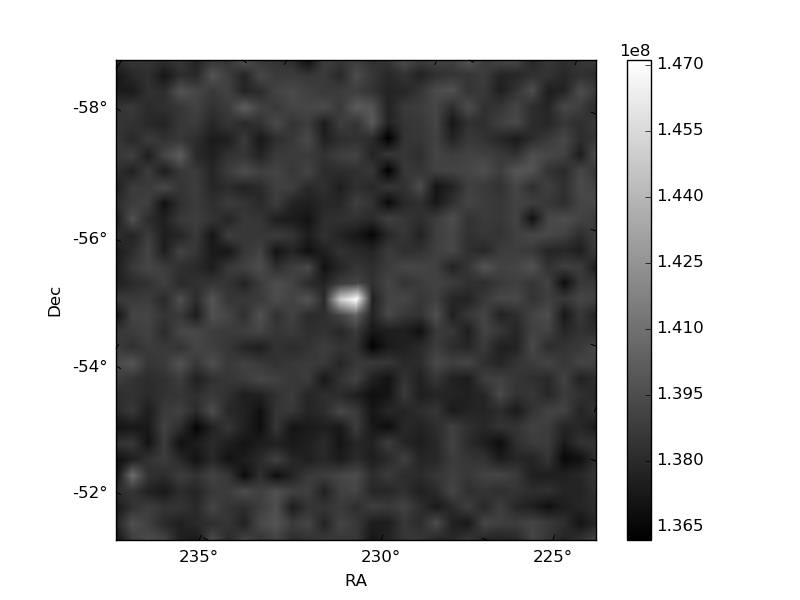
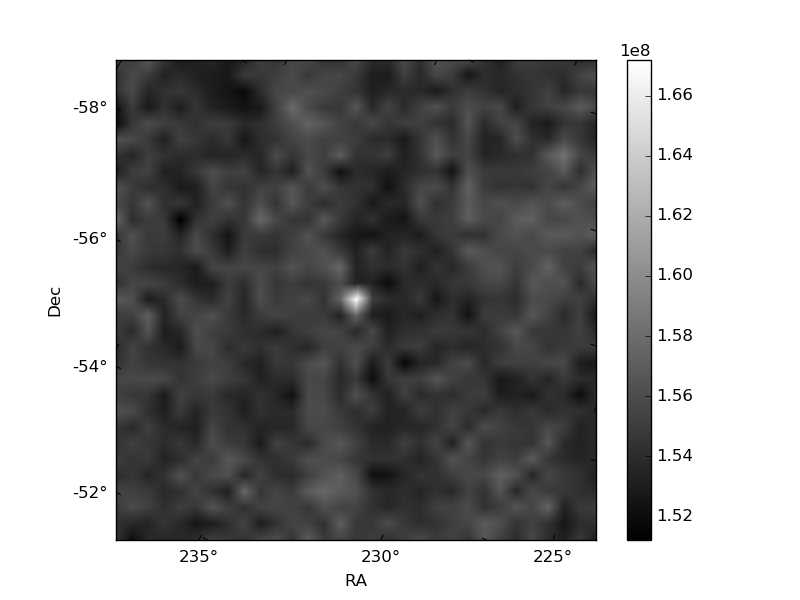
Histogram calculated using DETX and DETY for each event in the final _common_clean file
| Quadrant A | 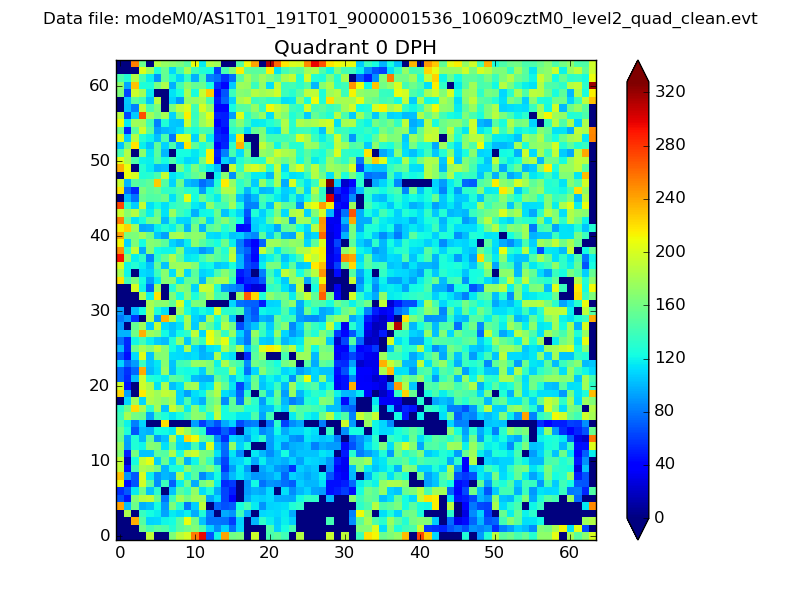 |
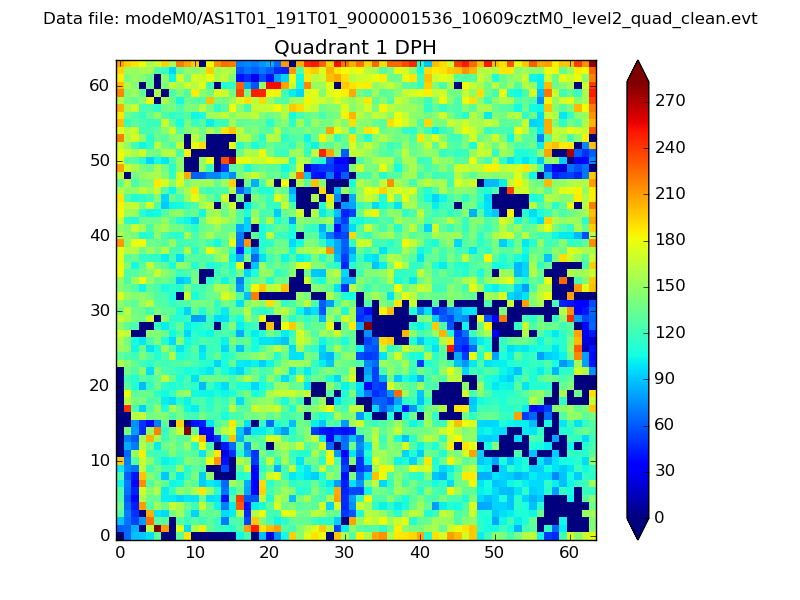 |
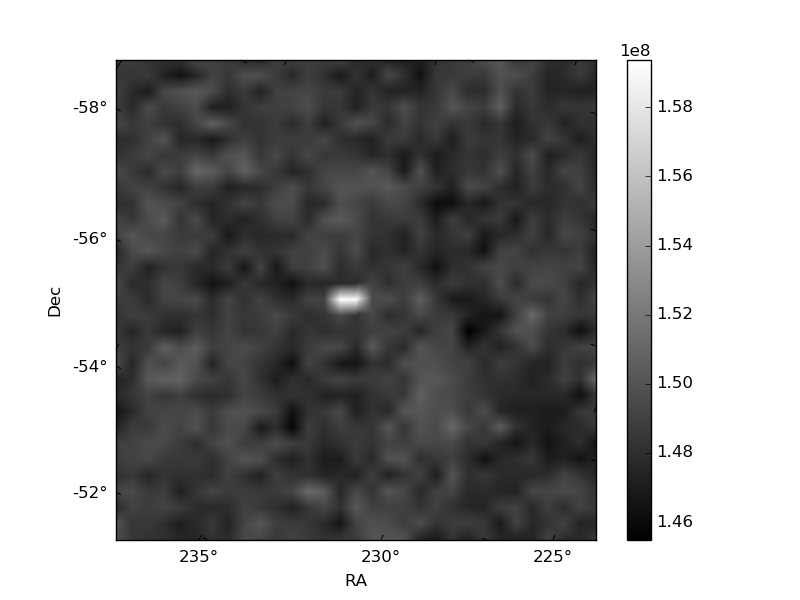
Quadrant B |
|---|---|---|---|
| Quadrant D | 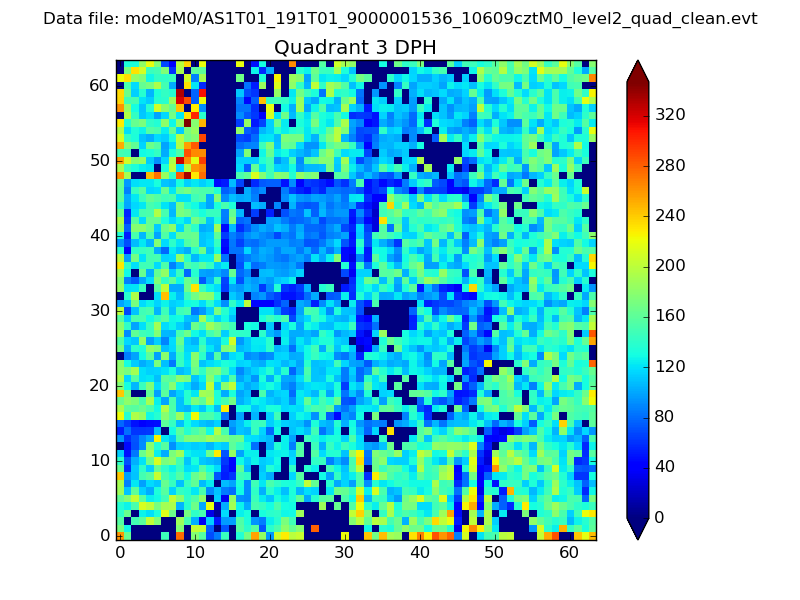 |
 |
Quadrant C |
| Plot type | Count rate plots | Images |
|---|---|---|
| Comparison with Poisson distribution Blue bars denote a histogram of data divided into 1 sec bins. Red curve is a Poisson curve with rate = median count rate of data. |
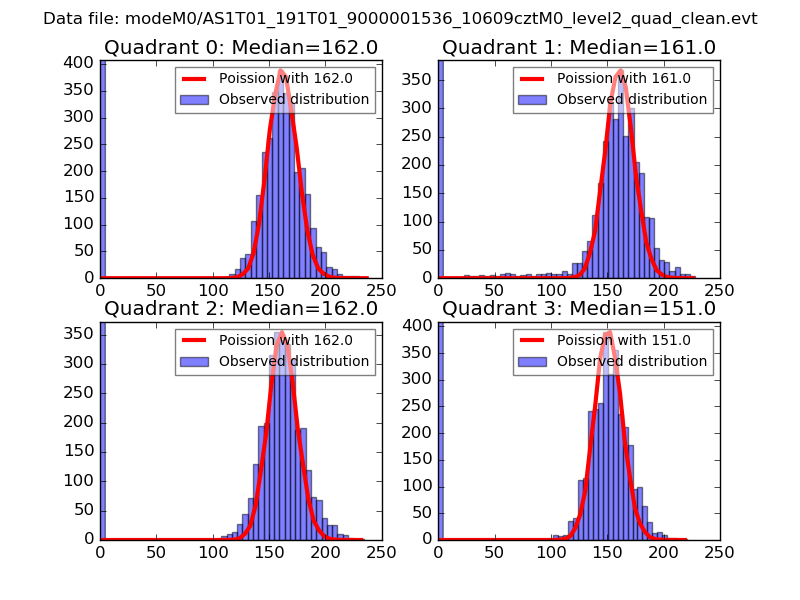 |
 |
| Quadrant-wise count rates Data is divided into 100 sec bins |
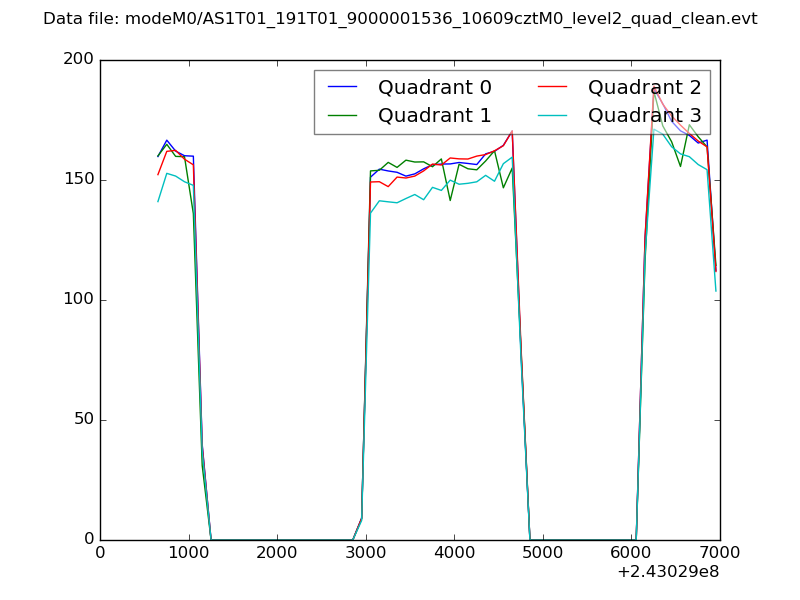 |
|
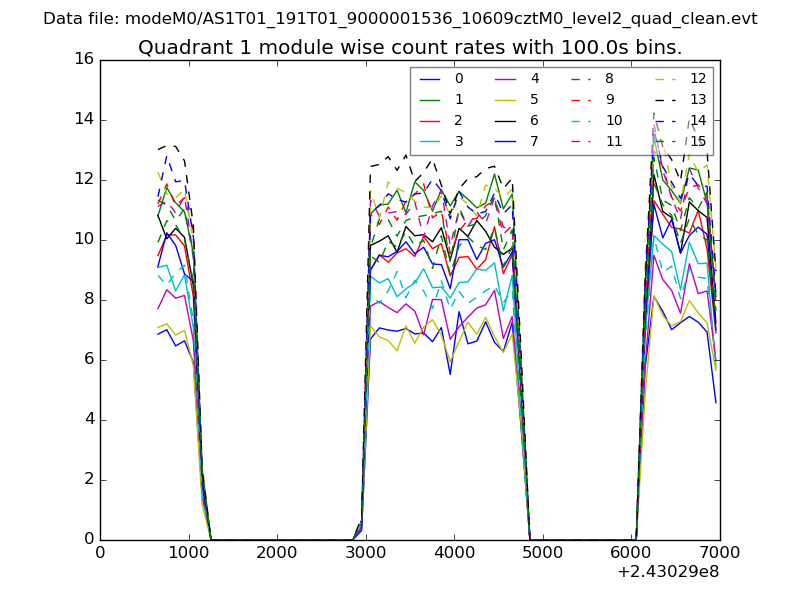
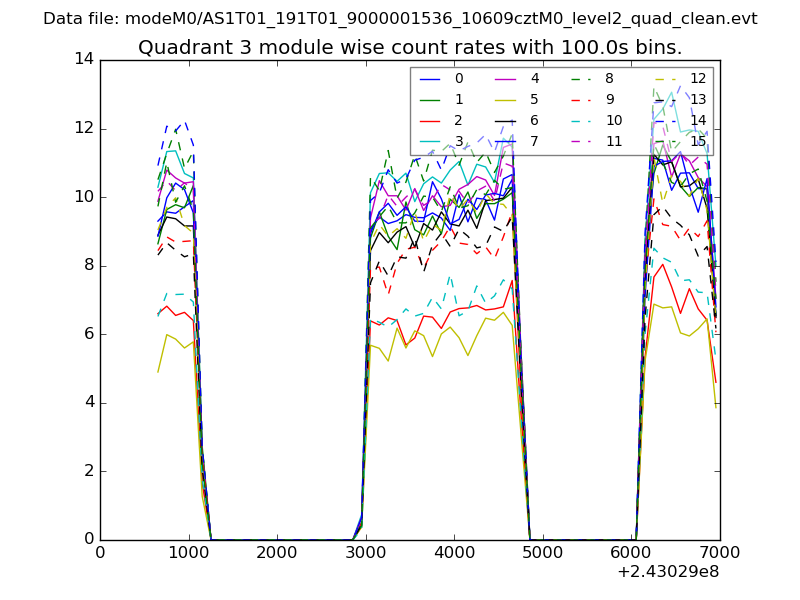
| Module-wise count rates for Quadrant A Data is divided into 100 sec bins |
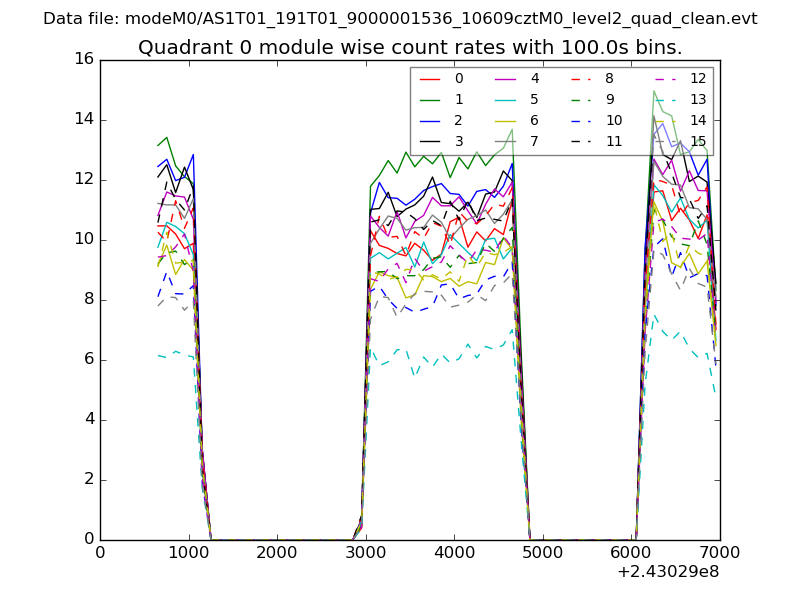 |
 |
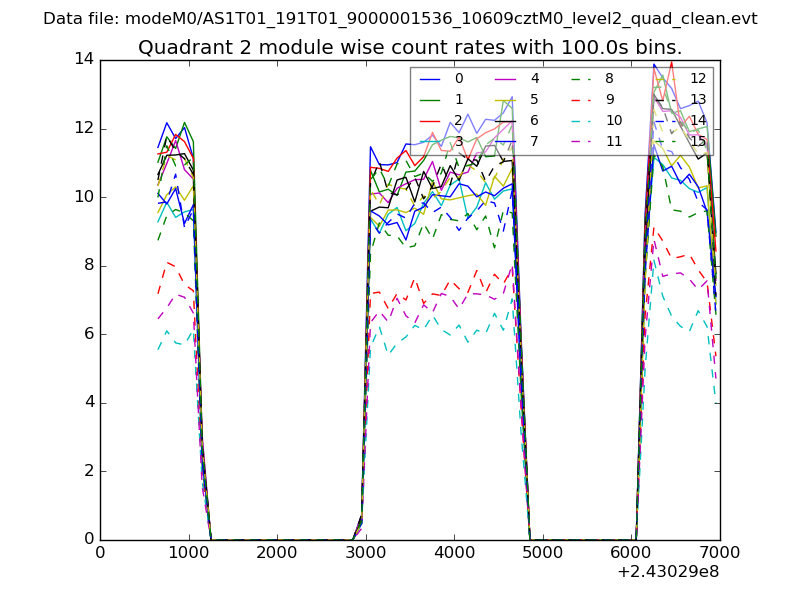
| Module-wise count rates for Quadrant B Data is divided into 100 sec bins |
 |
 |
| Module-wise count rates for Quadrant C Data is divided into 100 sec bins |
 |
 |
| Module-wise count rates for Quadrant D Data is divided into 100 sec bins |
 |
 |
| Parameter | Plot |
|---|---|
| CZT HV Monitor | 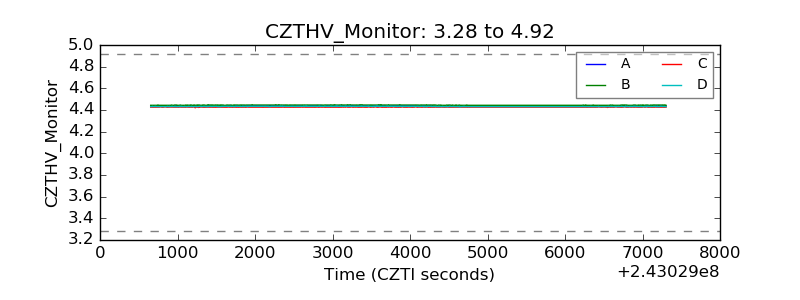 |
| D_VDD | 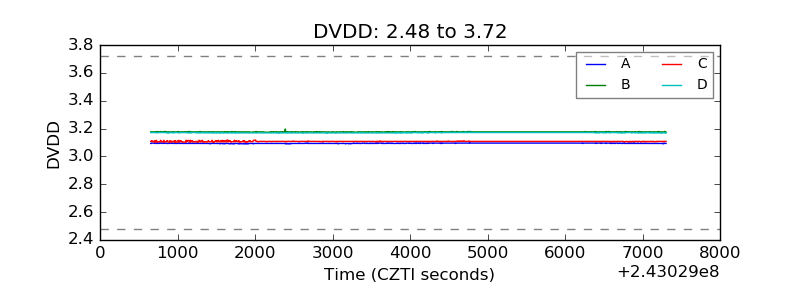 |
| Temperature 1 | 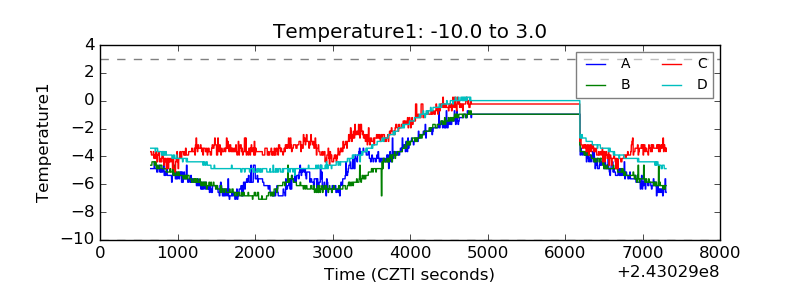 |
| Veto HV Monitor | 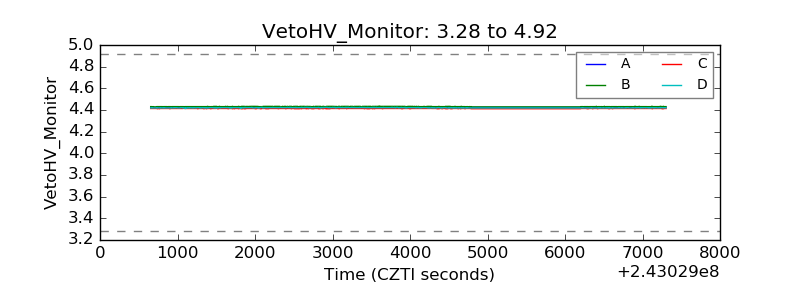 |
| Veto LLD | 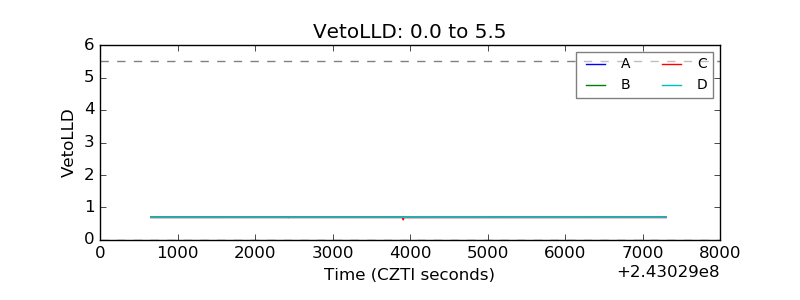 |
| Alpha Counter | 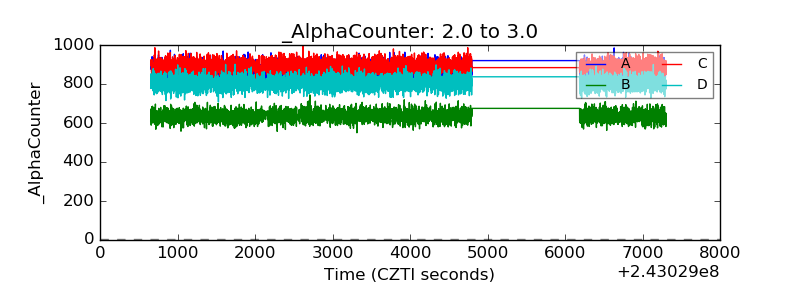 |
| _CPM_Rate | 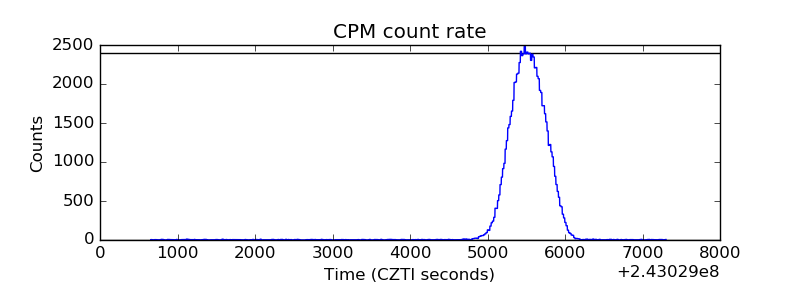 |
| CZT Counter |  |
| +2.5 Volts monitor | 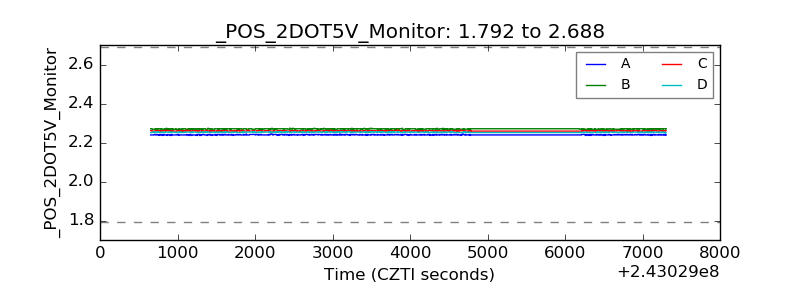 |
| +5 Volts monitor |  |
| _ROLL_ROT | 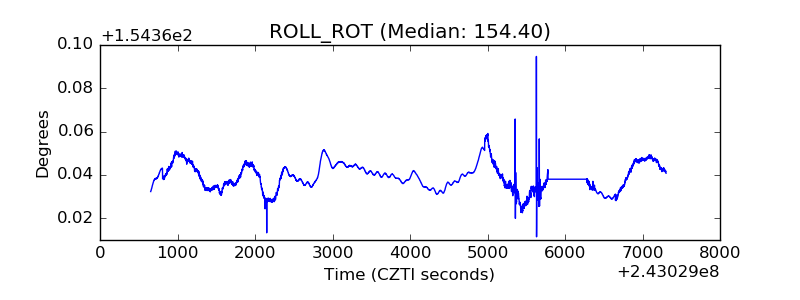 |
| _Roll_DEC | 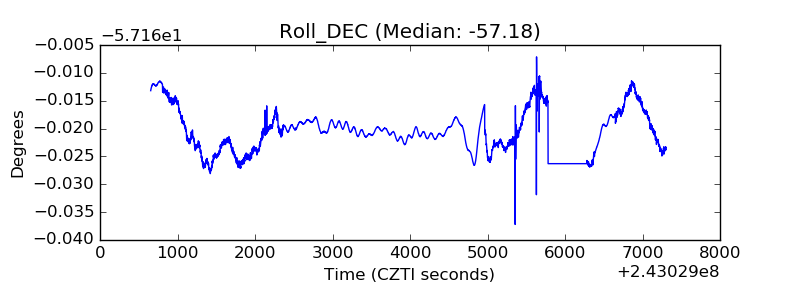 |
| _Roll_RA | 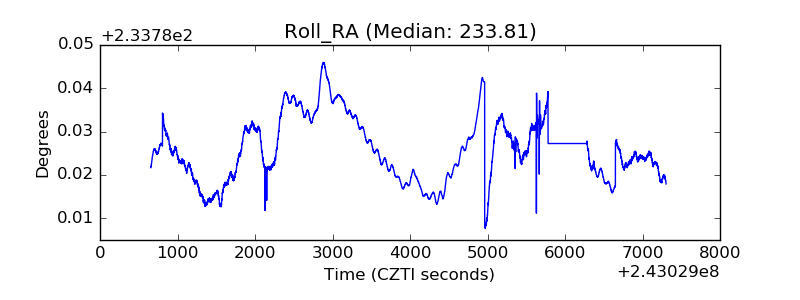 |
| Veto Counter | 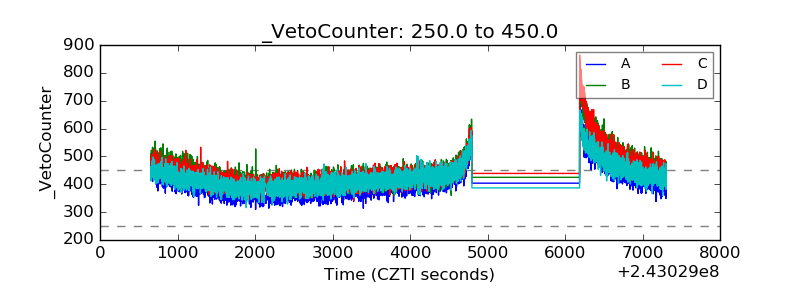 |