| Param | Original file | Final file |
|---|---|---|
| Filename | modeM0/AS1T01_191T01_9000001536_10610cztM0_level2.evt | modeM0/AS1T01_191T01_9000001536_10610cztM0_level2_quad_clean.evt |
| Size (bytes) | 472,052,160 | 83,459,520 |
| Size | 450.2 MB | 79.6 MB |
| Events in quadrant A | 2,923,867 | 540,063 |
| Events in quadrant B | 4,492,881 | 519,390 |
| Events in quadrant C | 2,848,149 | 543,679 |
| Events in quadrant D | 3,622,913 | 503,913 |
| Mode SS | |||
|---|---|---|---|
| Quadrant | BADHDUFLAG | Total packets | Discarded packets |
| A | 0 | 122 | 0 |
| B | 0 | 122 | 0 |
| C | 0 | 122 | 0 |
| D | 0 | 122 | 0 |
| Mode M9 | |||
|---|---|---|---|
| Quadrant | BADHDUFLAG | Total packets | Discarded packets |
| A | 0 | 14 | 0 |
| B | 0 | 14 | 0 |
| C | 0 | 14 | 0 |
| D | 0 | 14 | 0 |
| Mode M0 | |||
|---|---|---|---|
| Quadrant | BADHDUFLAG | Total packets | Discarded packets |
| A | 0 | 12436 | 2 |
| B | 0 | 17231 | 1 |
| C | 0 | 12261 | 1 |
| D | 0 | 14696 | 1 |
| Quadrant | Total seconds | Saturated seconds | Saturation percentage |
|---|---|---|---|
| A | 6015 | 11 | 0.182876% |
| B | 6015 | 472 | 7.847049% |
| C | 6015 | 5 | 0.083126% |
| D | 6015 | 10 | 0.166251% |
Noise dominated data is calculated using 1-second bins in cleaned event files. If a bin has >2000 counts, and if more than 50% of those come from <1% of pixels, then it is considered to be noise-dominated and hence unusable.
| Quadrant | # 1 sec bins | Bins with >0 counts | Bins with >2000 counts | High rate bins dominated by noise | Noise dominated (total time) | Noise dominated (detector-on time) | Marked lightcurve |
|---|---|---|---|---|---|---|---|
| A | 7375 | 6016 | 0 | 0 | 0.00% | 0.00% | 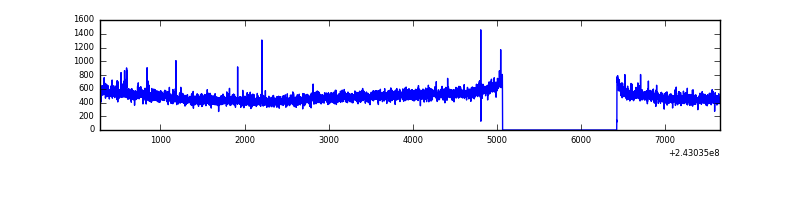 |
| B | 7375 | 6016 | 301 | 301 | 4.08% | 5.00% | 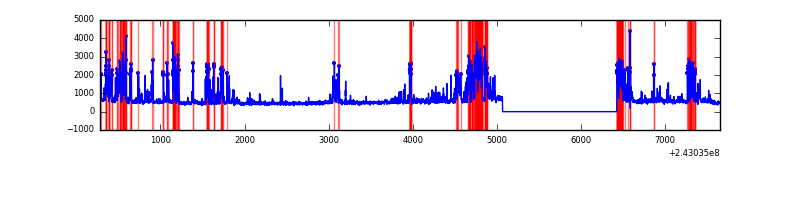 |
| C | 7375 | 6016 | 0 | 0 | 0.00% | 0.00% | 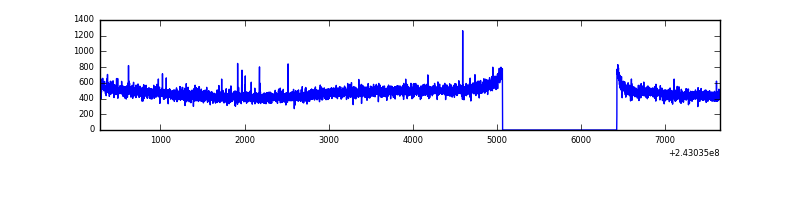 |
| D | 7375 | 6016 | 6 | 6 | 0.08% | 0.10% |  |
Top three noisy pixels from each quadrant. If the there are fewer than three noisy pixels in the level2.evt file, extra rows are filled as -1
| Pixel properties | Quadrant properties | ||||||
|---|---|---|---|---|---|---|---|
| Quadrant | DetID | PixID | Counts | Sigma | Mean | Median | Sigma |
| A | 1 | 162 | 16976 | 106.37 | 747 | 734 | 152.7 |
| A | 11 | 29 | 9182 | 55.33 | 747 | 734 | 152.7 |
| A | 0 | 226 | 6774 | 39.56 | 747 | 734 | 152.7 |
| B | 4 | 239 | 1412364 | 10195.73 | 732 | 718 | 138.5 |
| B | 0 | 219 | 93765 | 672.04 | 732 | 718 | 138.5 |
| B | 0 | 214 | 41590 | 295.2 | 732 | 718 | 138.5 |
| C | 13 | 61 | 5430 | 28.23 | 727 | 734 | 166.4 |
| C | 14 | 234 | 4868 | 24.85 | 727 | 734 | 166.4 |
| C | 4 | 175 | 3148 | 14.51 | 727 | 734 | 166.4 |
| D | 8 | 195 | 370147 | 2152.13 | 713 | 696 | 171.7 |
| D | 2 | 16 | 260357 | 1512.58 | 713 | 696 | 171.7 |
| D | 1 | 52 | 158969 | 921.97 | 713 | 696 | 171.7 |
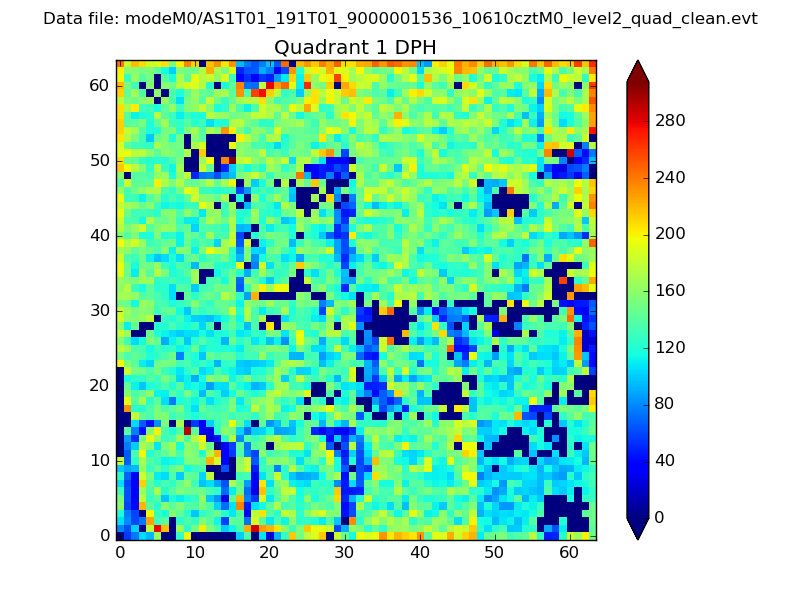
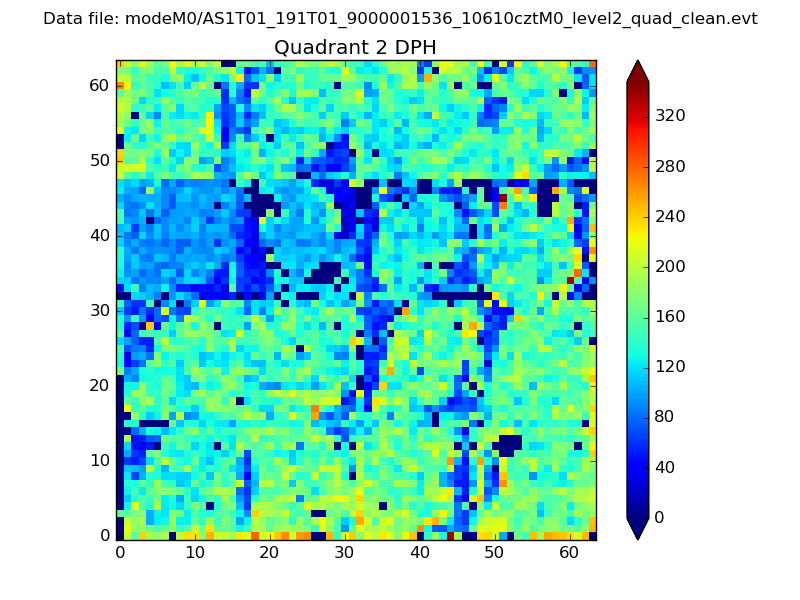
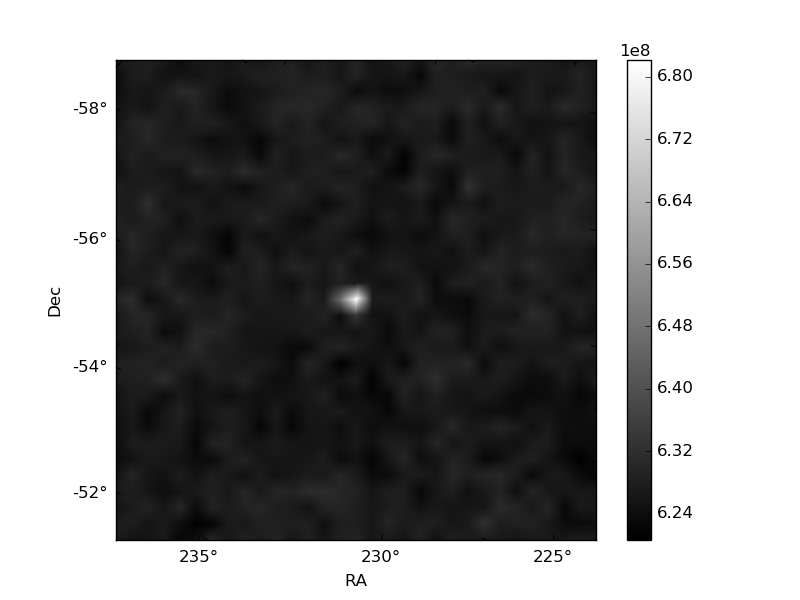
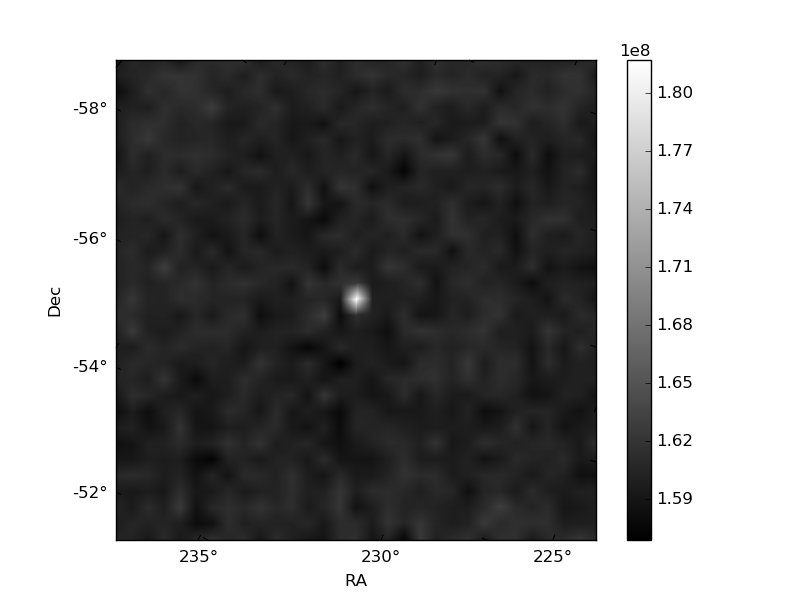
Histogram calculated using DETX and DETY for each event in the final _common_clean file
| Quadrant A | 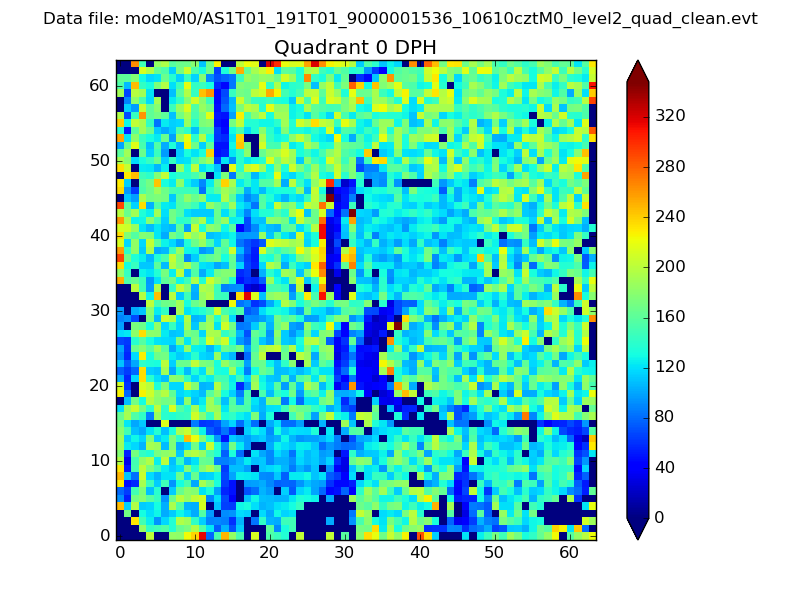 |
 |
Quadrant B |
|---|---|---|---|
| Quadrant D | 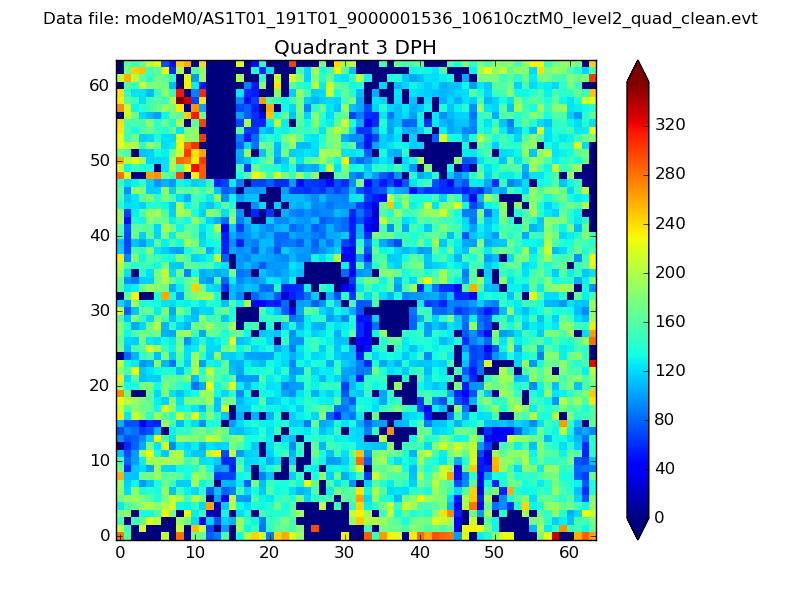 |
 |
Quadrant C |
| Plot type | Count rate plots | Images |
|---|---|---|
| Comparison with Poisson distribution Blue bars denote a histogram of data divided into 1 sec bins. Red curve is a Poisson curve with rate = median count rate of data. |
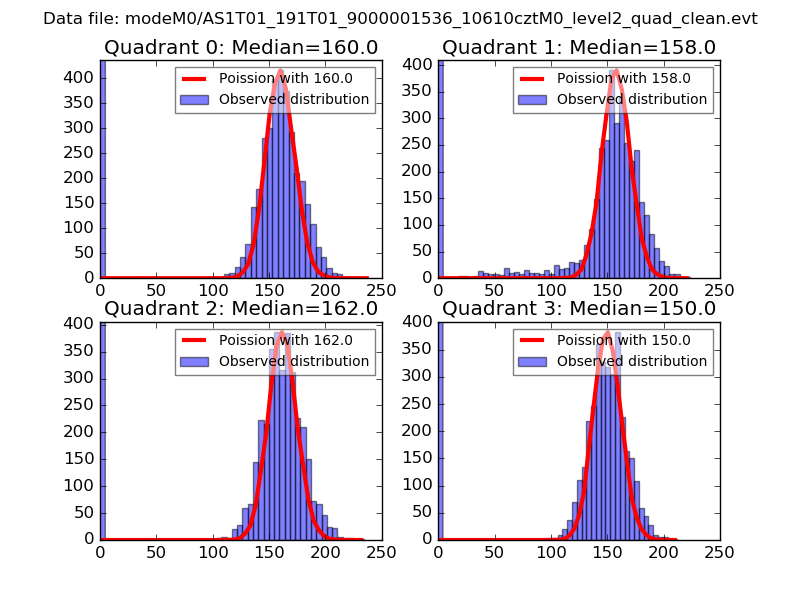 |
 |
| Quadrant-wise count rates Data is divided into 100 sec bins |
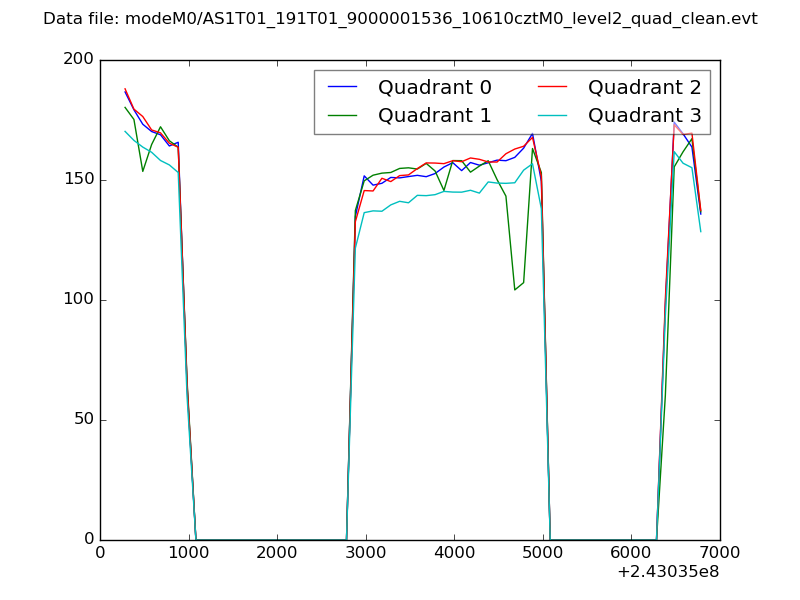 |
|
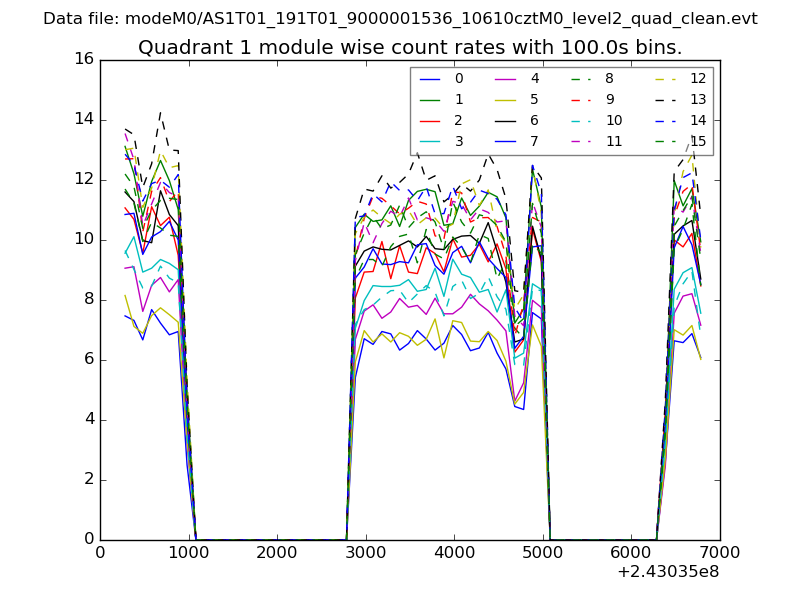
| Module-wise count rates for Quadrant A Data is divided into 100 sec bins |
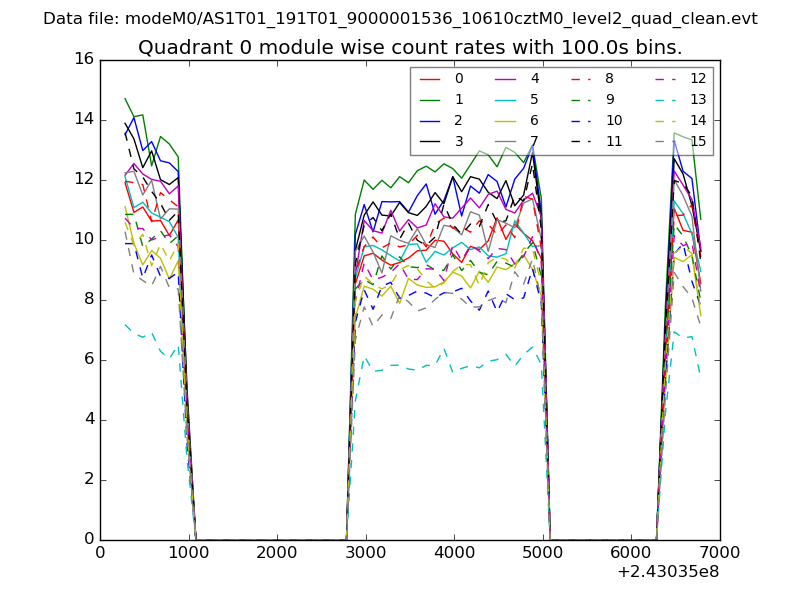 |
 |
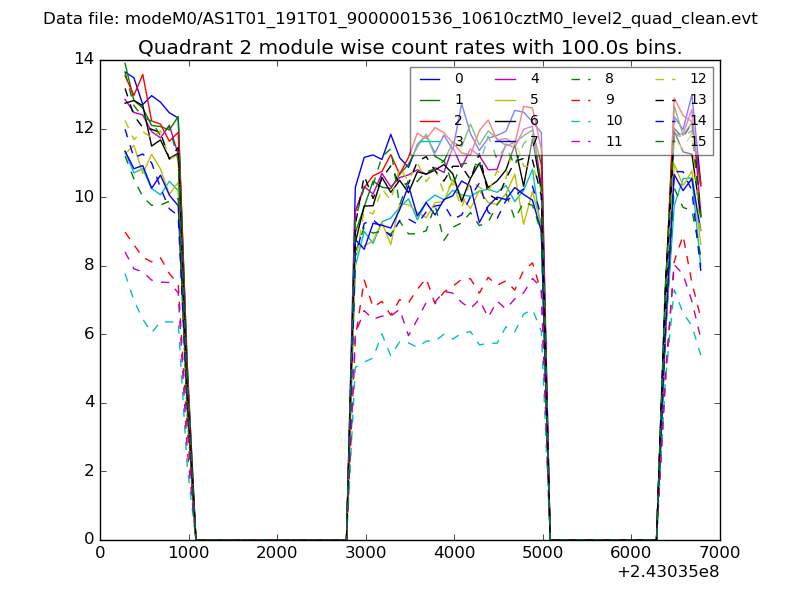
| Module-wise count rates for Quadrant B Data is divided into 100 sec bins |
 |
 |
| Module-wise count rates for Quadrant C Data is divided into 100 sec bins |
 |
 |
| Module-wise count rates for Quadrant D Data is divided into 100 sec bins |
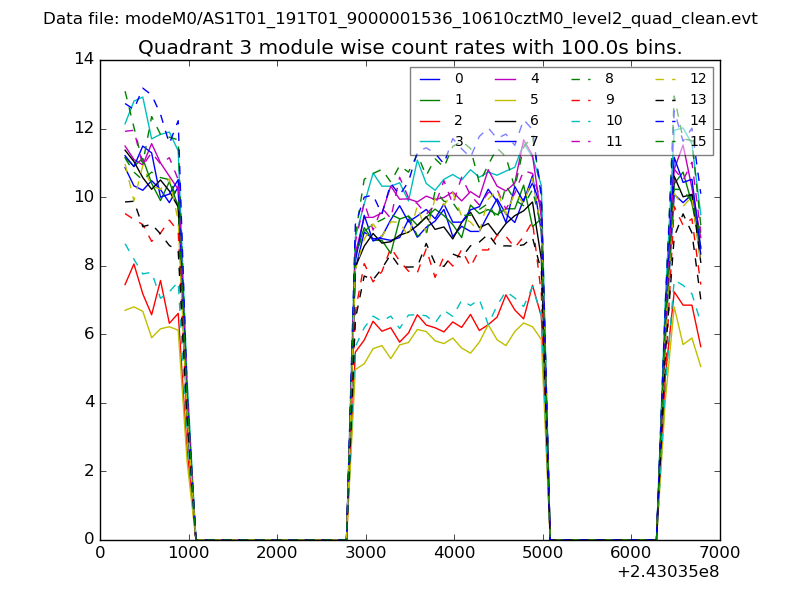 |
 |
| Parameter | Plot |
|---|---|
| CZT HV Monitor | 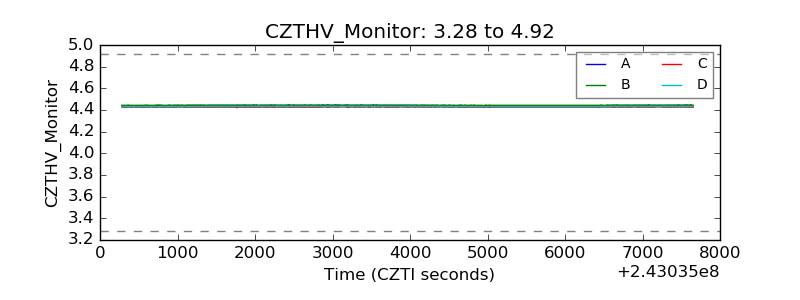 |
| D_VDD | 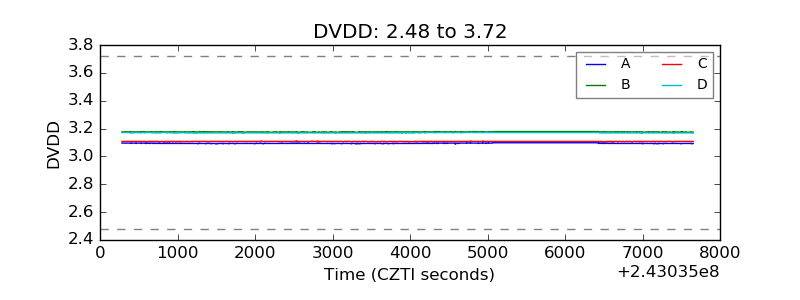 |
| Temperature 1 | 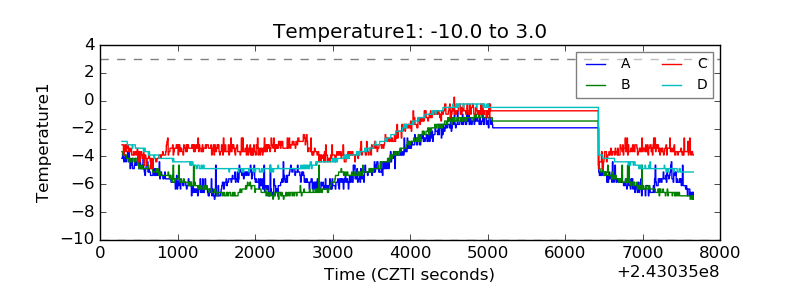 |
| Veto HV Monitor | 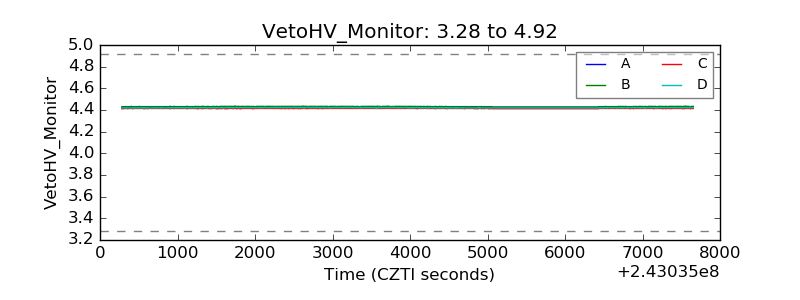 |
| Veto LLD | 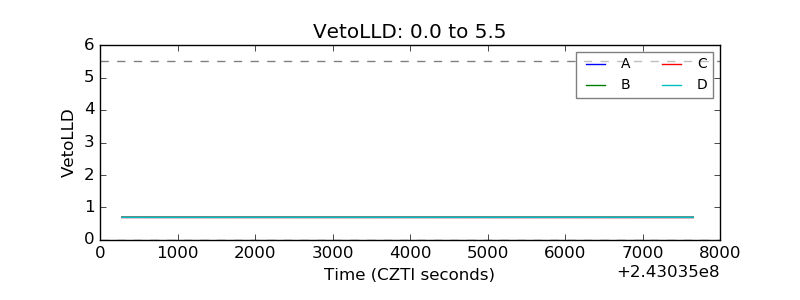 |
| Alpha Counter | 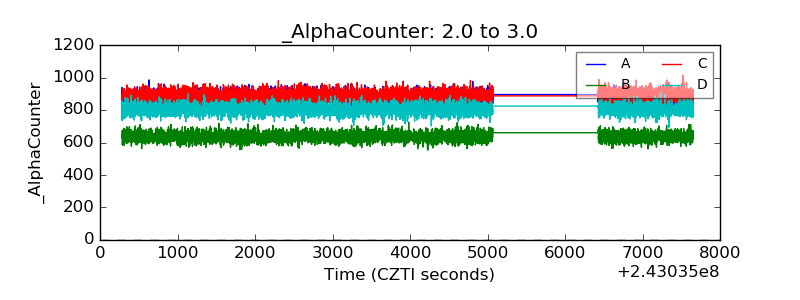 |
| _CPM_Rate | 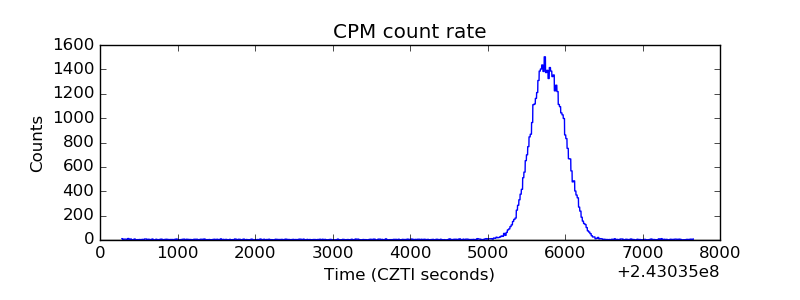 |
| CZT Counter | 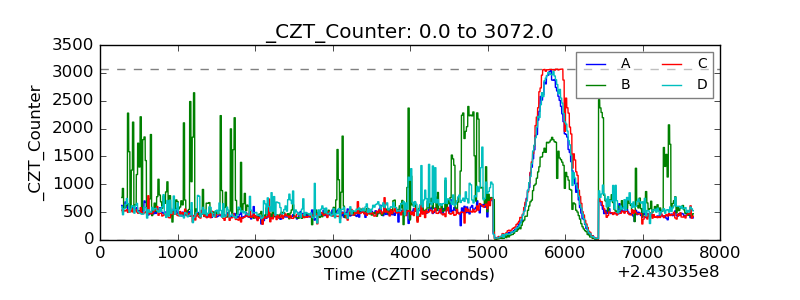 |
| +2.5 Volts monitor |  |
| +5 Volts monitor |  |
| _ROLL_ROT | 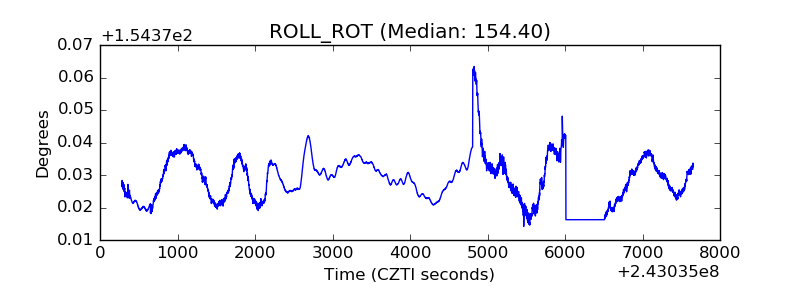 |
| _Roll_DEC | 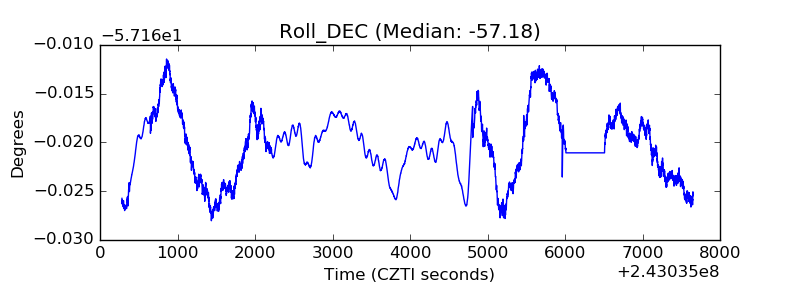 |
| _Roll_RA | 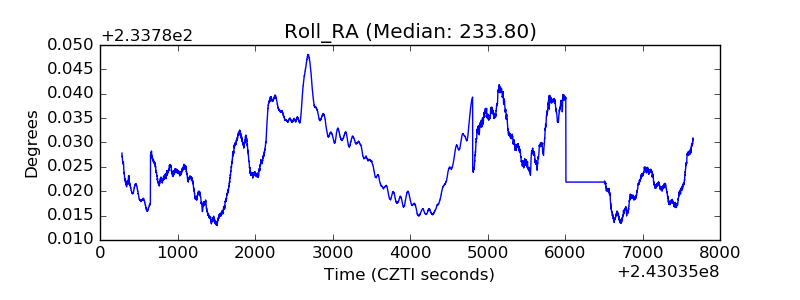 |
| Veto Counter | 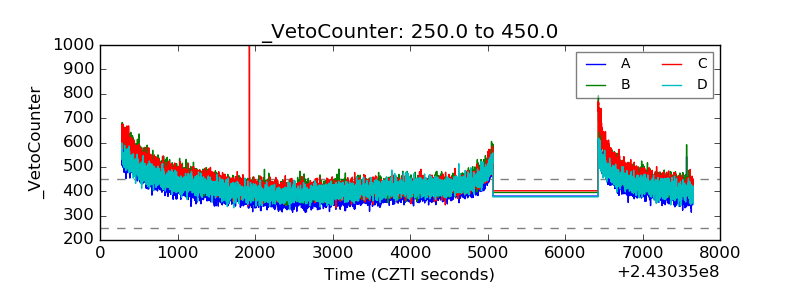 |