| Param | Original file | Final file |
|---|---|---|
| Filename | modeM0/AS1T01_191T01_9000001536_10611cztM0_level2.evt | modeM0/AS1T01_191T01_9000001536_10611cztM0_level2_quad_clean.evt |
| Size (bytes) | 496,382,400 | 78,073,920 |
| Size | 473.4 MB | 74.5 MB |
| Events in quadrant A | 3,087,642 | 491,271 |
| Events in quadrant B | 4,508,081 | 478,977 |
| Events in quadrant C | 2,930,195 | 497,461 |
| Events in quadrant D | 4,081,251 | 458,385 |
| Mode SS | |||
|---|---|---|---|
| Quadrant | BADHDUFLAG | Total packets | Discarded packets |
| A | 0 | 128 | 0 |
| B | 0 | 128 | 0 |
| C | 0 | 128 | 0 |
| D | 0 | 128 | 0 |
| Mode M9 | |||
|---|---|---|---|
| Quadrant | BADHDUFLAG | Total packets | Discarded packets |
| A | 0 | 11 | 0 |
| B | 0 | 11 | 0 |
| C | 0 | 11 | 0 |
| D | 0 | 11 | 0 |
| Mode M0 | |||
|---|---|---|---|
| Quadrant | BADHDUFLAG | Total packets | Discarded packets |
| A | 0 | 13220 | 8 |
| B | 0 | 17379 | 15 |
| C | 0 | 12803 | 13 |
| D | 0 | 16282 | 10 |
| Quadrant | Total seconds | Saturated seconds | Saturation percentage |
|---|---|---|---|
| A | 6273 | 39 | 0.621712% |
| B | 6270 | 430 | 6.858054% |
| C | 6270 | 15 | 0.239234% |
| D | 6273 | 94 | 1.498486% |
Noise dominated data is calculated using 1-second bins in cleaned event files. If a bin has >2000 counts, and if more than 50% of those come from <1% of pixels, then it is considered to be noise-dominated and hence unusable.
| Quadrant | # 1 sec bins | Bins with >0 counts | Bins with >2000 counts | High rate bins dominated by noise | Noise dominated (total time) | Noise dominated (detector-on time) | Marked lightcurve |
|---|---|---|---|---|---|---|---|
| A | 7406 | 6277 | 9 | 9 | 0.12% | 0.14% | 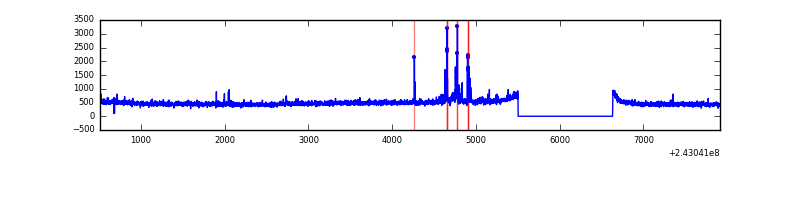 |
| B | 7406 | 6277 | 277 | 277 | 3.74% | 4.41% | 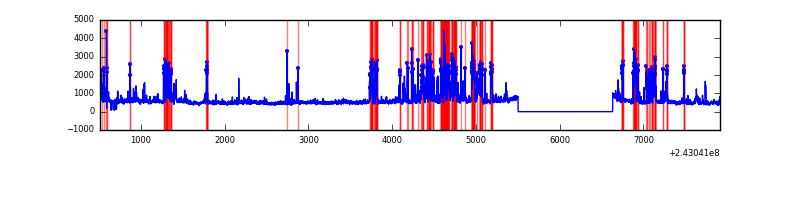 |
| C | 7406 | 6276 | 2 | 2 | 0.03% | 0.03% | 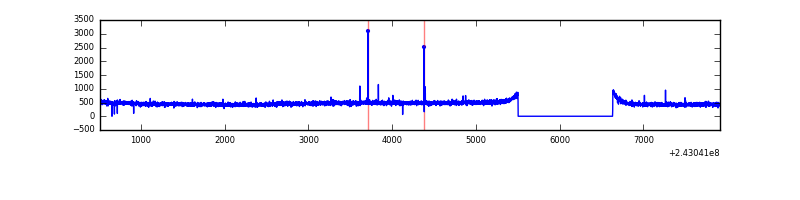 |
| D | 7406 | 6277 | 63 | 63 | 0.85% | 1.00% | 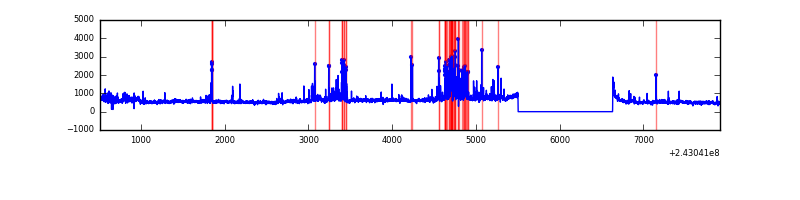 |
Top three noisy pixels from each quadrant. If the there are fewer than three noisy pixels in the level2.evt file, extra rows are filled as -1
| Pixel properties | Quadrant properties | ||||||
|---|---|---|---|---|---|---|---|
| Quadrant | DetID | PixID | Counts | Sigma | Mean | Median | Sigma |
| A | 15 | 174 | 87904 | 557.38 | 765 | 752 | 156.4 |
| A | 1 | 162 | 22324 | 137.96 | 765 | 752 | 156.4 |
| A | 1 | 178 | 8070 | 46.8 | 765 | 752 | 156.4 |
| B | 4 | 239 | 1245110 | 8748.43 | 753 | 738 | 142.2 |
| B | 0 | 219 | 191365 | 1340.18 | 753 | 738 | 142.2 |
| B | 0 | 214 | 67656 | 470.46 | 753 | 738 | 142.2 |
| C | 14 | 234 | 17134 | 95.63 | 744 | 750 | 171.3 |
| C | 4 | 175 | 6116 | 31.32 | 744 | 750 | 171.3 |
| C | 13 | 61 | 5694 | 28.86 | 744 | 750 | 171.3 |
| D | 8 | 195 | 484366 | 2738.97 | 732 | 715 | 176.6 |
| D | 2 | 16 | 358848 | 2028.15 | 732 | 715 | 176.6 |
| D | 12 | 233 | 271539 | 1533.71 | 732 | 715 | 176.6 |
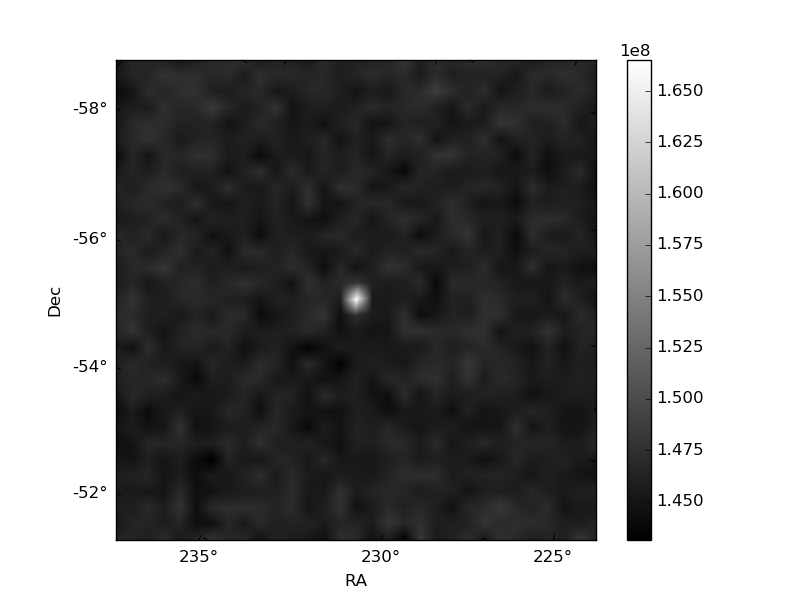
Histogram calculated using DETX and DETY for each event in the final _common_clean file
| Quadrant A | 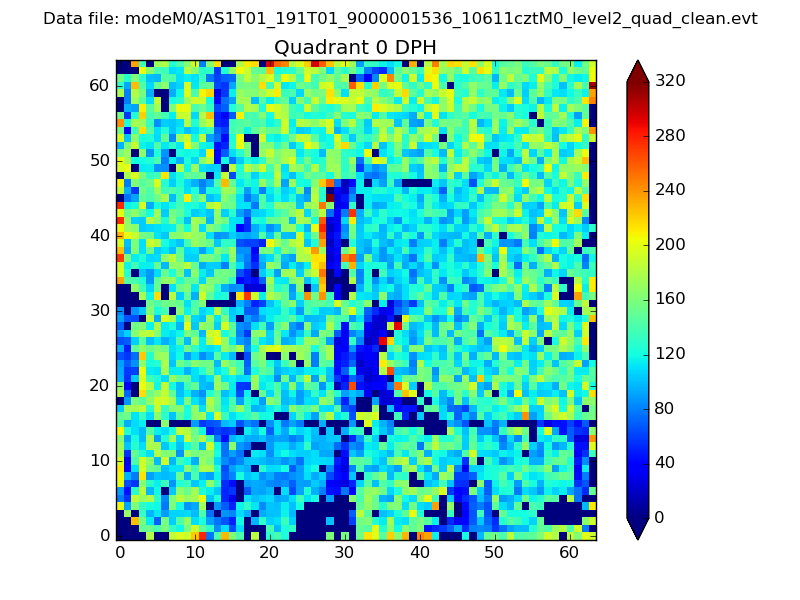 |
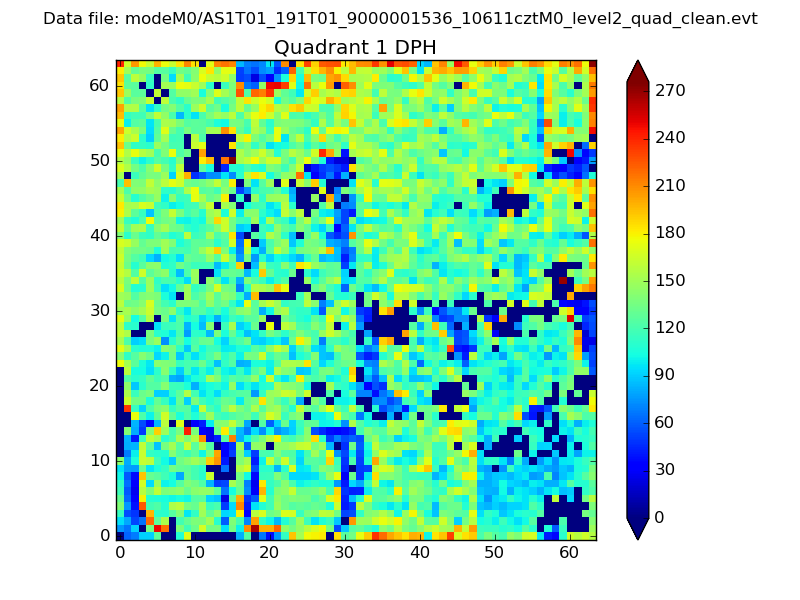 |
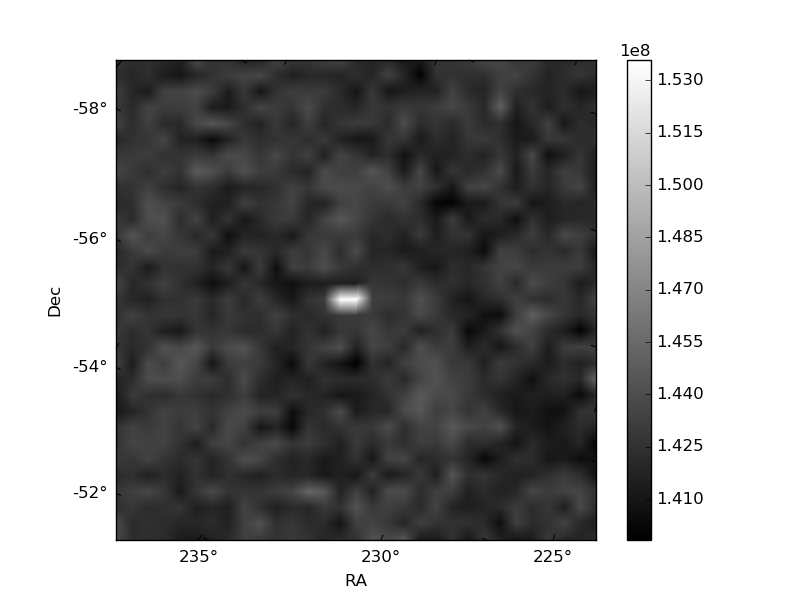
Quadrant B |
|---|---|---|---|
| Quadrant D | 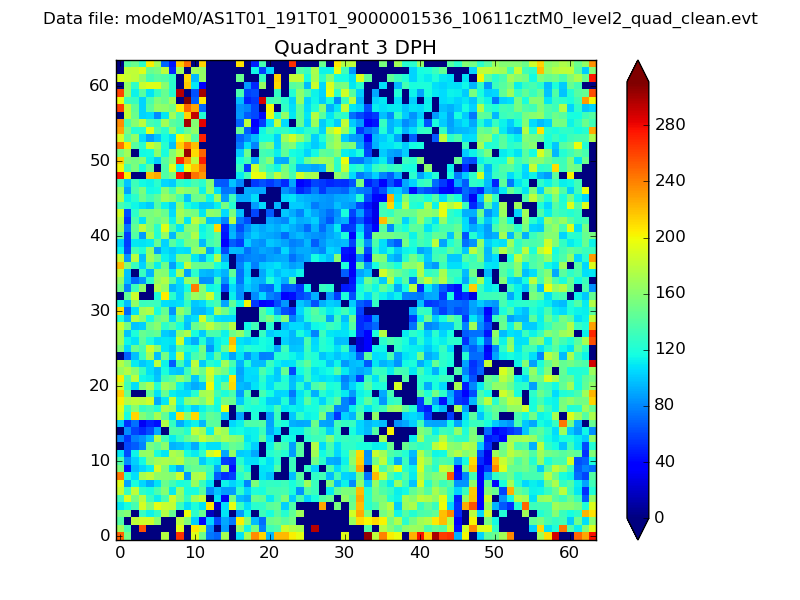 |
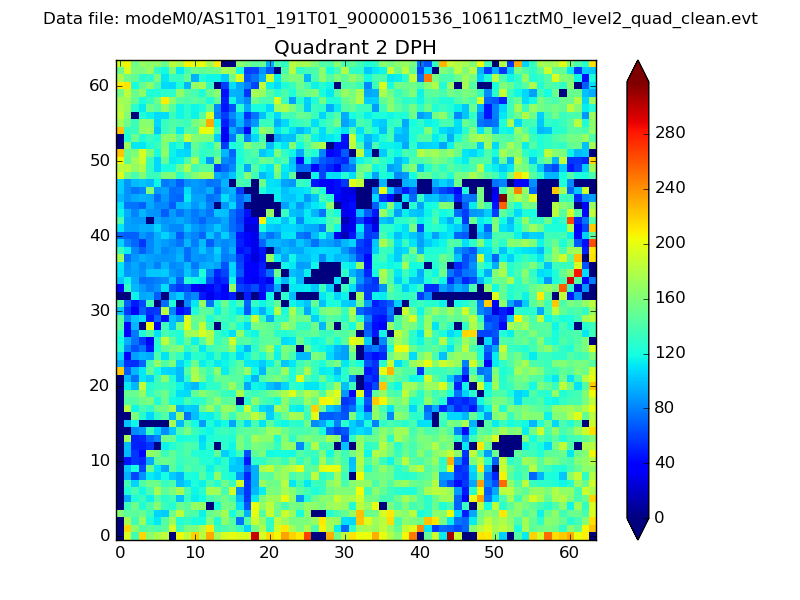 |
Quadrant C |
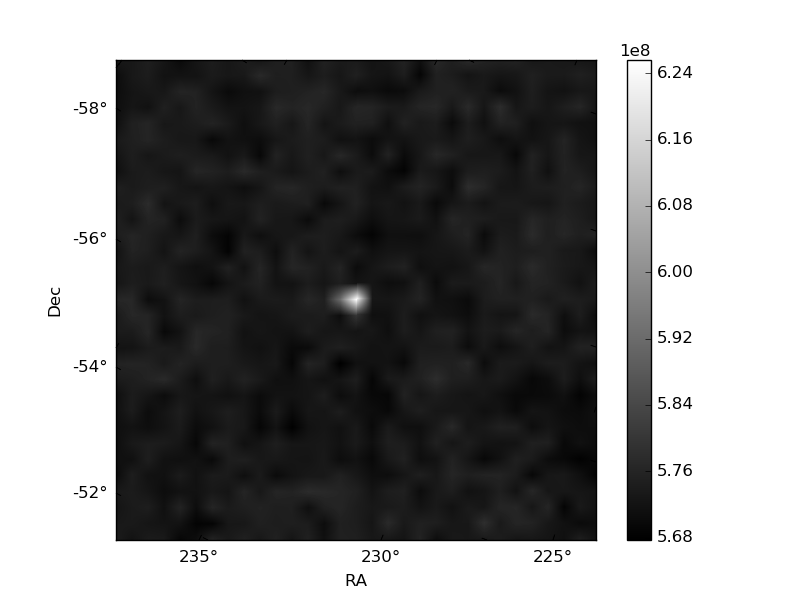
| Plot type | Count rate plots | Images |
|---|---|---|
| Comparison with Poisson distribution Blue bars denote a histogram of data divided into 1 sec bins. Red curve is a Poisson curve with rate = median count rate of data. |
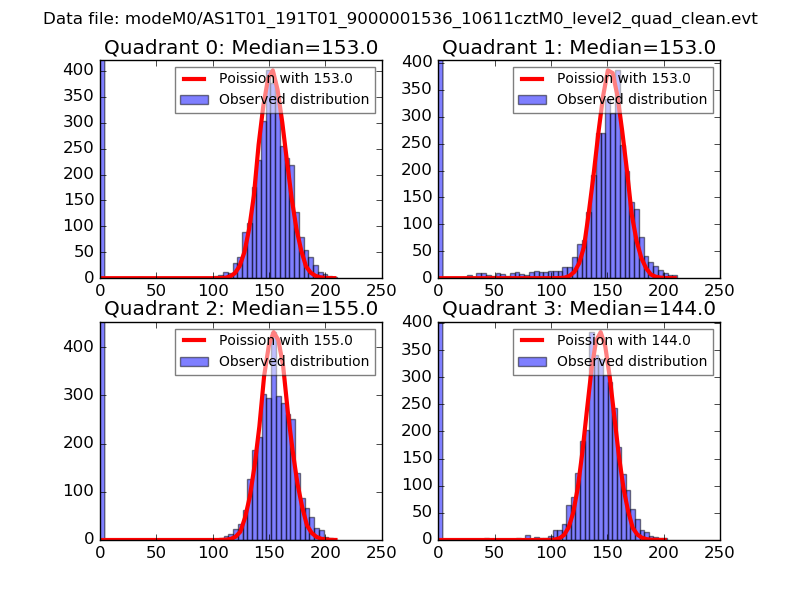 |
 |
| Quadrant-wise count rates Data is divided into 100 sec bins |
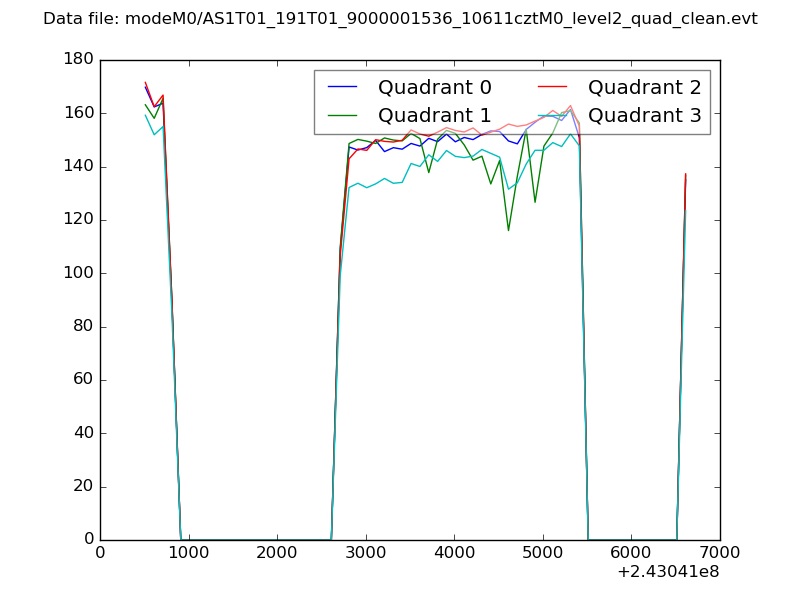 |
|
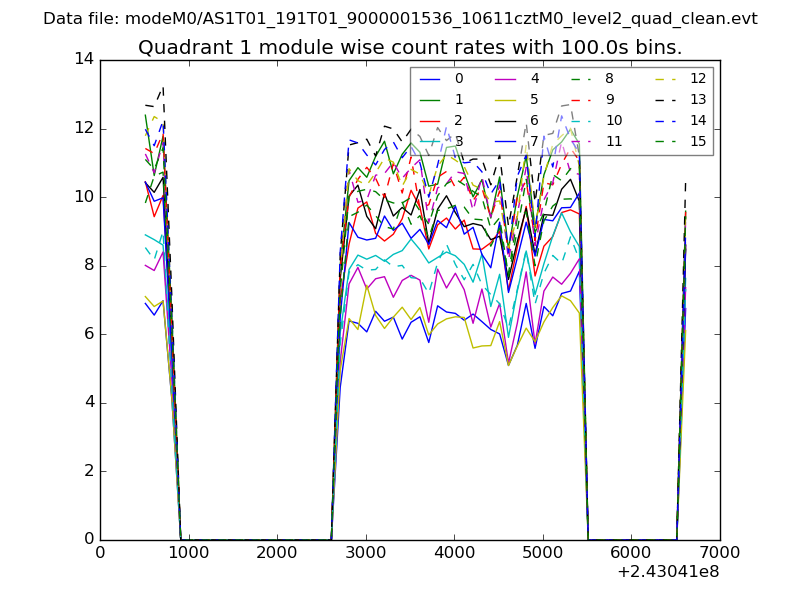
| Module-wise count rates for Quadrant A Data is divided into 100 sec bins |
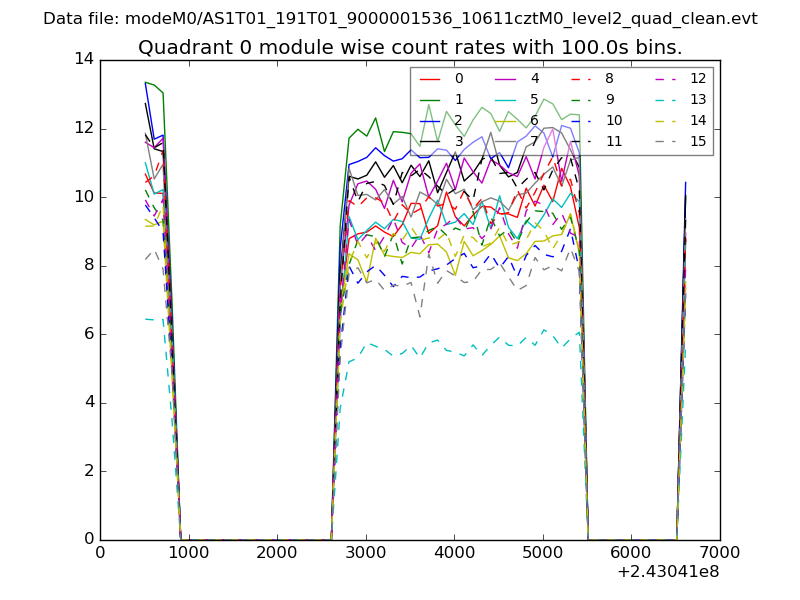 |
 |
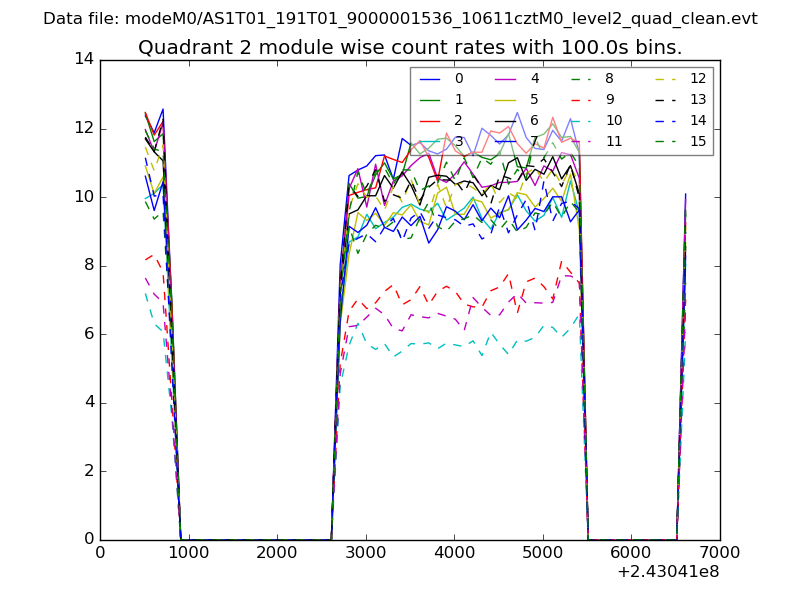
| Module-wise count rates for Quadrant B Data is divided into 100 sec bins |
 |
 |
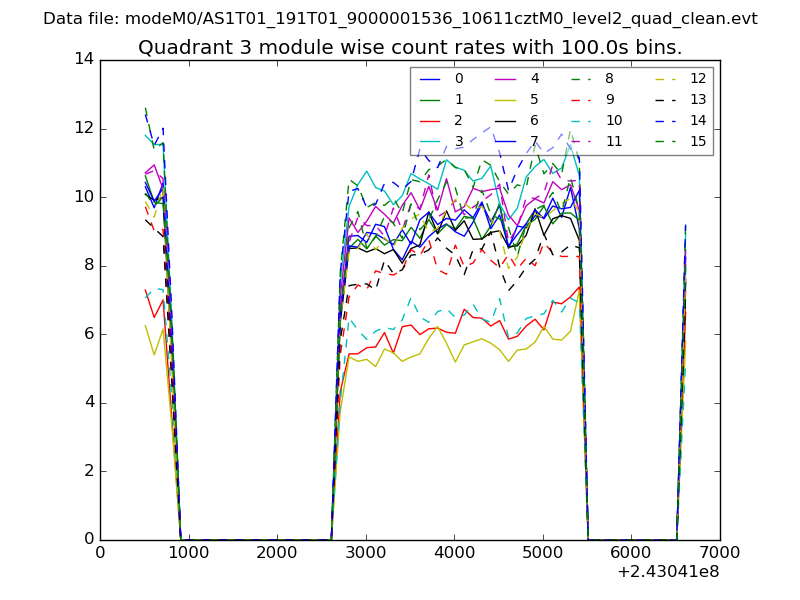
| Module-wise count rates for Quadrant C Data is divided into 100 sec bins |
 |
 |
| Module-wise count rates for Quadrant D Data is divided into 100 sec bins |
 |
 |
| Parameter | Plot |
|---|---|
| CZT HV Monitor | 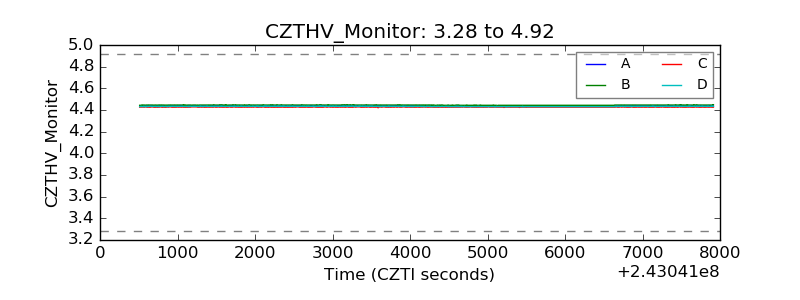 |
| D_VDD | 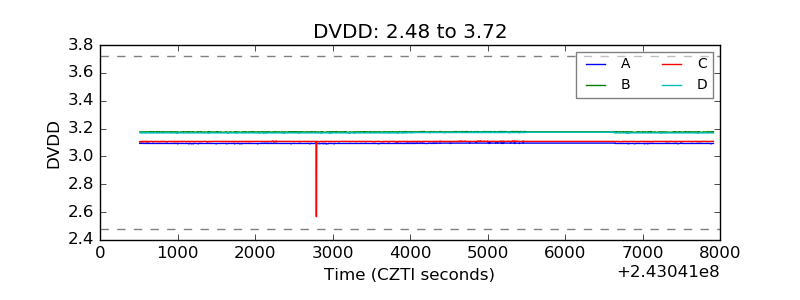 |
| Temperature 1 | 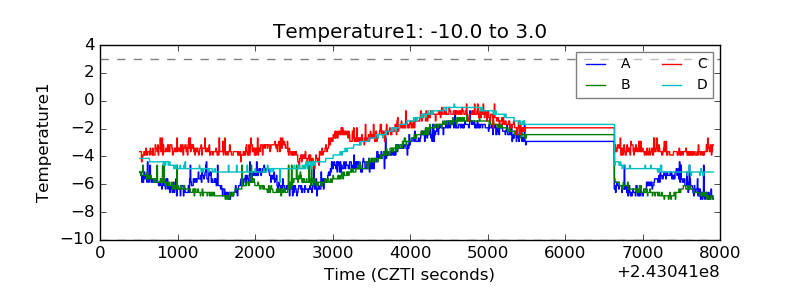 |
| Veto HV Monitor | 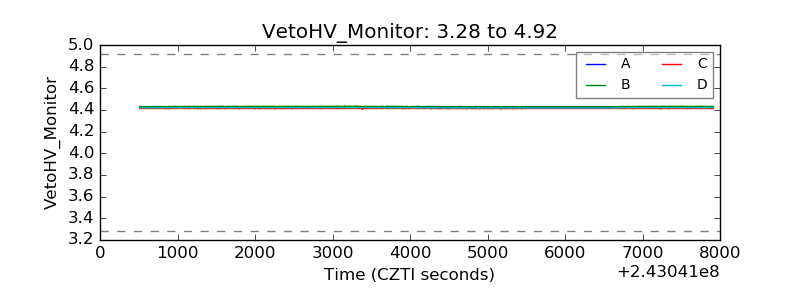 |
| Veto LLD | 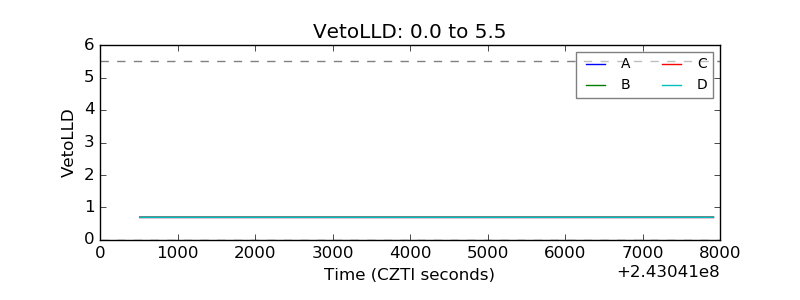 |
| Alpha Counter | 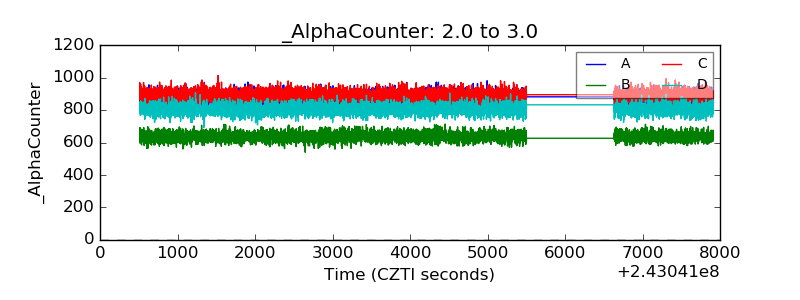 |
| _CPM_Rate | 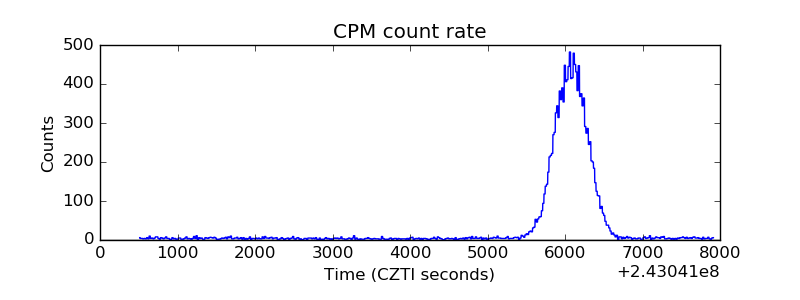 |
| CZT Counter | 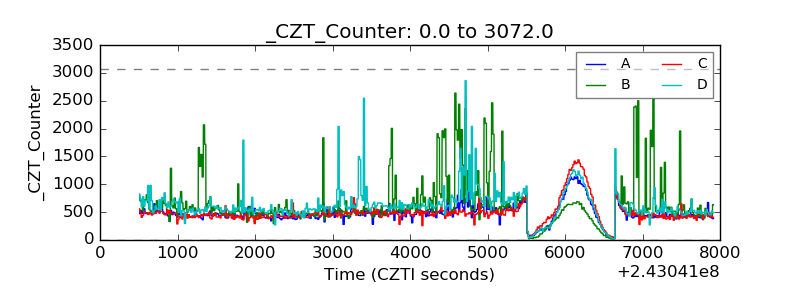 |
| +2.5 Volts monitor |  |
| +5 Volts monitor |  |
| _ROLL_ROT | 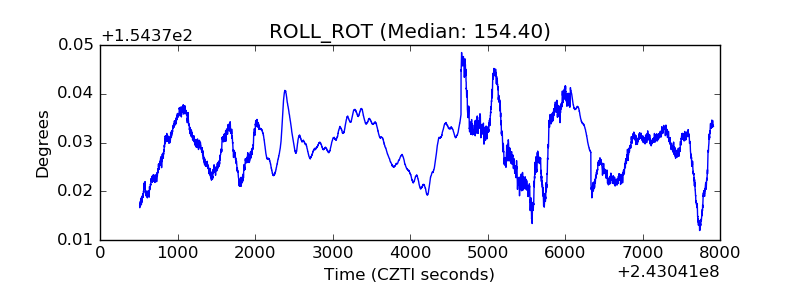 |
| _Roll_DEC | 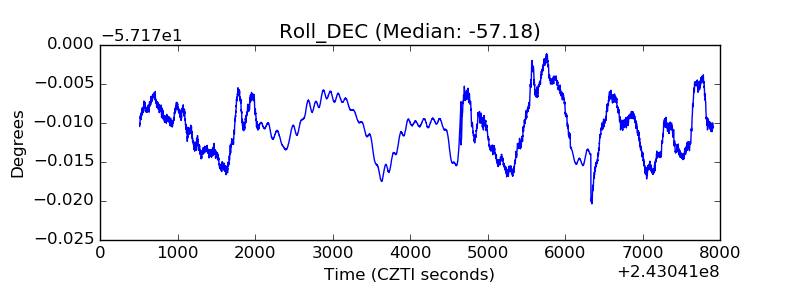 |
| _Roll_RA | 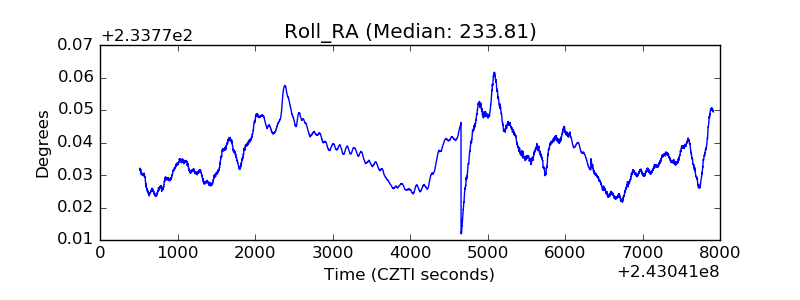 |
| Veto Counter | 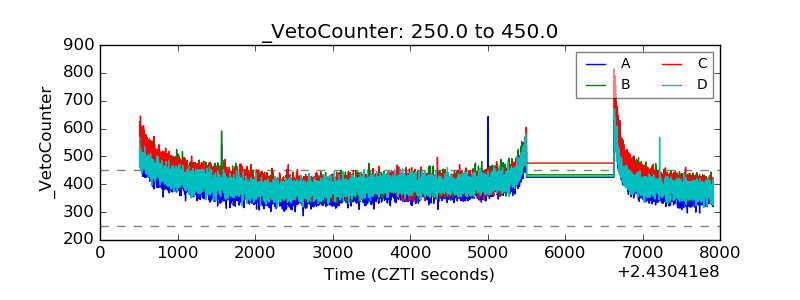 |