| Param | Original file | Final file |
|---|---|---|
| Filename | modeM0/AS1T01_191T01_9000001536_10612cztM0_level2.evt | modeM0/AS1T01_191T01_9000001536_10612cztM0_level2_quad_clean.evt |
| Size (bytes) | 589,472,640 | 98,700,480 |
| Size | 562.2 MB | 94.1 MB |
| Events in quadrant A | 3,723,121 | 626,816 |
| Events in quadrant B | 5,617,112 | 605,468 |
| Events in quadrant C | 3,597,957 | 632,150 |
| Events in quadrant D | 4,395,297 | 592,032 |
| Mode SS | |||
|---|---|---|---|
| Quadrant | BADHDUFLAG | Total packets | Discarded packets |
| A | 0 | 158 | 0 |
| B | 0 | 158 | 0 |
| C | 0 | 158 | 0 |
| D | 0 | 158 | 0 |
| Mode M9 | |||
|---|---|---|---|
| Quadrant | BADHDUFLAG | Total packets | Discarded packets |
| A | 0 | 19 | 0 |
| B | 0 | 19 | 0 |
| C | 0 | 19 | 0 |
| D | 0 | 19 | 0 |
| Mode M0 | |||
|---|---|---|---|
| Quadrant | BADHDUFLAG | Total packets | Discarded packets |
| A | 0 | 16071 | 3 |
| B | 0 | 21718 | 2 |
| C | 0 | 15834 | 2 |
| D | 0 | 17693 | 2 |
| Quadrant | Total seconds | Saturated seconds | Saturation percentage |
|---|---|---|---|
| A | 7651 | 66 | 0.862632% |
| B | 7651 | 557 | 7.280094% |
| C | 7651 | 49 | 0.640439% |
| D | 7651 | 100 | 1.307019% |
Noise dominated data is calculated using 1-second bins in cleaned event files. If a bin has >2000 counts, and if more than 50% of those come from <1% of pixels, then it is considered to be noise-dominated and hence unusable.
| Quadrant | # 1 sec bins | Bins with >0 counts | Bins with >2000 counts | High rate bins dominated by noise | Noise dominated (total time) | Noise dominated (detector-on time) | Marked lightcurve |
|---|---|---|---|---|---|---|---|
| A | 9546 | 7653 | 2 | 2 | 0.02% | 0.03% | 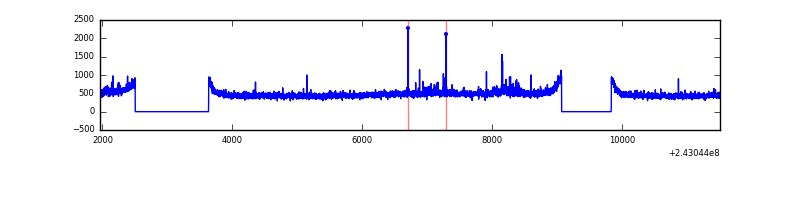 |
| B | 9546 | 7653 | 291 | 291 | 3.05% | 3.80% | 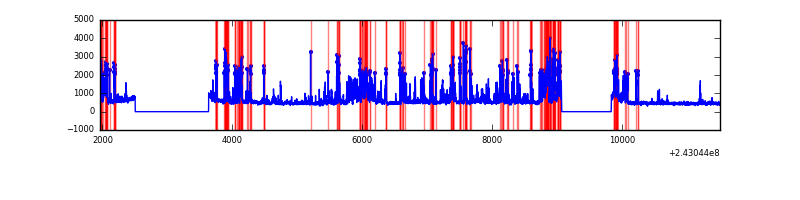 |
| C | 9546 | 7653 | 5 | 5 | 0.05% | 0.07% | 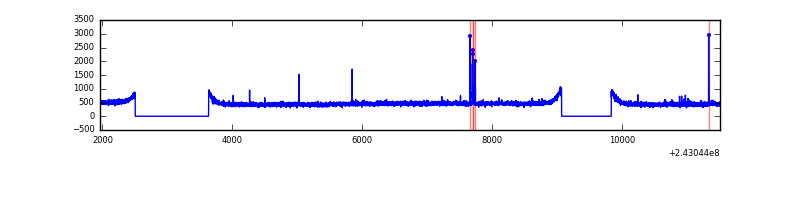 |
| D | 9546 | 7652 | 36 | 36 | 0.38% | 0.47% | 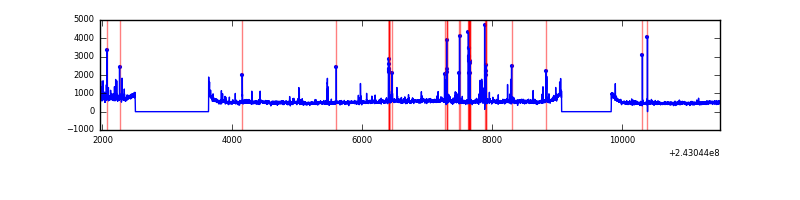 |
Top three noisy pixels from each quadrant. If the there are fewer than three noisy pixels in the level2.evt file, extra rows are filled as -1
| Pixel properties | Quadrant properties | ||||||
|---|---|---|---|---|---|---|---|
| Quadrant | DetID | PixID | Counts | Sigma | Mean | Median | Sigma |
| A | 1 | 162 | 37198 | 187.87 | 935 | 918 | 193.1 |
| A | 8 | 15 | 25332 | 126.42 | 935 | 918 | 193.1 |
| A | 15 | 174 | 19188 | 94.61 | 935 | 918 | 193.1 |
| B | 4 | 239 | 1771633 | 10084.2 | 916 | 897 | 175.6 |
| B | 0 | 85 | 137391 | 777.32 | 916 | 897 | 175.6 |
| B | 0 | 214 | 66902 | 375.89 | 916 | 897 | 175.6 |
| C | 14 | 234 | 33340 | 153.27 | 909 | 917 | 211.5 |
| C | 4 | 254 | 8047 | 33.7 | 909 | 917 | 211.5 |
| C | 14 | 67 | 7696 | 32.04 | 909 | 917 | 211.5 |
| D | 8 | 195 | 518516 | 2385.48 | 896 | 874 | 217.0 |
| D | 2 | 16 | 188046 | 862.56 | 896 | 874 | 217.0 |
| D | 1 | 52 | 124014 | 567.47 | 896 | 874 | 217.0 |
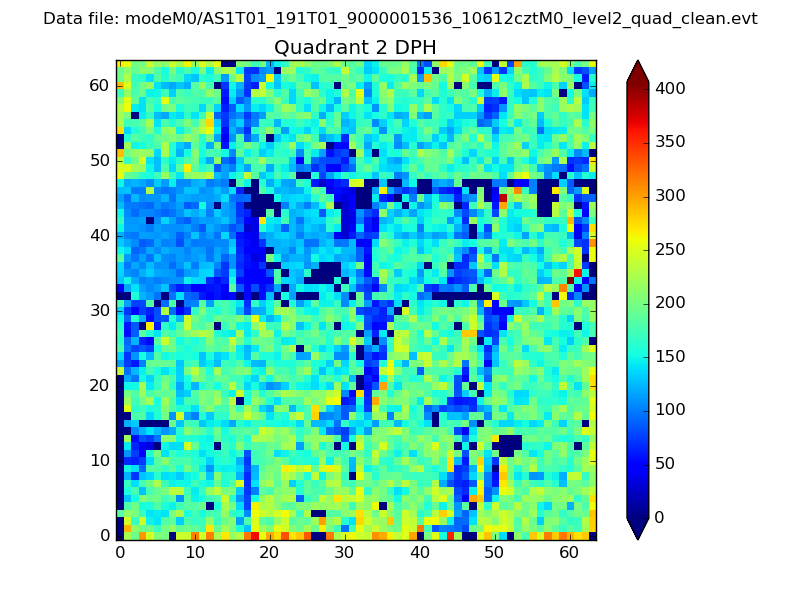
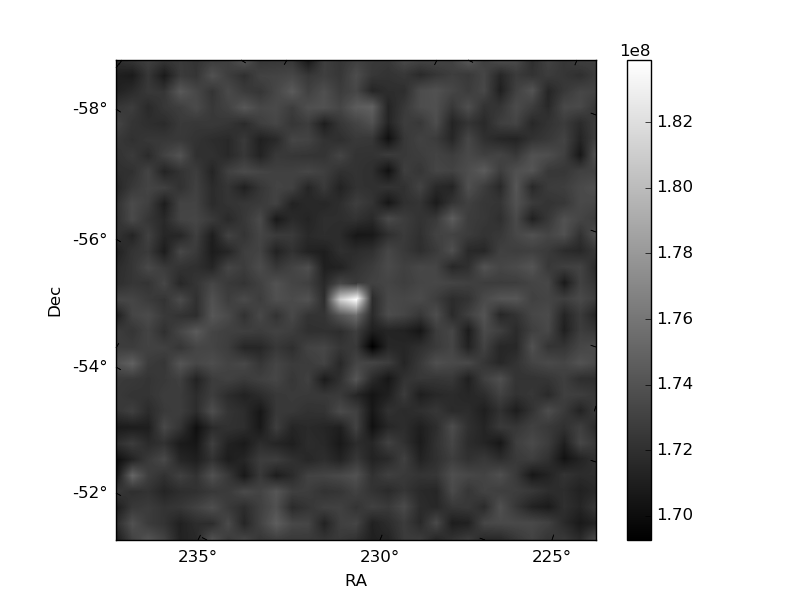
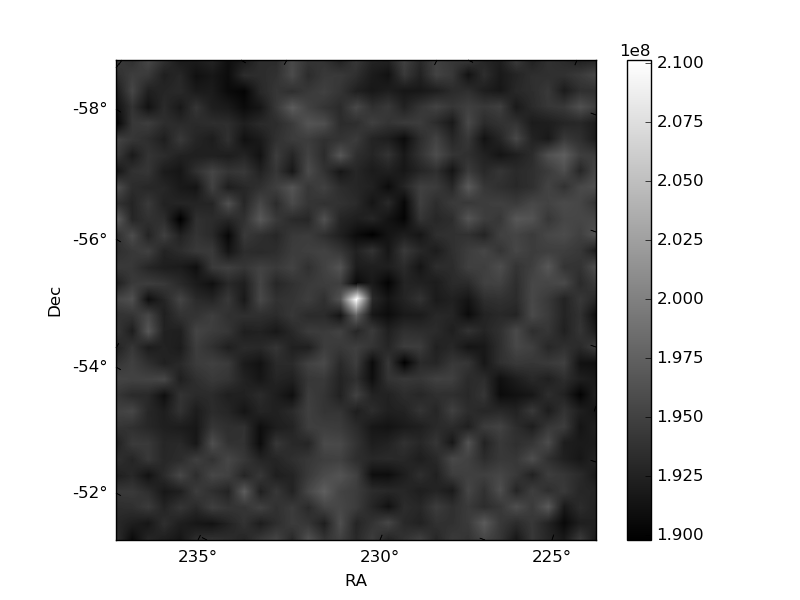
Histogram calculated using DETX and DETY for each event in the final _common_clean file
| Quadrant A | 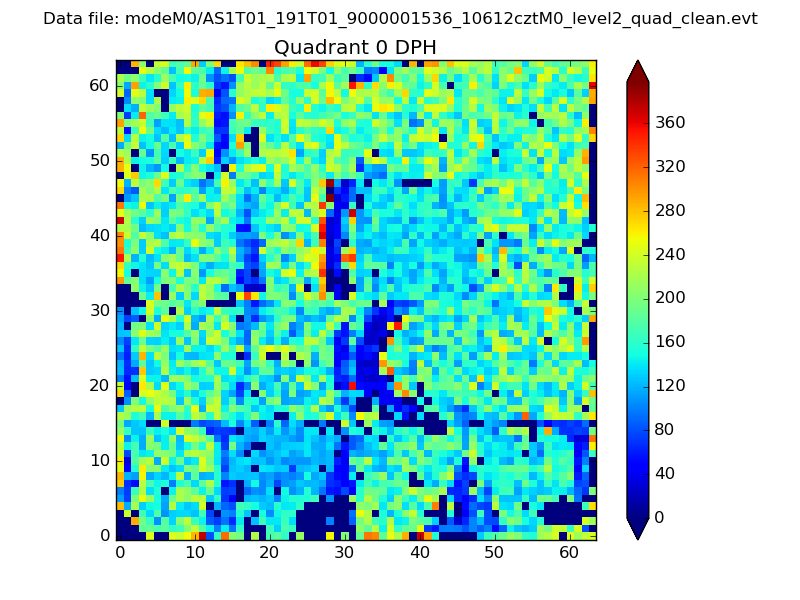 |
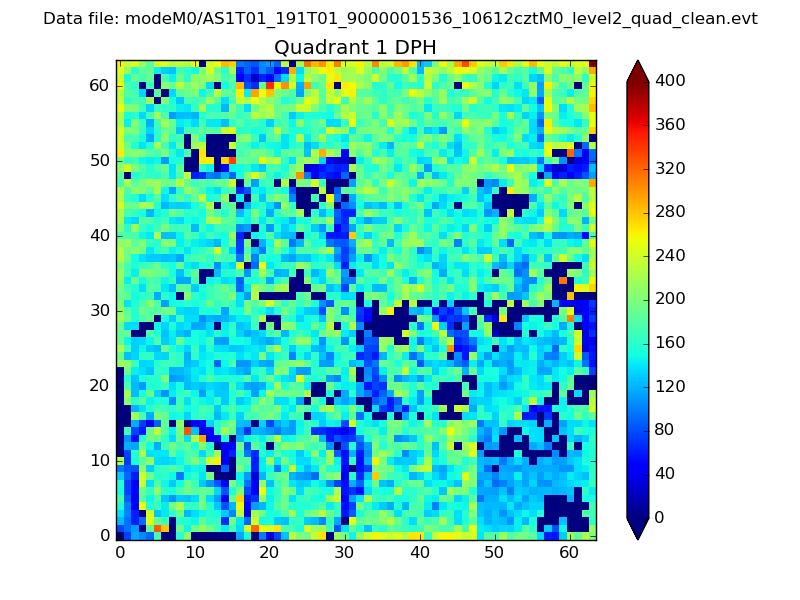 |
Quadrant B |
|---|---|---|---|
| Quadrant D | 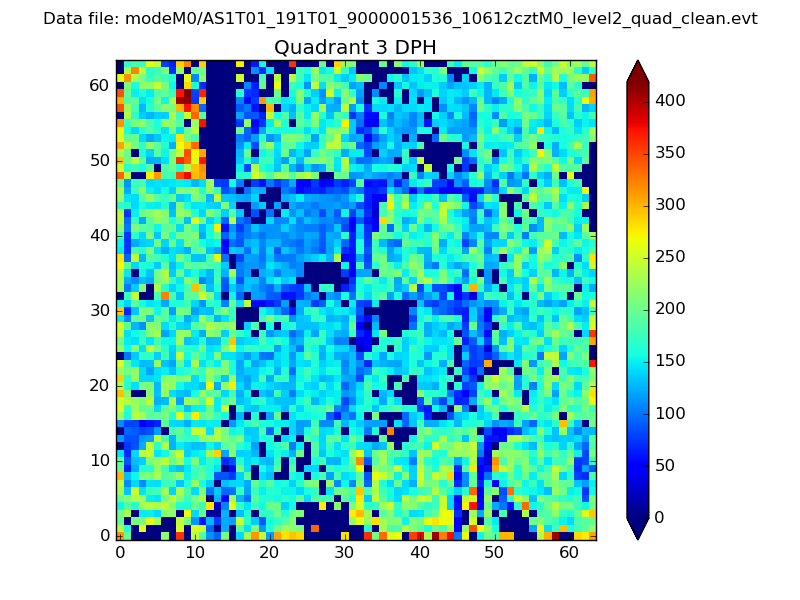 |
 |
Quadrant C |
| Plot type | Count rate plots | Images |
|---|---|---|
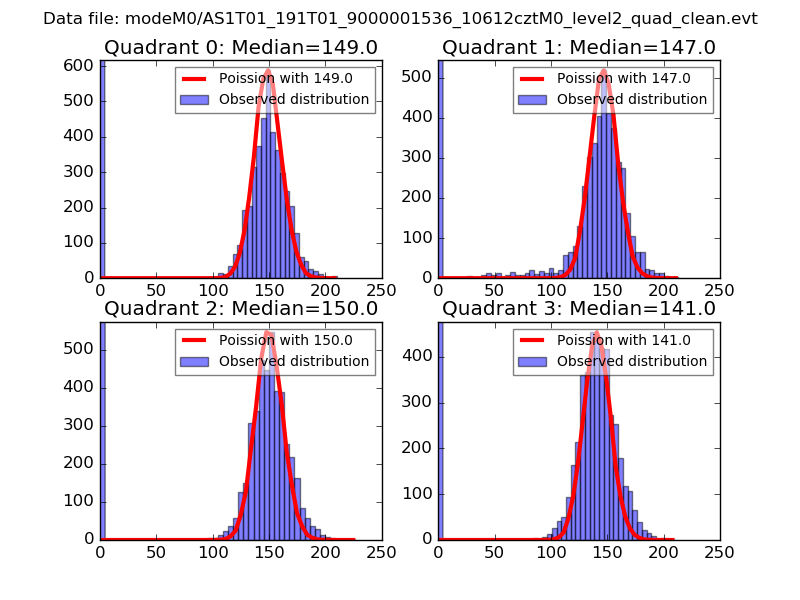
| Comparison with Poisson distribution Blue bars denote a histogram of data divided into 1 sec bins. Red curve is a Poisson curve with rate = median count rate of data. |
 |
 |
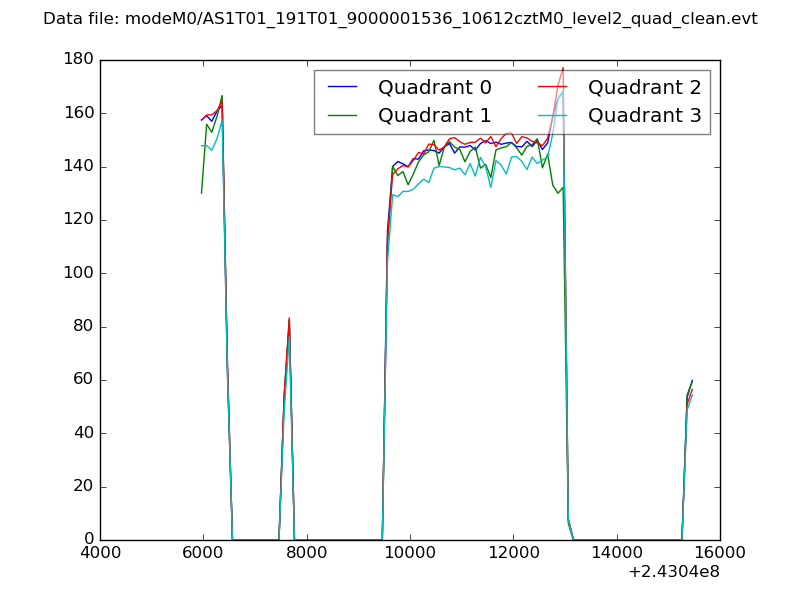
| Quadrant-wise count rates Data is divided into 100 sec bins |
 |
|
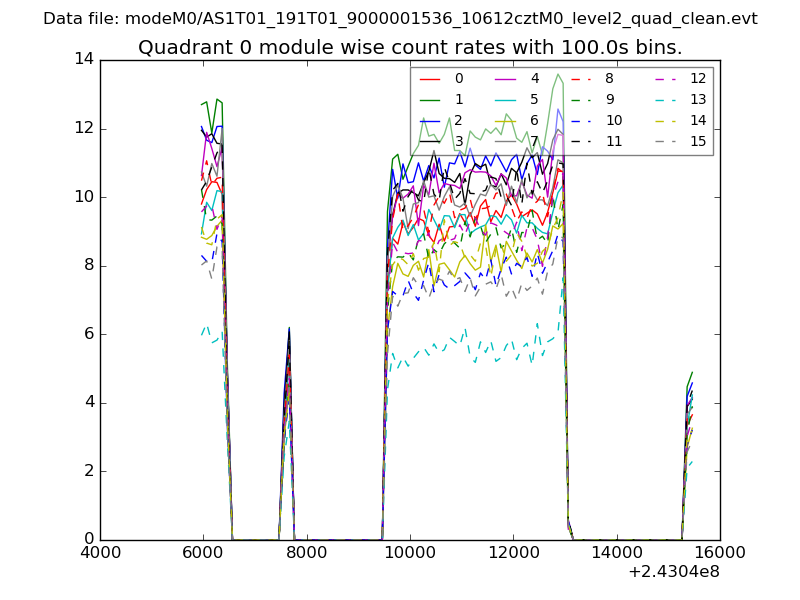
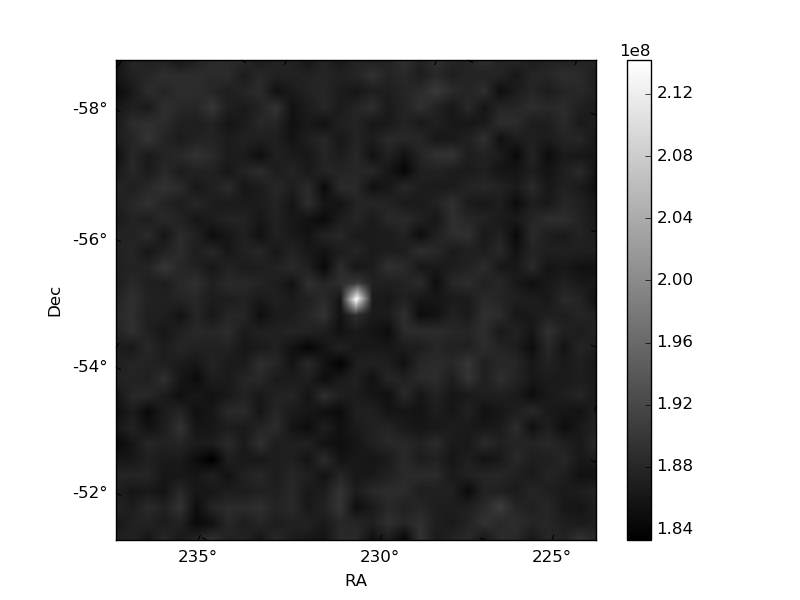
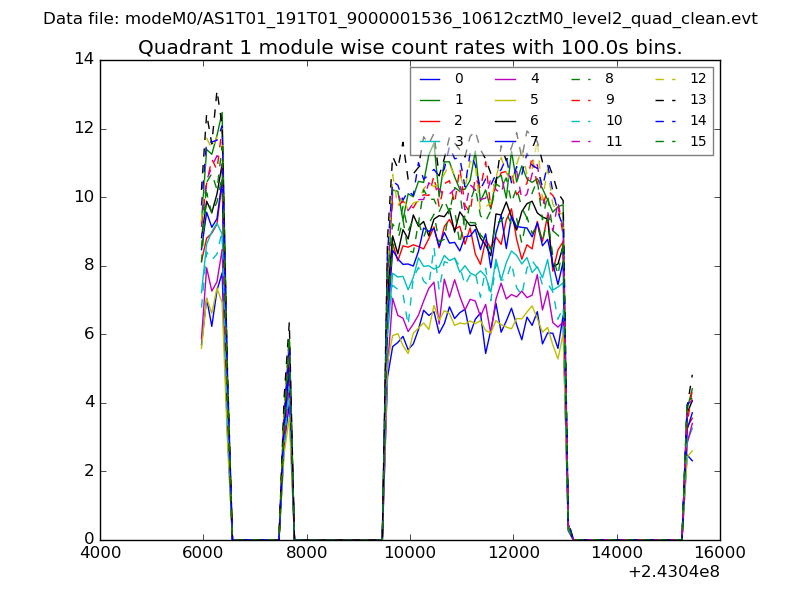
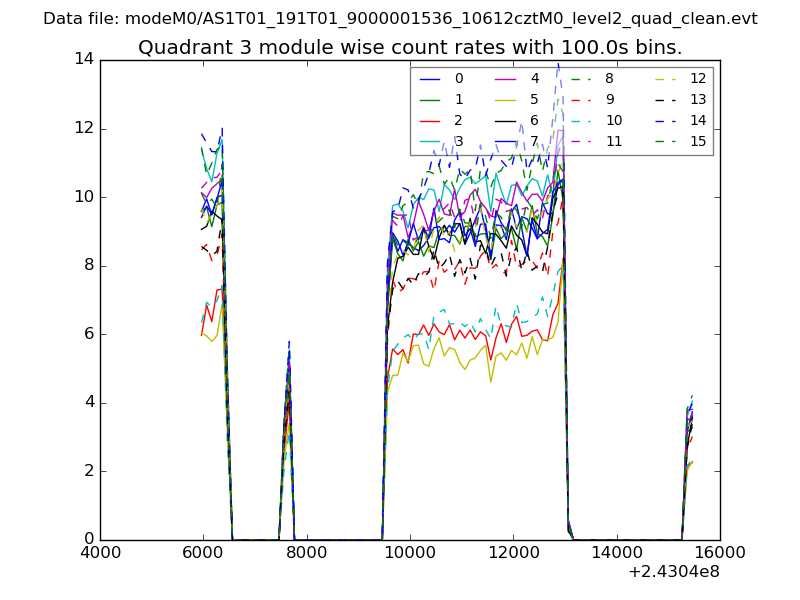
| Module-wise count rates for Quadrant A Data is divided into 100 sec bins |
 |
 |
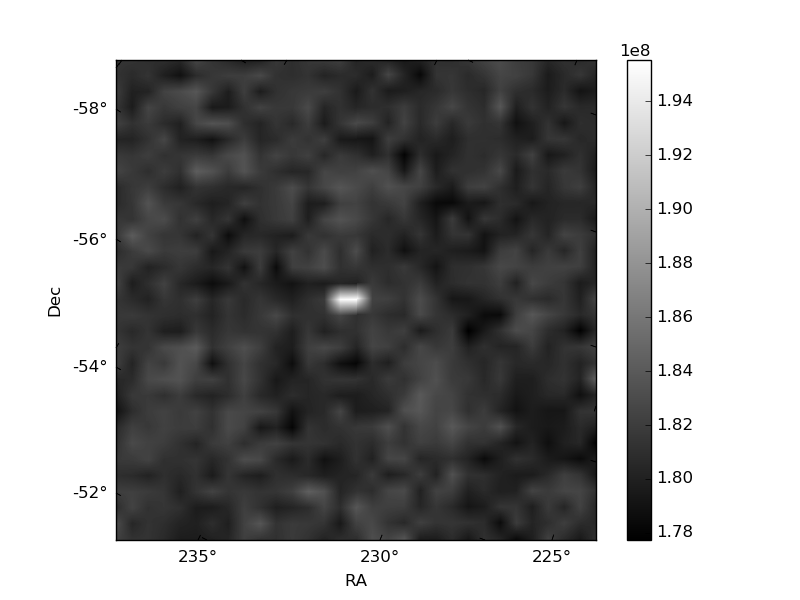
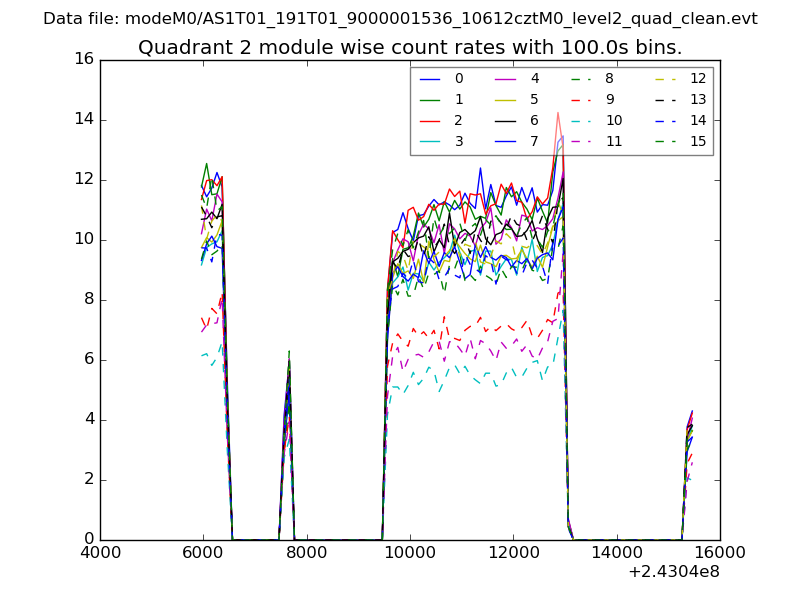
| Module-wise count rates for Quadrant B Data is divided into 100 sec bins |
 |
 |
| Module-wise count rates for Quadrant C Data is divided into 100 sec bins |
 |
 |
| Module-wise count rates for Quadrant D Data is divided into 100 sec bins |
 |
 |
| Parameter | Plot |
|---|---|
| CZT HV Monitor | 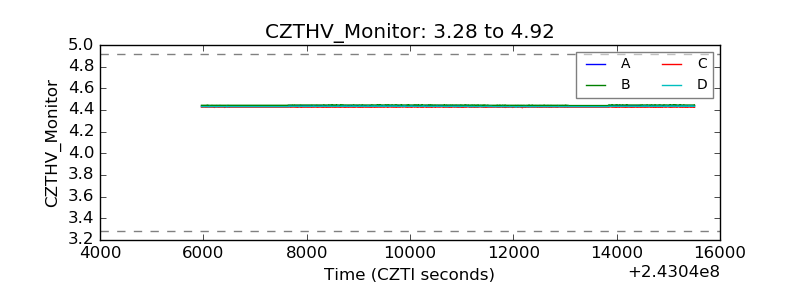 |
| D_VDD | 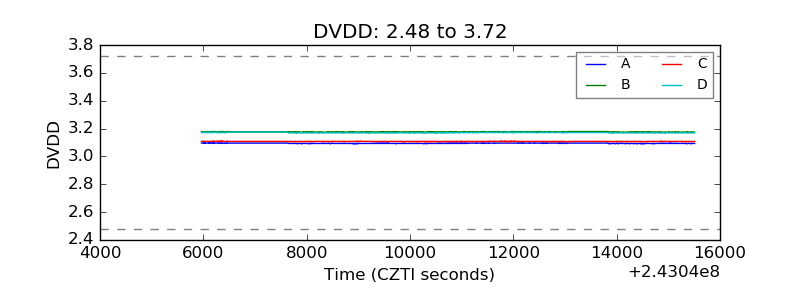 |
| Temperature 1 | 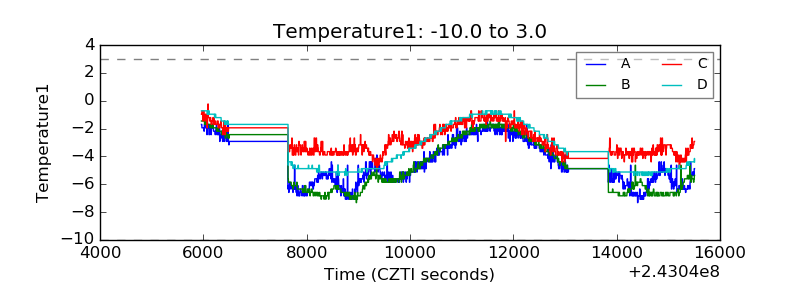 |
| Veto HV Monitor | 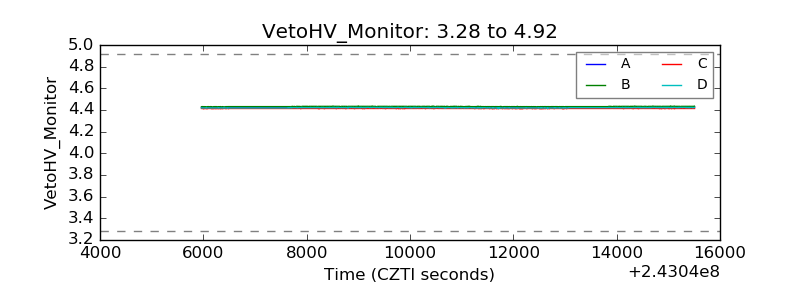 |
| Veto LLD | 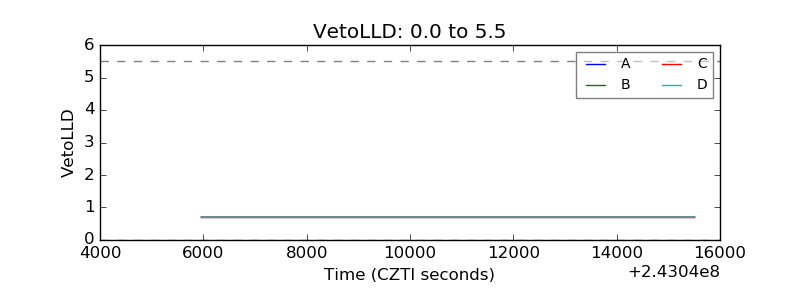 |
| Alpha Counter | 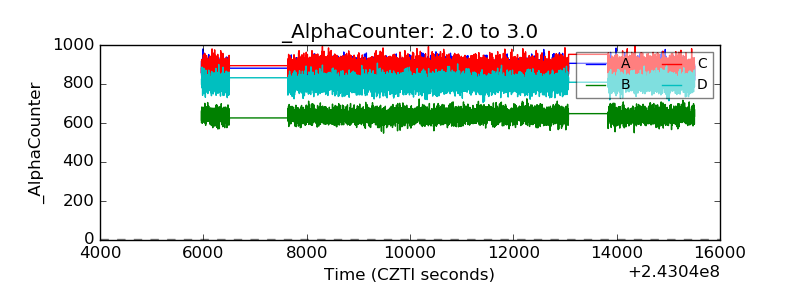 |
| _CPM_Rate | 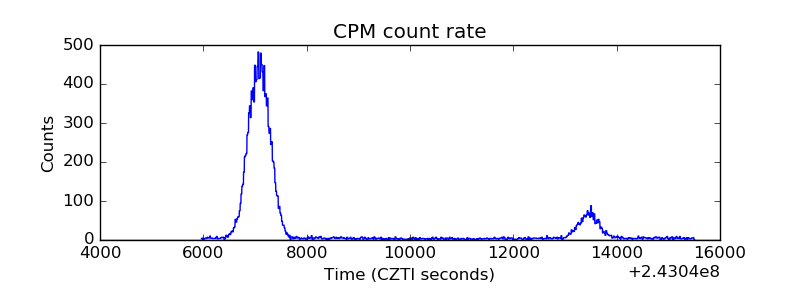 |
| CZT Counter | 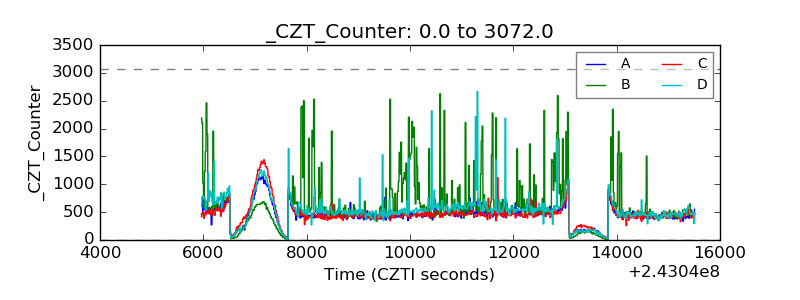 |
| +2.5 Volts monitor |  |
| +5 Volts monitor |  |
| _ROLL_ROT | 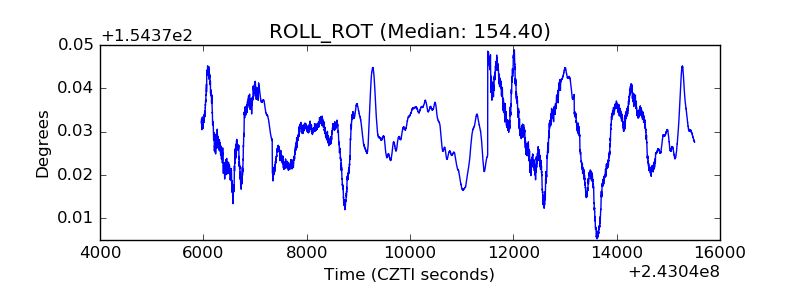 |
| _Roll_DEC | 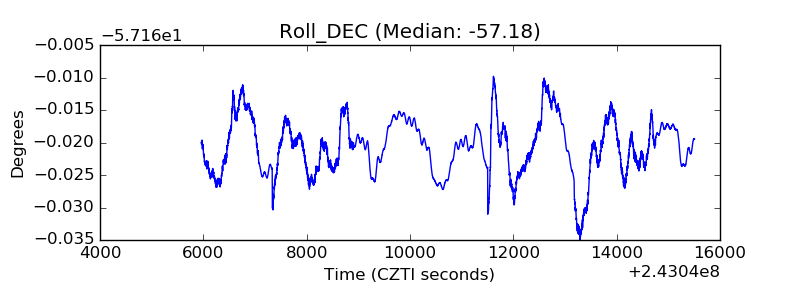 |
| _Roll_RA | 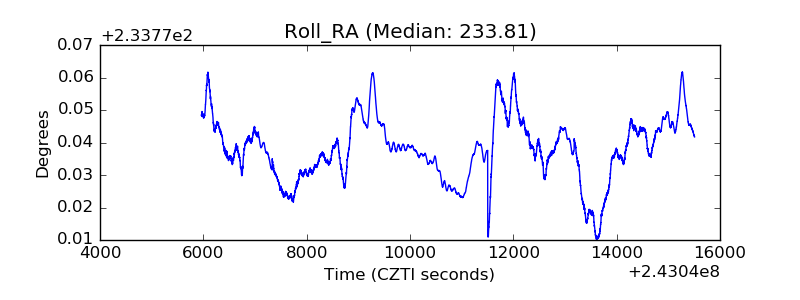 |
| Veto Counter | 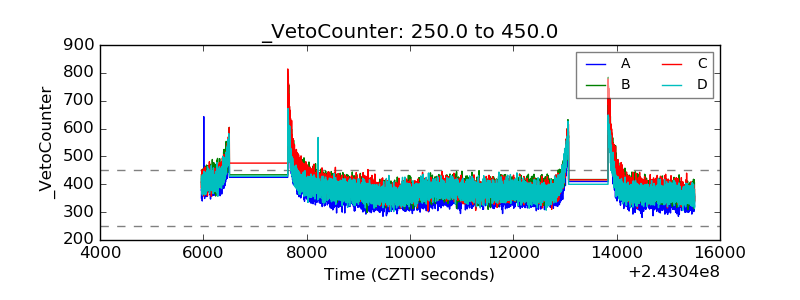 |