| Param | Original file | Final file |
|---|---|---|
| Filename | modeM0/AS1T01_191T01_9000001536_10613cztM0_level2.evt | modeM0/AS1T01_191T01_9000001536_10613cztM0_level2_quad_clean.evt |
| Size (bytes) | 569,687,040 | 98,899,200 |
| Size | 543.3 MB | 94.3 MB |
| Events in quadrant A | 3,987,633 | 624,419 |
| Events in quadrant B | 4,719,993 | 622,774 |
| Events in quadrant C | 3,489,555 | 637,618 |
| Events in quadrant D | 4,554,732 | 596,260 |
| Mode SS | |||
|---|---|---|---|
| Quadrant | BADHDUFLAG | Total packets | Discarded packets |
| A | 0 | 150 | 0 |
| B | 0 | 150 | 0 |
| C | 0 | 150 | 0 |
| D | 0 | 150 | 0 |
| Mode M9 | |||
|---|---|---|---|
| Quadrant | BADHDUFLAG | Total packets | Discarded packets |
| A | 0 | 2 | 0 |
| B | 0 | 2 | 0 |
| C | 0 | 2 | 0 |
| D | 0 | 2 | 0 |
| Mode M0 | |||
|---|---|---|---|
| Quadrant | BADHDUFLAG | Total packets | Discarded packets |
| A | 0 | 16689 | 2 |
| B | 0 | 18785 | 1 |
| C | 0 | 15308 | 1 |
| D | 0 | 18491 | 1 |
| Quadrant | Total seconds | Saturated seconds | Saturation percentage |
|---|---|---|---|
| A | 7390 | 341 | 4.614344% |
| B | 7390 | 553 | 7.483085% |
| C | 7390 | 247 | 3.342355% |
| D | 7390 | 251 | 3.396482% |
Noise dominated data is calculated using 1-second bins in cleaned event files. If a bin has >2000 counts, and if more than 50% of those come from <1% of pixels, then it is considered to be noise-dominated and hence unusable.
| Quadrant | # 1 sec bins | Bins with >0 counts | Bins with >2000 counts | High rate bins dominated by noise | Noise dominated (total time) | Noise dominated (detector-on time) | Marked lightcurve |
|---|---|---|---|---|---|---|---|
| A | 7505 | 7392 | 83 | 83 | 1.11% | 1.12% | 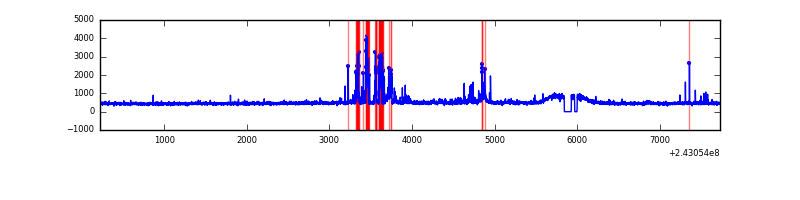 |
| B | 7505 | 7392 | 162 | 162 | 2.16% | 2.19% | 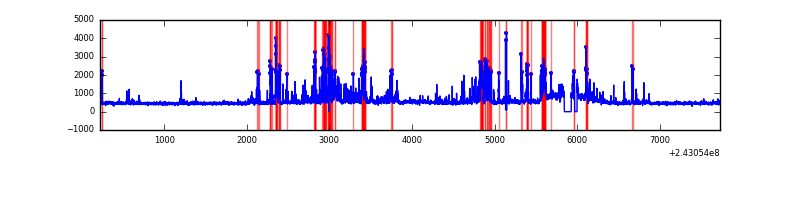 |
| C | 7505 | 7392 | 1 | 1 | 0.01% | 0.01% | 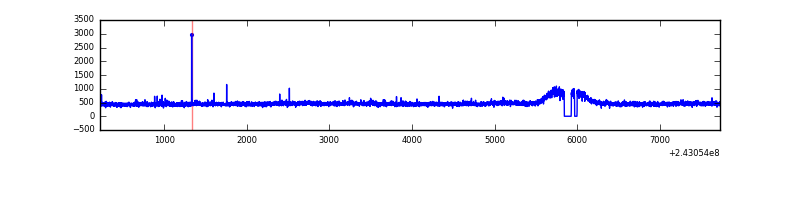 |
| D | 7505 | 7391 | 12 | 12 | 0.16% | 0.16% | 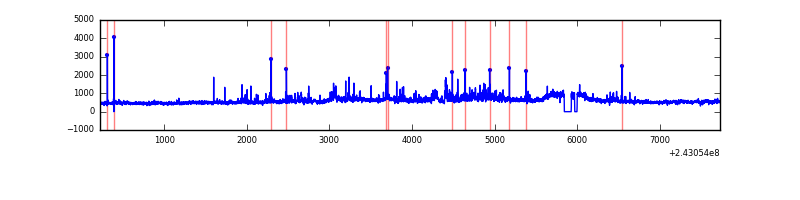 |
Top three noisy pixels from each quadrant. If the there are fewer than three noisy pixels in the level2.evt file, extra rows are filled as -1
| Pixel properties | Quadrant properties | ||||||
|---|---|---|---|---|---|---|---|
| Quadrant | DetID | PixID | Counts | Sigma | Mean | Median | Sigma |
| A | 15 | 174 | 463292 | 2491.01 | 897 | 878 | 185.6 |
| A | 1 | 162 | 24443 | 126.94 | 897 | 878 | 185.6 |
| A | 13 | 251 | 13162 | 66.17 | 897 | 878 | 185.6 |
| B | 4 | 239 | 1090599 | 6381.85 | 885 | 865 | 170.8 |
| B | 0 | 219 | 98967 | 574.52 | 885 | 865 | 170.8 |
| B | 0 | 214 | 35117 | 200.59 | 885 | 865 | 170.8 |
| C | 14 | 67 | 18399 | 85.33 | 884 | 893 | 205.2 |
| C | 4 | 254 | 11444 | 51.43 | 884 | 893 | 205.2 |
| C | 14 | 234 | 7473 | 32.07 | 884 | 893 | 205.2 |
| D | 8 | 195 | 633175 | 2997.5 | 871 | 848 | 211.0 |
| D | 2 | 16 | 247376 | 1168.65 | 871 | 848 | 211.0 |
| D | 5 | 222 | 183526 | 865.97 | 871 | 848 | 211.0 |
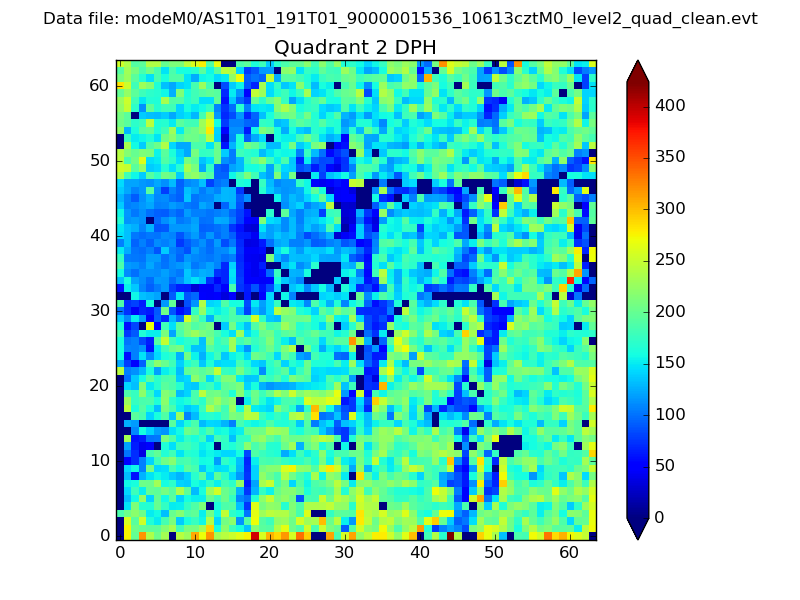
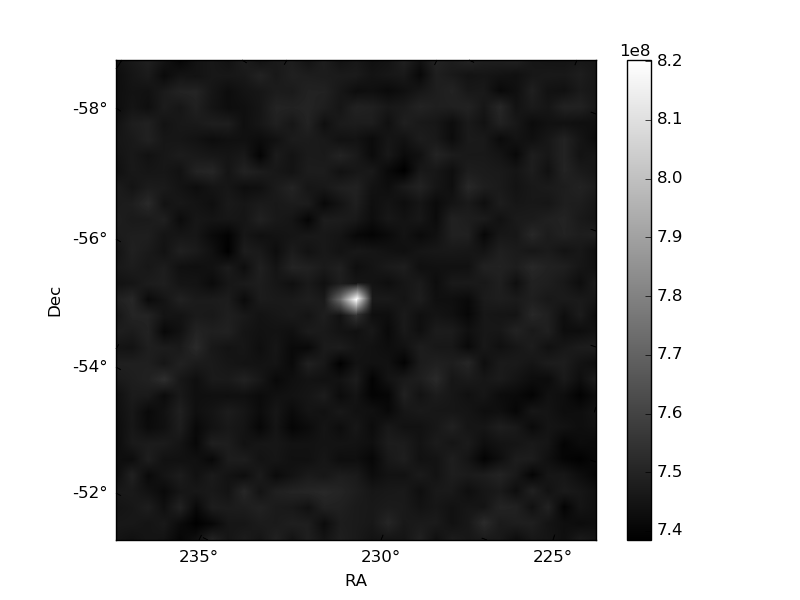
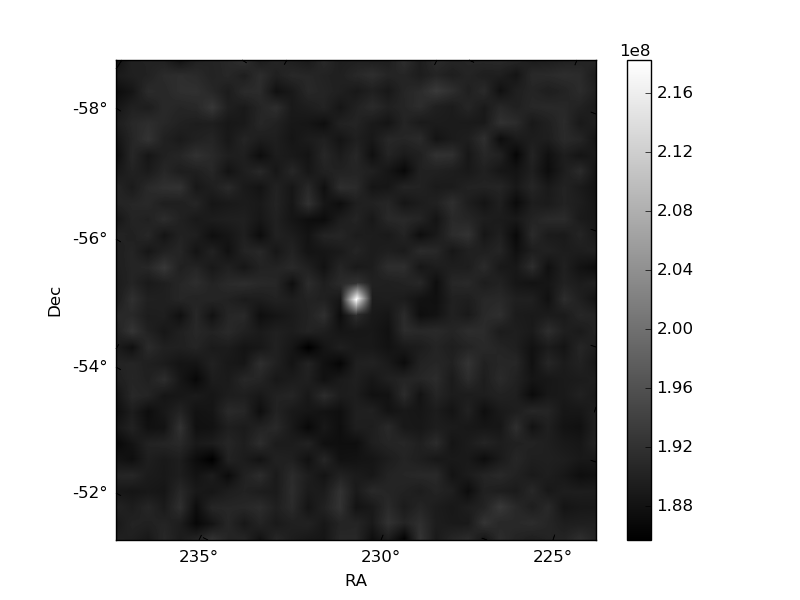
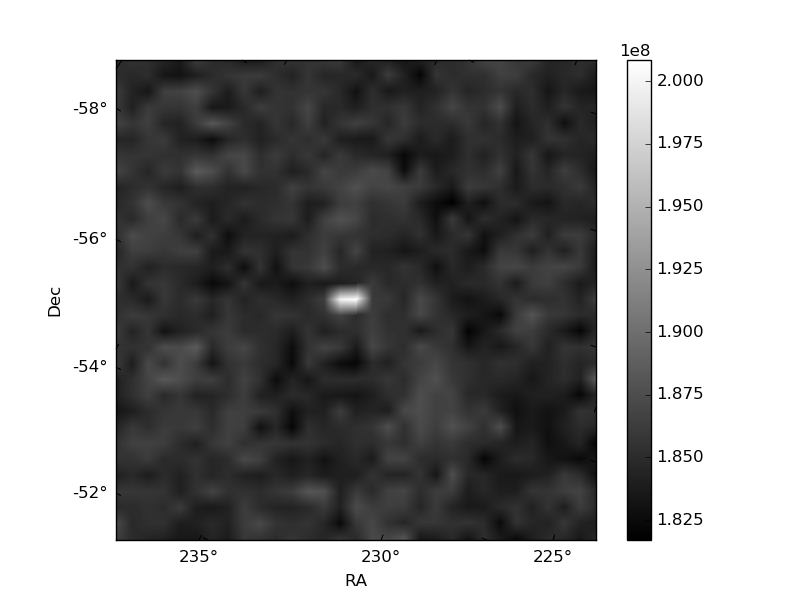
Histogram calculated using DETX and DETY for each event in the final _common_clean file
| Quadrant A | 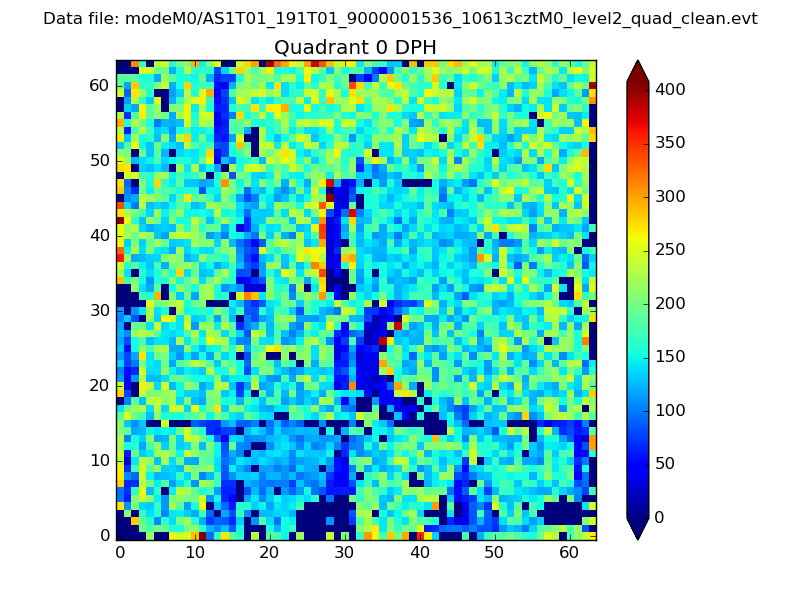 |
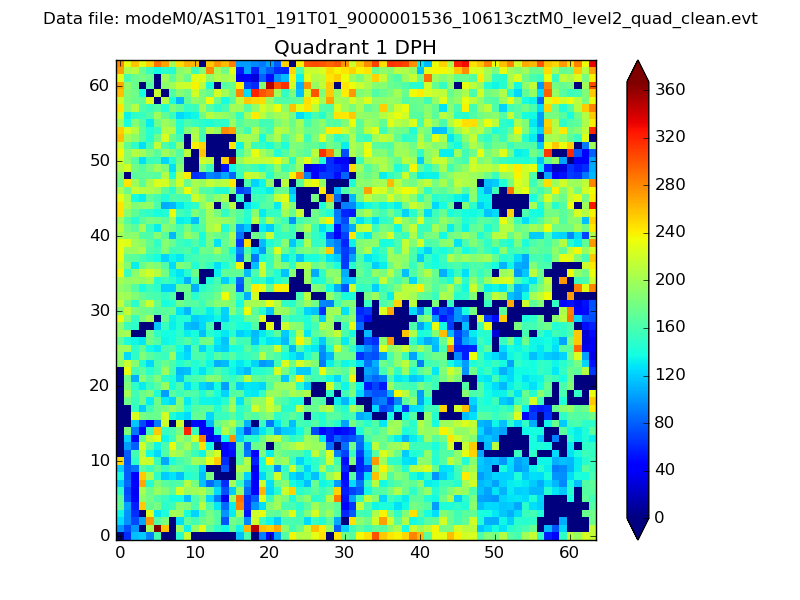 |
Quadrant B |
|---|---|---|---|
| Quadrant D | 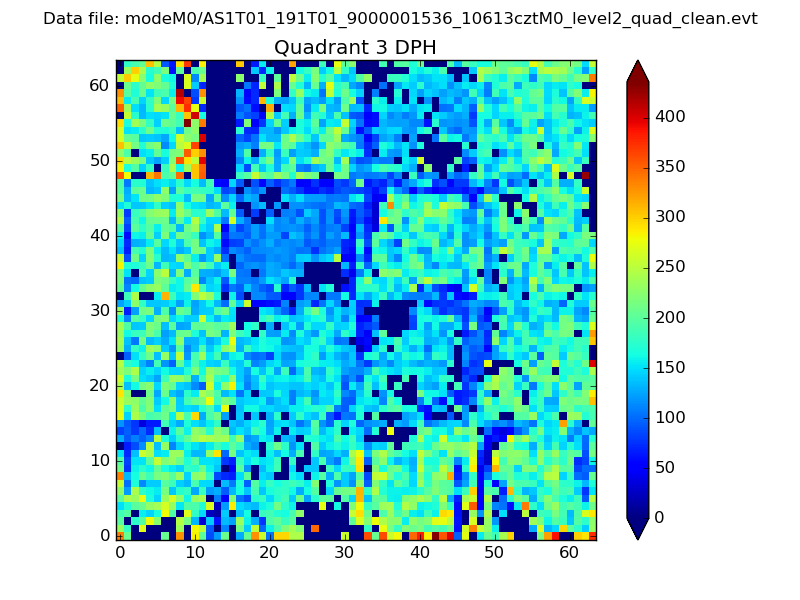 |
 |
Quadrant C |
| Plot type | Count rate plots | Images |
|---|---|---|
| Comparison with Poisson distribution Blue bars denote a histogram of data divided into 1 sec bins. Red curve is a Poisson curve with rate = median count rate of data. |
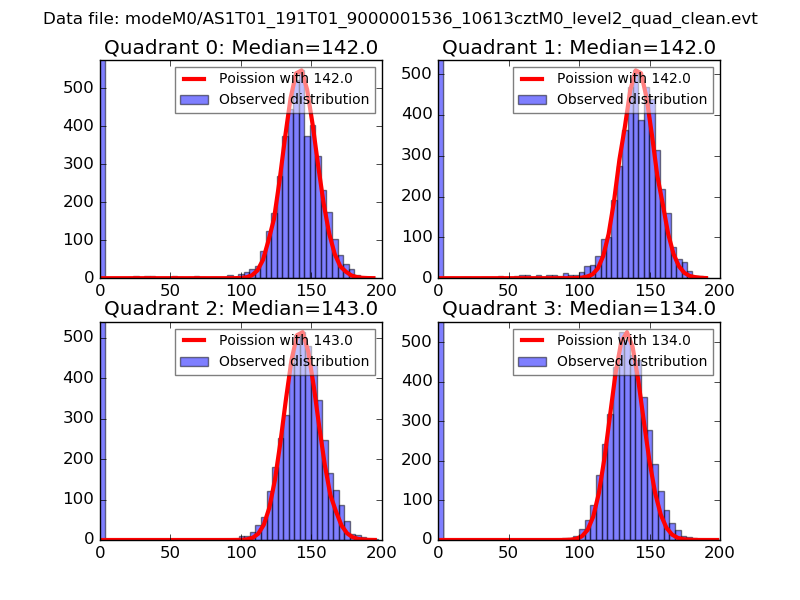 |
 |
| Quadrant-wise count rates Data is divided into 100 sec bins |
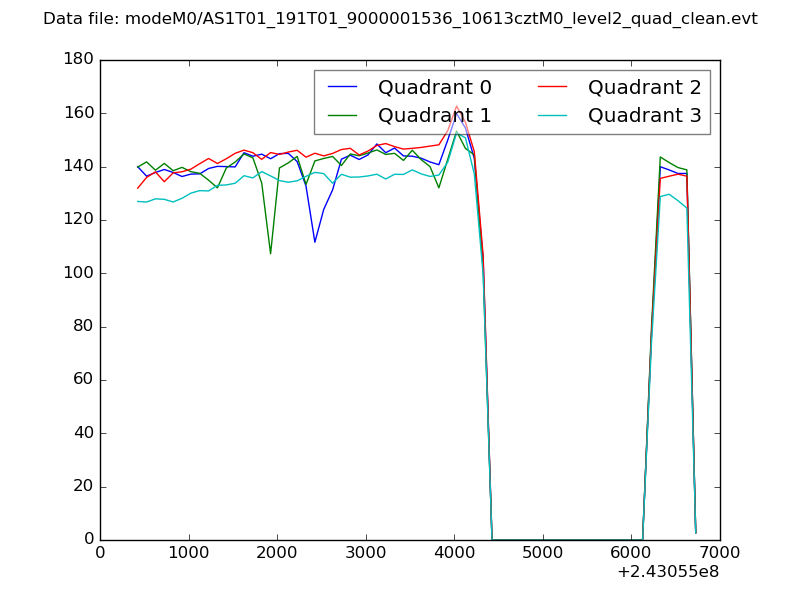 |
|
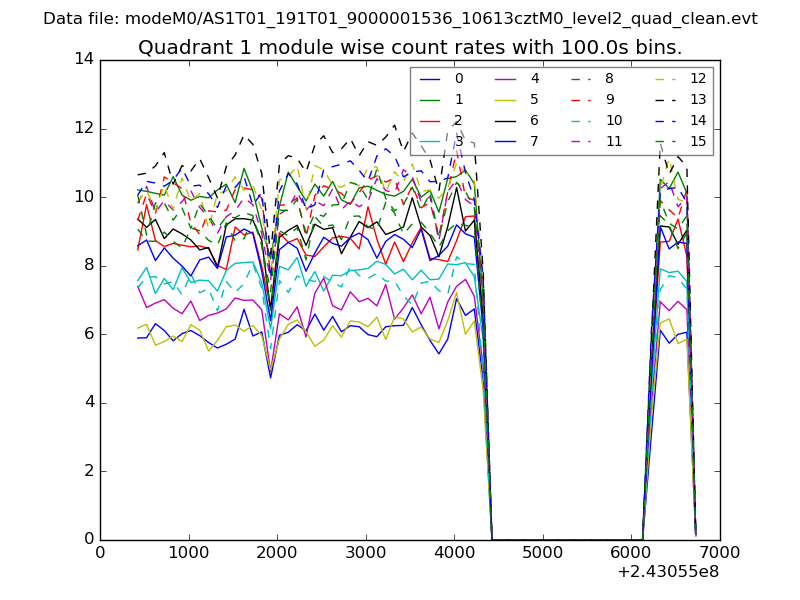
| Module-wise count rates for Quadrant A Data is divided into 100 sec bins |
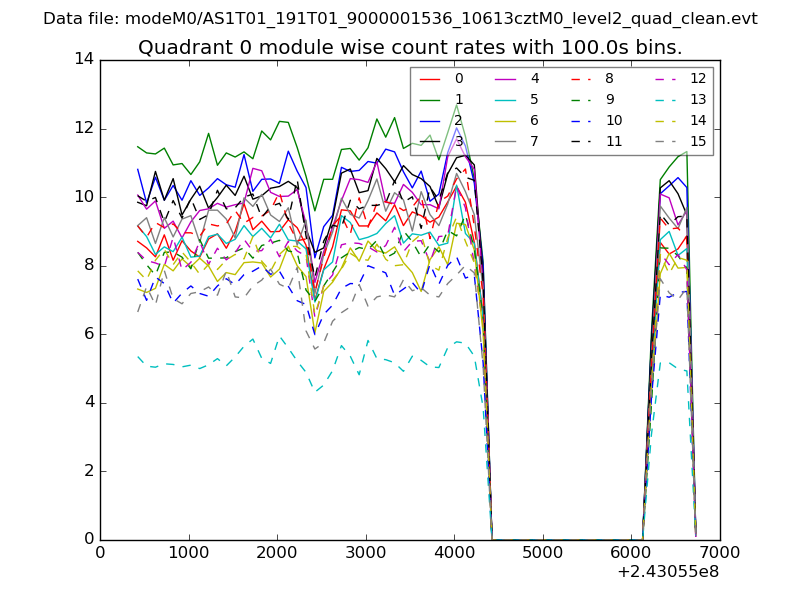 |
 |
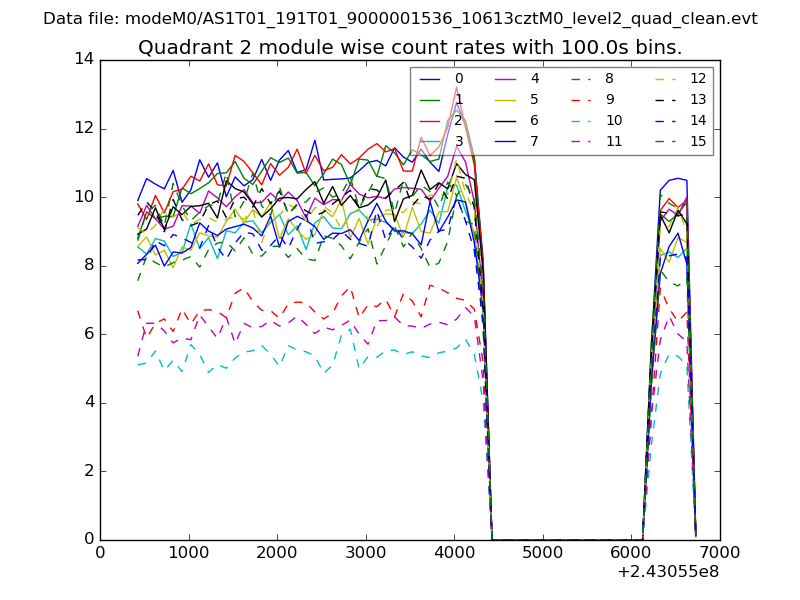
| Module-wise count rates for Quadrant B Data is divided into 100 sec bins |
 |
 |
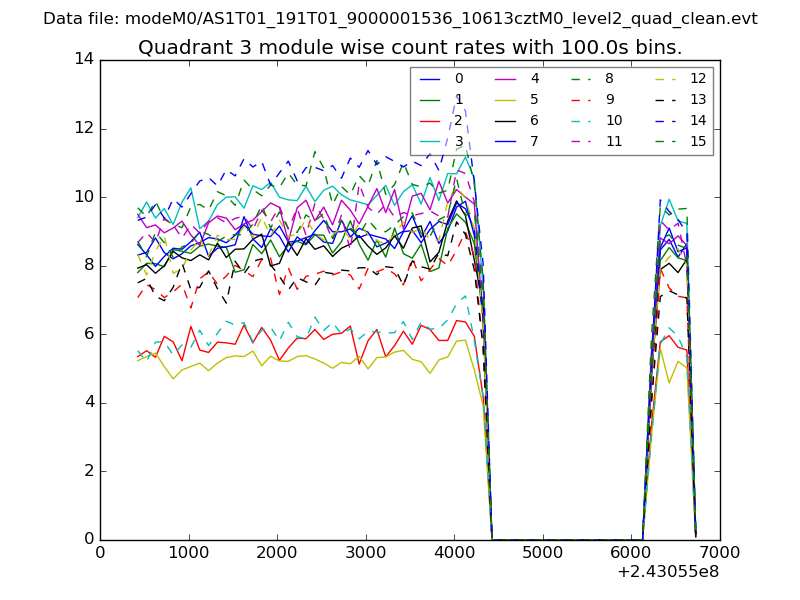
| Module-wise count rates for Quadrant C Data is divided into 100 sec bins |
 |
 |
| Module-wise count rates for Quadrant D Data is divided into 100 sec bins |
 |
 |
| Parameter | Plot |
|---|---|
| CZT HV Monitor | 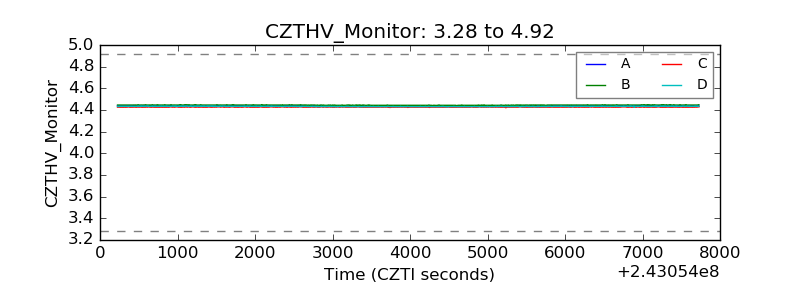 |
| D_VDD | 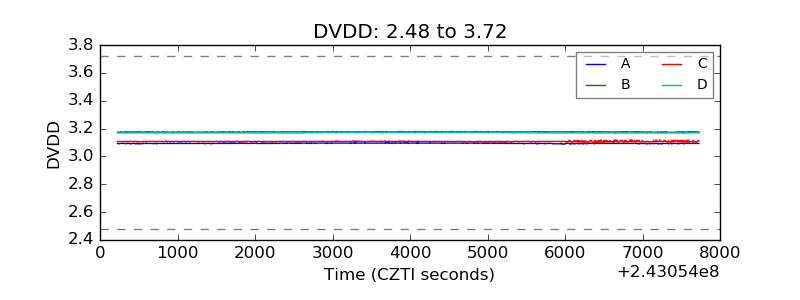 |
| Temperature 1 | 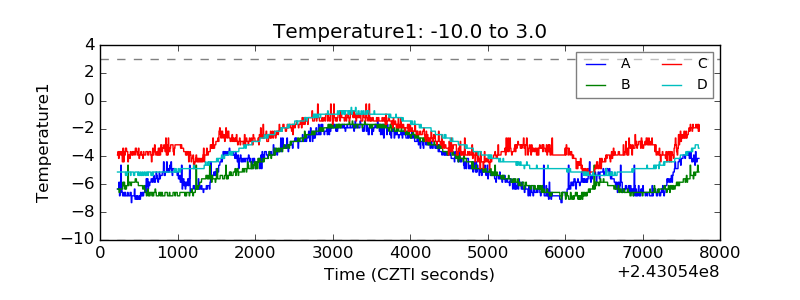 |
| Veto HV Monitor | 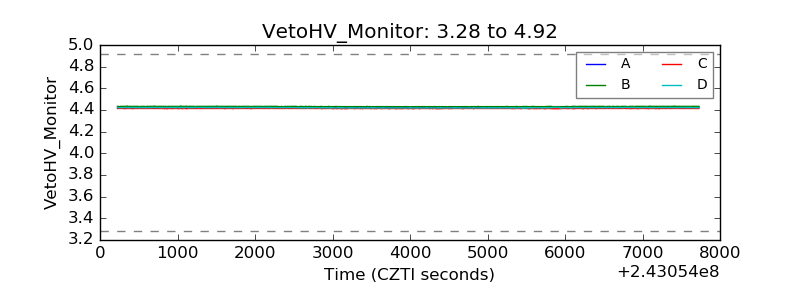 |
| Veto LLD | 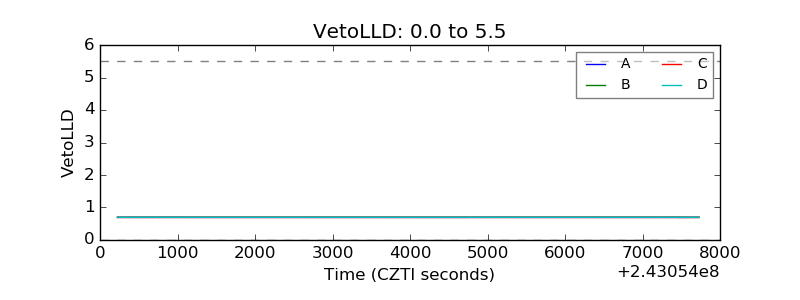 |
| Alpha Counter | 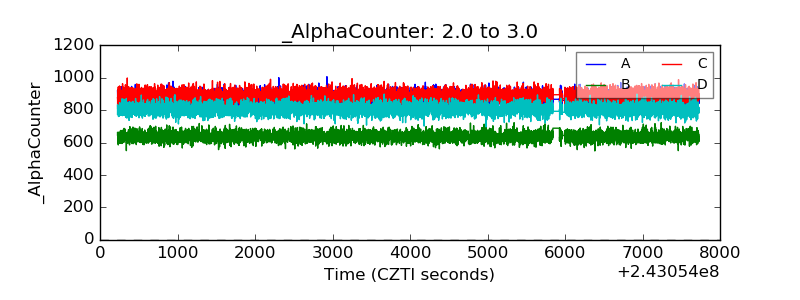 |
| _CPM_Rate | 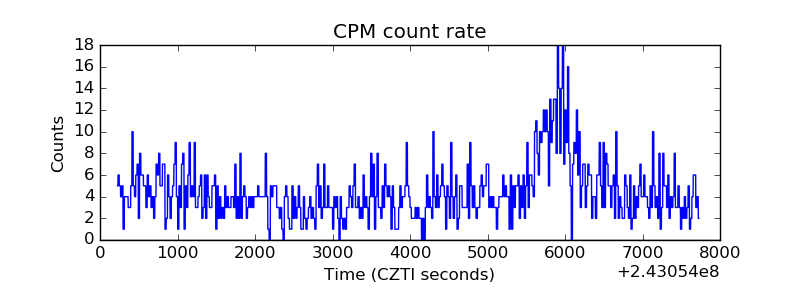 |
| CZT Counter | 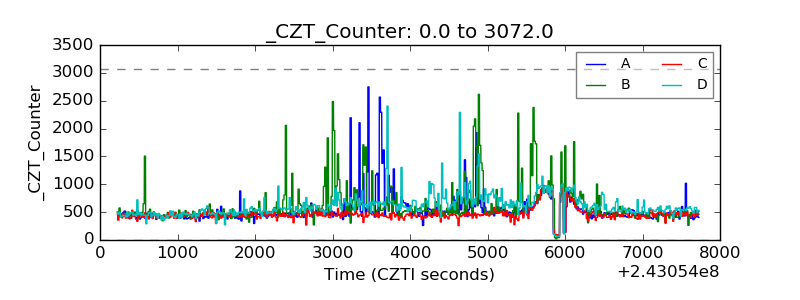 |
| +2.5 Volts monitor |  |
| +5 Volts monitor |  |
| _ROLL_ROT | 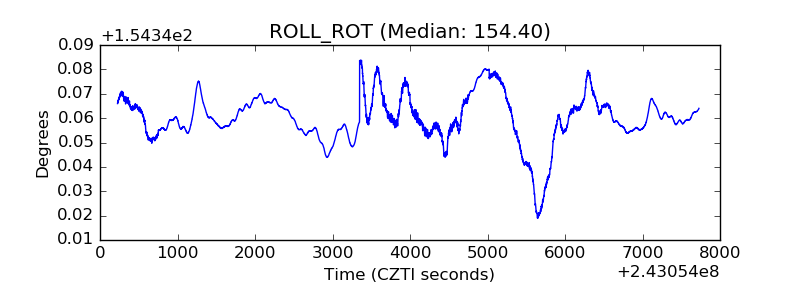 |
| _Roll_DEC | 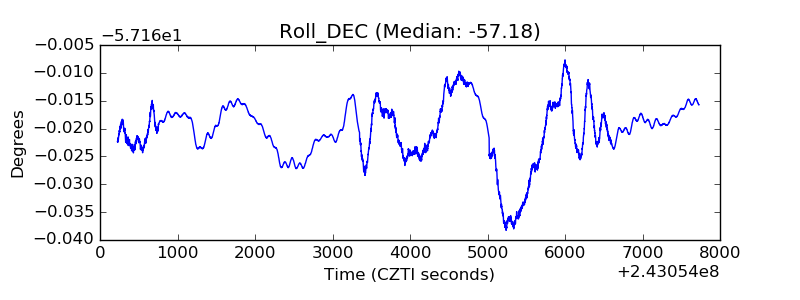 |
| _Roll_RA | 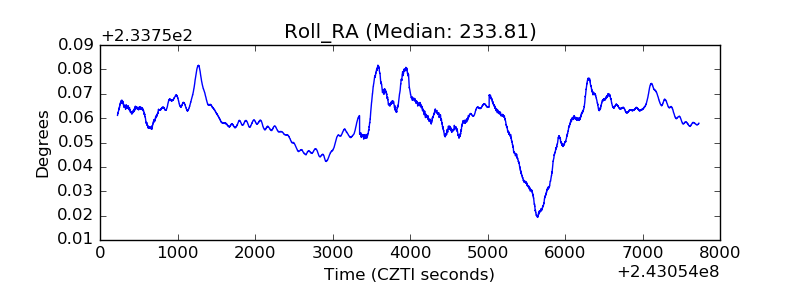 |
| Veto Counter | 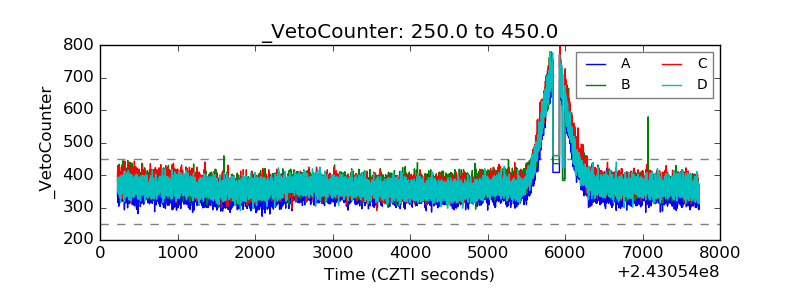 |