| Param | Original file | Final file |
|---|---|---|
| Filename | modeM0/AS1T01_191T01_9000001536_10614cztM0_level2.evt | modeM0/AS1T01_191T01_9000001536_10614cztM0_level2_quad_clean.evt |
| Size (bytes) | 557,455,680 | 105,096,960 |
| Size | 531.6 MB | 100.2 MB |
| Events in quadrant A | 3,575,960 | 678,260 |
| Events in quadrant B | 4,567,606 | 671,300 |
| Events in quadrant C | 3,489,371 | 680,835 |
| Events in quadrant D | 4,743,682 | 633,736 |
| Mode SS | |||
|---|---|---|---|
| Quadrant | BADHDUFLAG | Total packets | Discarded packets |
| A | 0 | 150 | 0 |
| B | 0 | 150 | 0 |
| C | 0 | 150 | 0 |
| D | 0 | 150 | 0 |
| Mode M0 | |||
|---|---|---|---|
| Quadrant | BADHDUFLAG | Total packets | Discarded packets |
| A | 0 | 15466 | 2 |
| B | 0 | 18344 | 1 |
| C | 0 | 15370 | 1 |
| D | 0 | 18897 | 1 |
| Quadrant | Total seconds | Saturated seconds | Saturation percentage |
|---|---|---|---|
| A | 7452 | 171 | 2.294686% |
| B | 7452 | 381 | 5.112721% |
| C | 7452 | 129 | 1.731079% |
| D | 7452 | 159 | 2.133655% |
Noise dominated data is calculated using 1-second bins in cleaned event files. If a bin has >2000 counts, and if more than 50% of those come from <1% of pixels, then it is considered to be noise-dominated and hence unusable.
| Quadrant | # 1 sec bins | Bins with >0 counts | Bins with >2000 counts | High rate bins dominated by noise | Noise dominated (total time) | Noise dominated (detector-on time) | Marked lightcurve |
|---|---|---|---|---|---|---|---|
| A | 7472 | 7453 | 1 | 1 | 0.01% | 0.01% | 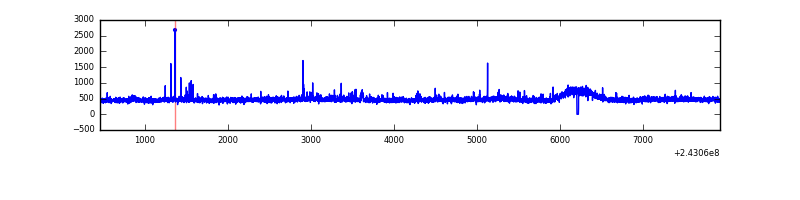 |
| B | 7472 | 7453 | 100 | 100 | 1.34% | 1.34% | 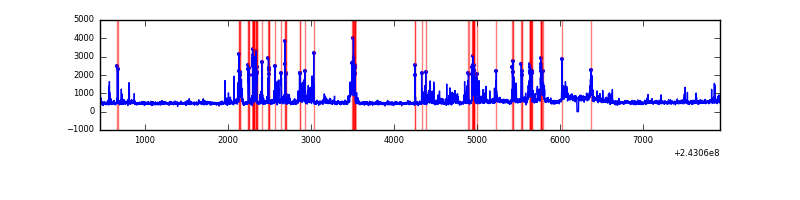 |
| C | 7472 | 7453 | 2 | 2 | 0.03% | 0.03% | 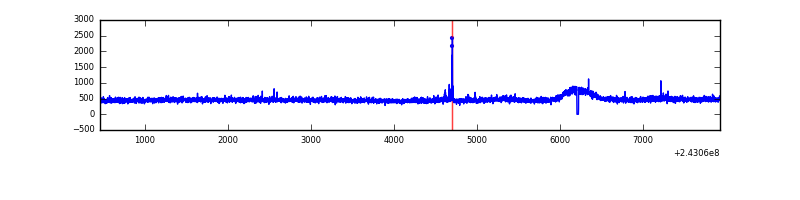 |
| D | 7472 | 7453 | 21 | 21 | 0.28% | 0.28% | 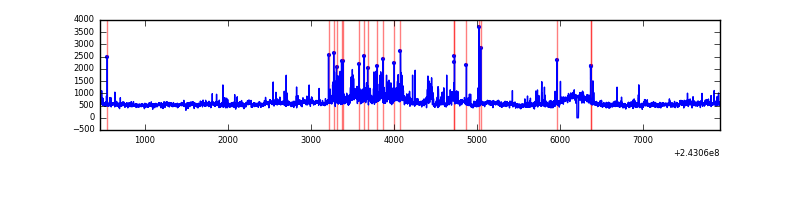 |
Top three noisy pixels from each quadrant. If the there are fewer than three noisy pixels in the level2.evt file, extra rows are filled as -1
| Pixel properties | Quadrant properties | ||||||
|---|---|---|---|---|---|---|---|
| Quadrant | DetID | PixID | Counts | Sigma | Mean | Median | Sigma |
| A | 13 | 251 | 39823 | 207.4 | 902 | 883 | 187.8 |
| A | 1 | 162 | 18859 | 95.74 | 902 | 883 | 187.8 |
| A | 15 | 174 | 17660 | 89.36 | 902 | 883 | 187.8 |
| B | 4 | 239 | 829465 | 4747.27 | 896 | 875 | 174.5 |
| B | 0 | 219 | 120732 | 686.7 | 896 | 875 | 174.5 |
| B | 0 | 214 | 55253 | 311.55 | 896 | 875 | 174.5 |
| C | 4 | 254 | 21936 | 102.92 | 882 | 891 | 204.5 |
| C | 4 | 175 | 9123 | 40.26 | 882 | 891 | 204.5 |
| C | 8 | 128 | 7827 | 33.92 | 882 | 891 | 204.5 |
| D | 8 | 195 | 551607 | 2590.01 | 870 | 846 | 212.6 |
| D | 2 | 16 | 468505 | 2199.22 | 870 | 846 | 212.6 |
| D | 5 | 222 | 177779 | 832.05 | 870 | 846 | 212.6 |
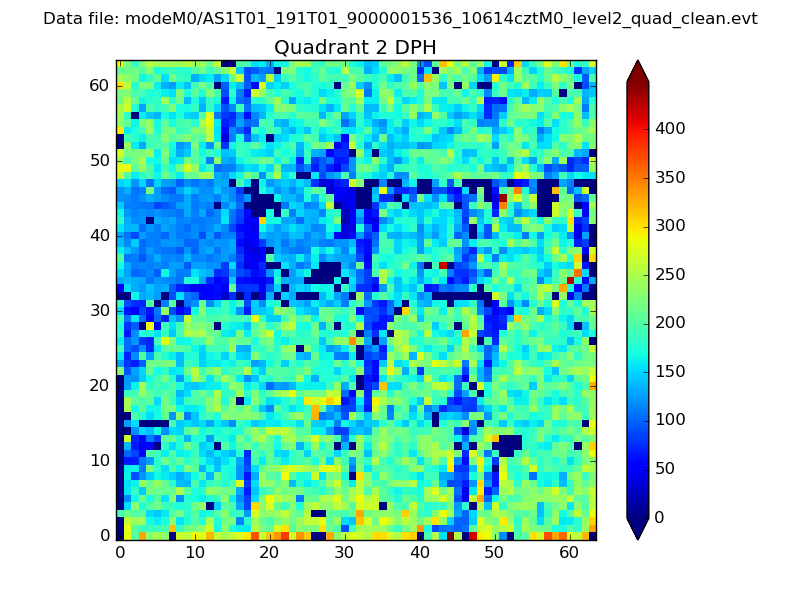
Histogram calculated using DETX and DETY for each event in the final _common_clean file
| Quadrant A | 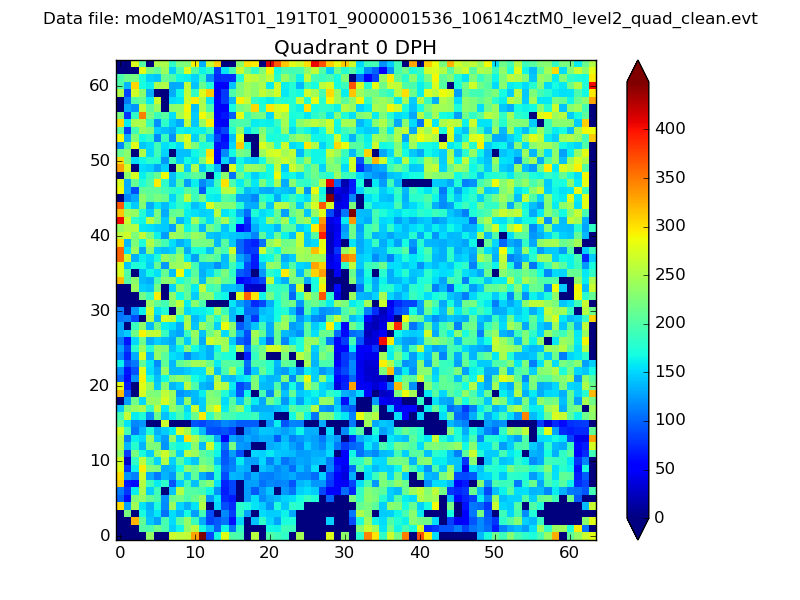 |
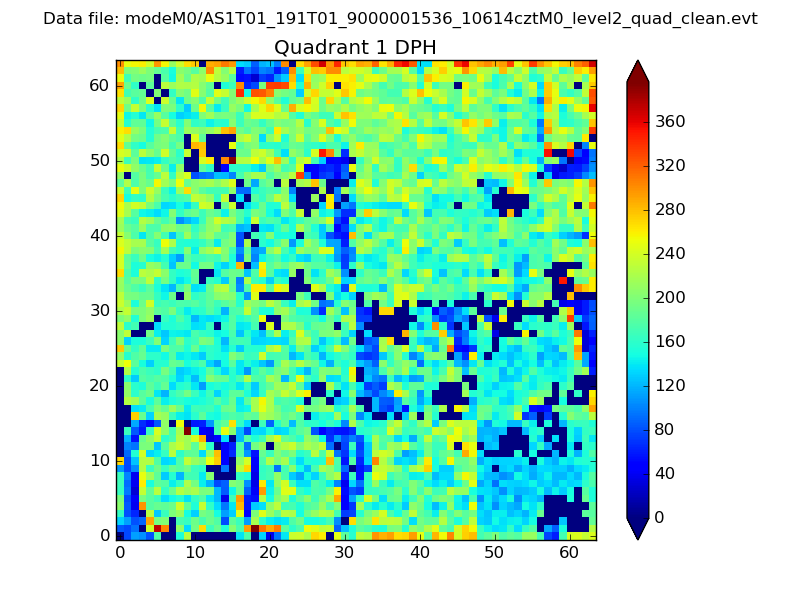 |
Quadrant B |
|---|---|---|---|
| Quadrant D | 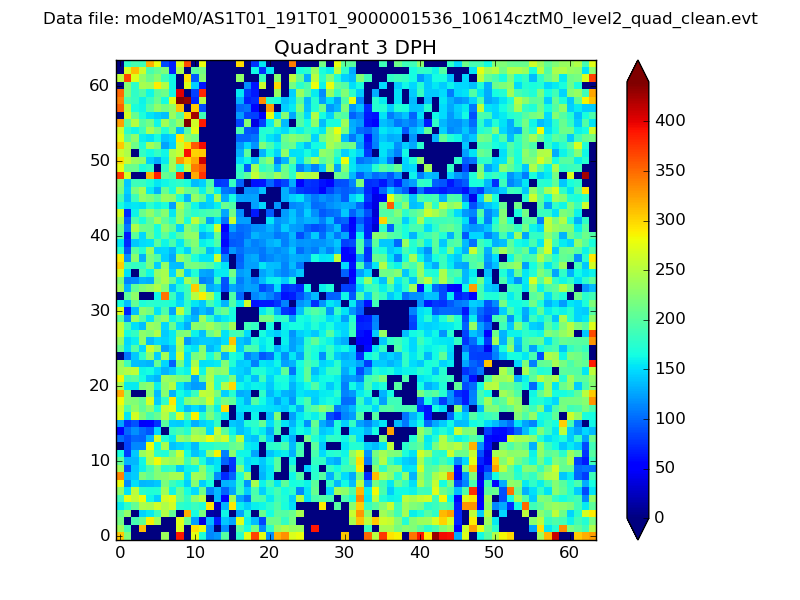 |
 |
Quadrant C |
| Plot type | Count rate plots | Images |
|---|---|---|
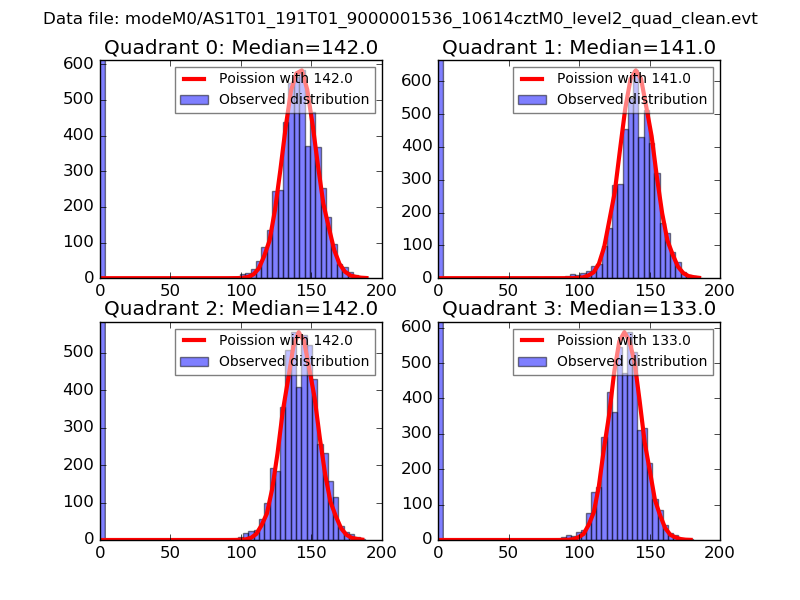
| Comparison with Poisson distribution Blue bars denote a histogram of data divided into 1 sec bins. Red curve is a Poisson curve with rate = median count rate of data. |
 |
 |
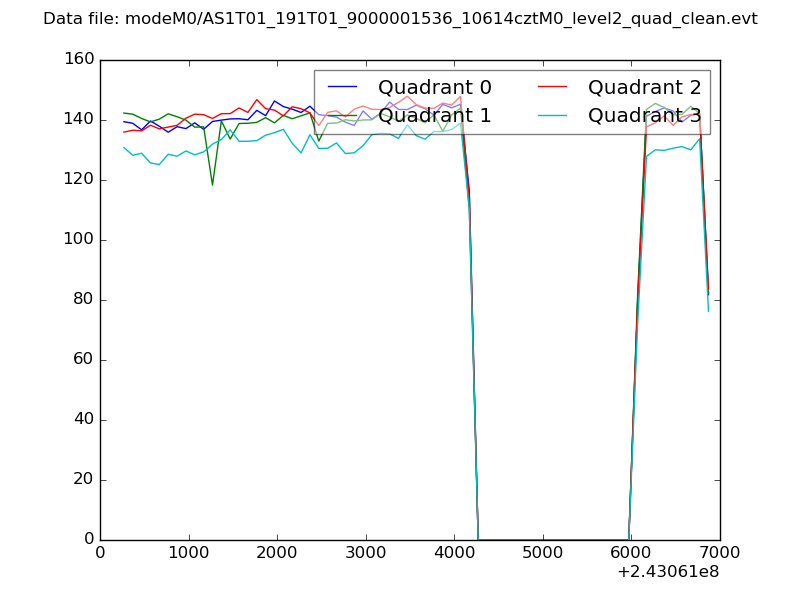
| Quadrant-wise count rates Data is divided into 100 sec bins |
 |
|
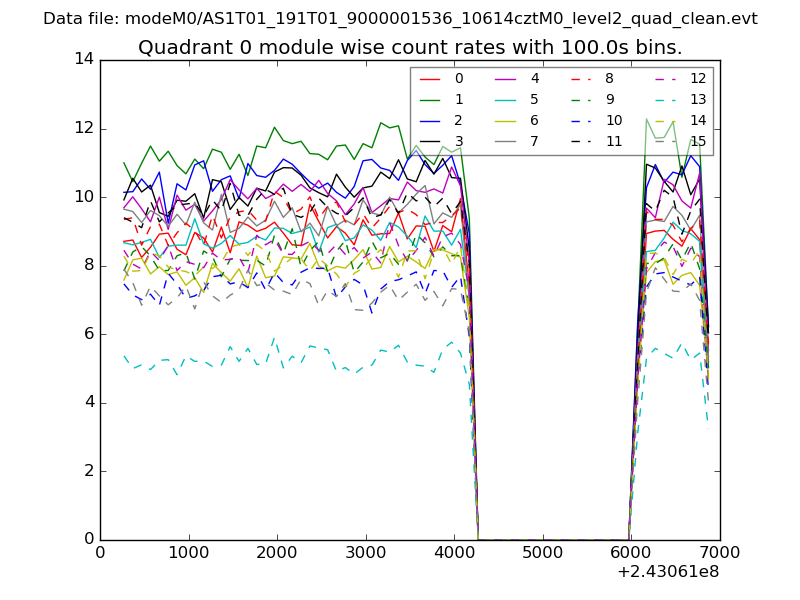
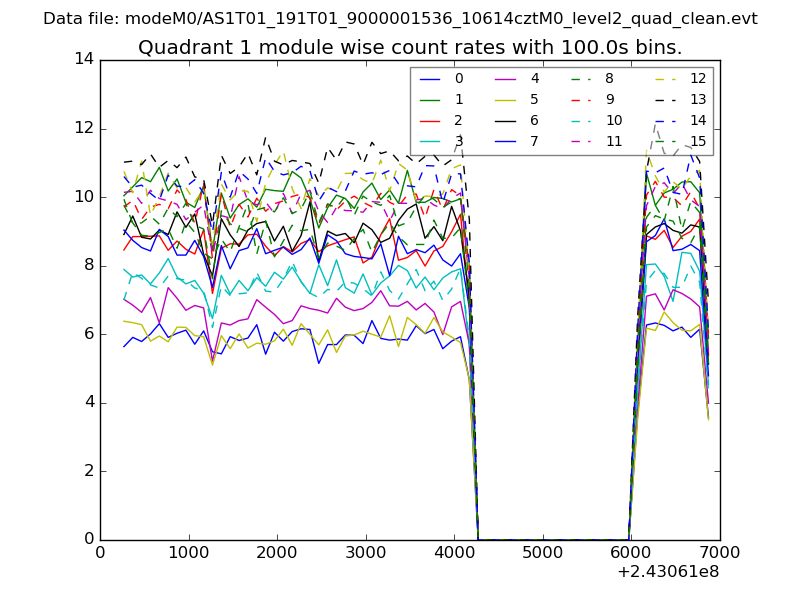
| Module-wise count rates for Quadrant A Data is divided into 100 sec bins |
 |
 |
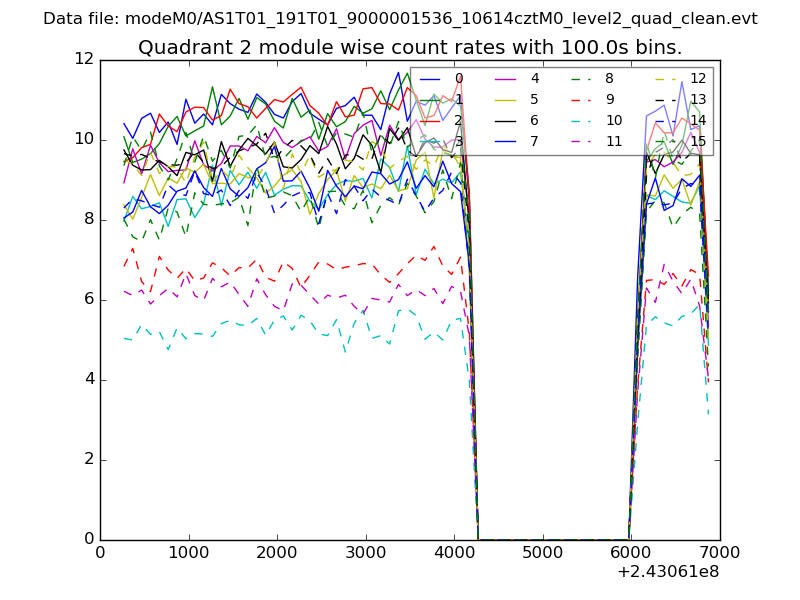
| Module-wise count rates for Quadrant B Data is divided into 100 sec bins |
 |
 |
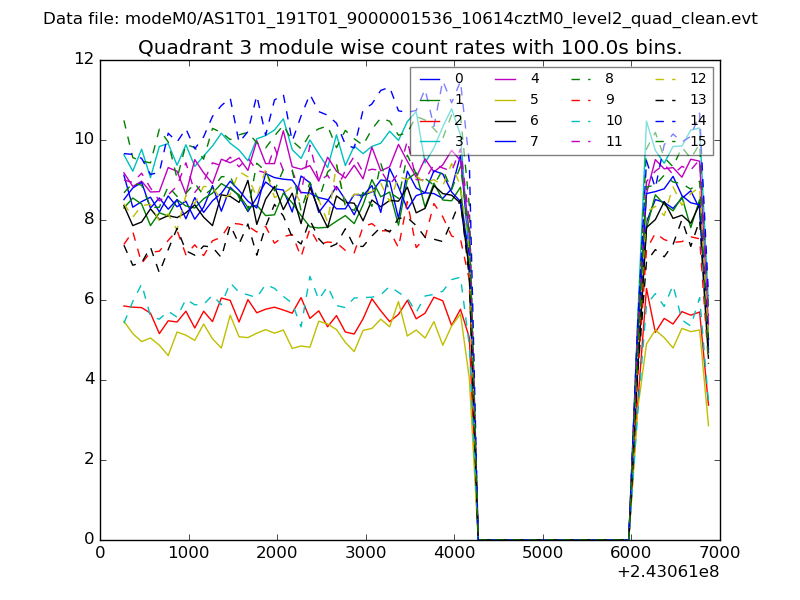
| Module-wise count rates for Quadrant C Data is divided into 100 sec bins |
 |
 |
| Module-wise count rates for Quadrant D Data is divided into 100 sec bins |
 |
 |
| Parameter | Plot |
|---|---|
| CZT HV Monitor | 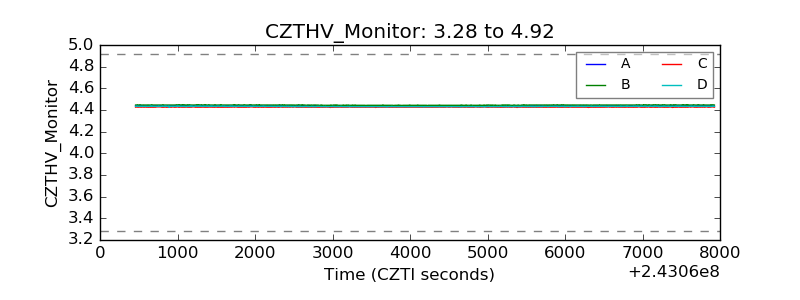 |
| D_VDD | 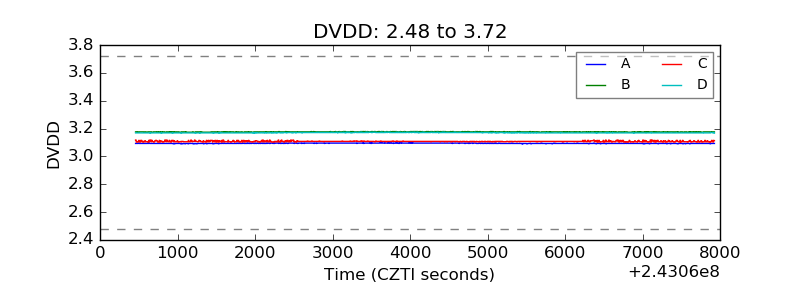 |
| Temperature 1 | 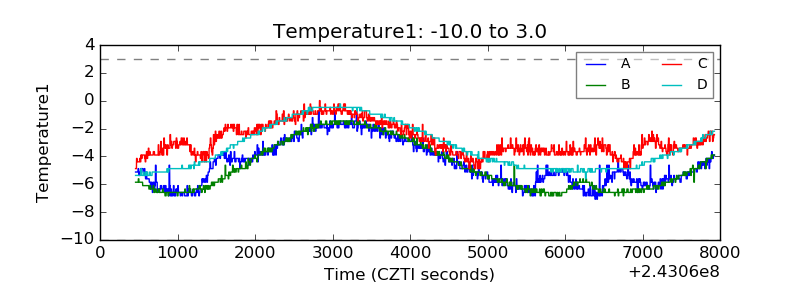 |
| Veto HV Monitor | 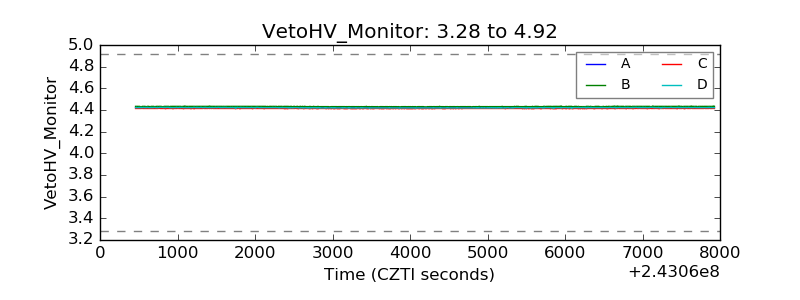 |
| Veto LLD | 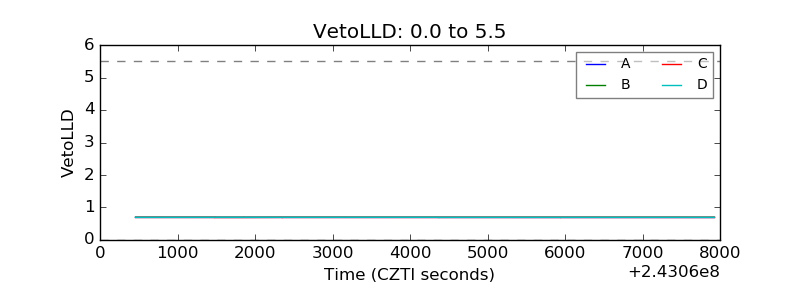 |
| Alpha Counter | 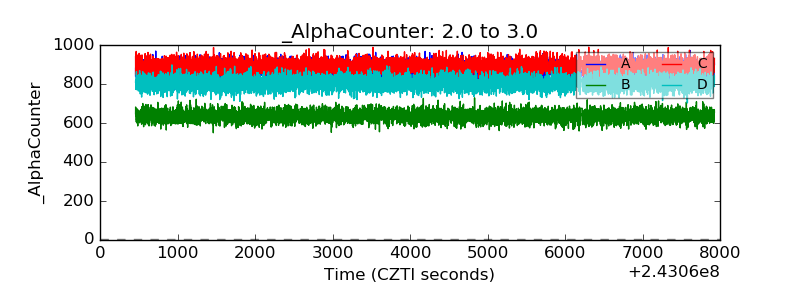 |
| _CPM_Rate | 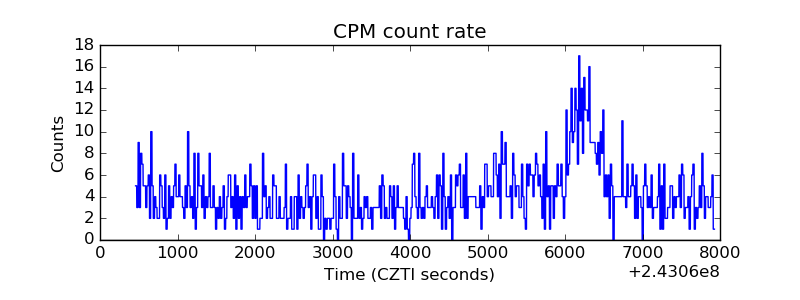 |
| CZT Counter | 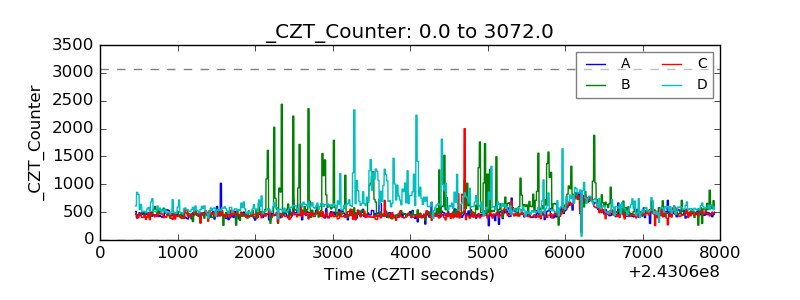 |
| +2.5 Volts monitor | 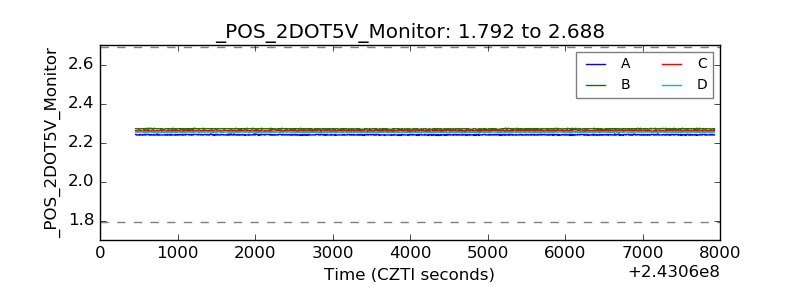 |
| +5 Volts monitor |  |
| _ROLL_ROT | 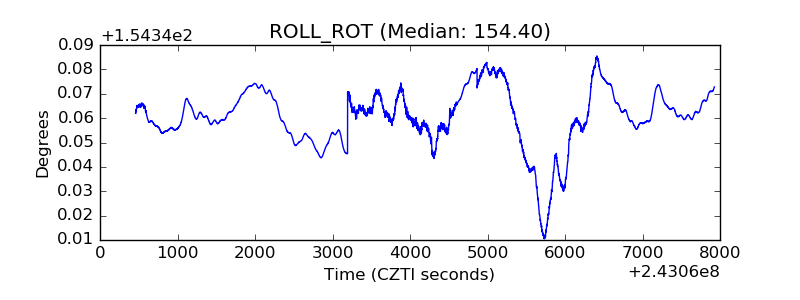 |
| _Roll_DEC | 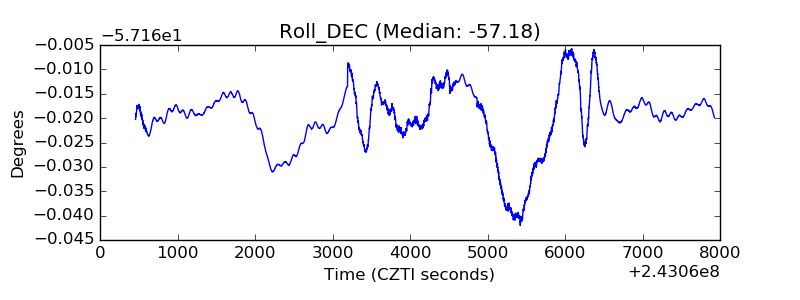 |
| _Roll_RA | 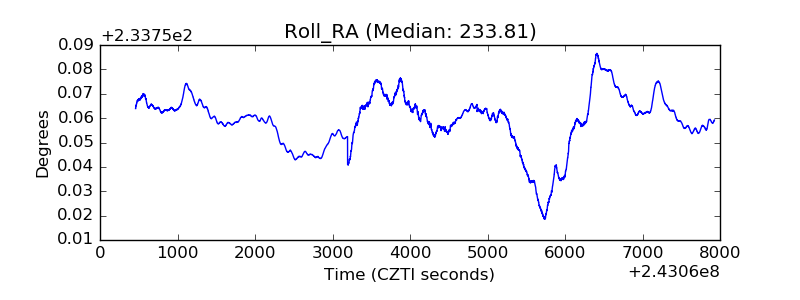 |
| Veto Counter | 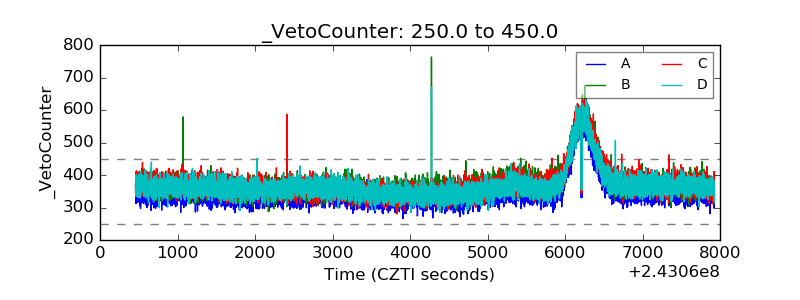 |