| Param | Original file | Final file |
|---|---|---|
| Filename | modeM0/AS1T01_191T01_9000001536_10617cztM0_level2.evt | modeM0/AS1T01_191T01_9000001536_10617cztM0_level2_quad_clean.evt |
| Size (bytes) | 921,804,480 | 187,188,480 |
| Size | 879.1 MB | 178.5 MB |
| Events in quadrant A | 5,761,319 | 1,234,022 |
| Events in quadrant B | 8,441,955 | 1,193,238 |
| Events in quadrant C | 5,613,973 | 1,238,855 |
| Events in quadrant D | 7,277,083 | 1,162,389 |
| Mode SS | |||
|---|---|---|---|
| Quadrant | BADHDUFLAG | Total packets | Discarded packets |
| A | 0 | 246 | 0 |
| B | 0 | 246 | 0 |
| C | 0 | 246 | 0 |
| D | 0 | 246 | 0 |
| Mode M9 | |||
|---|---|---|---|
| Quadrant | BADHDUFLAG | Total packets | Discarded packets |
| A | 0 | 12 | 0 |
| B | 0 | 12 | 0 |
| C | 0 | 12 | 0 |
| D | 0 | 12 | 0 |
| Mode M0 | |||
|---|---|---|---|
| Quadrant | BADHDUFLAG | Total packets | Discarded packets |
| A | 0 | 24910 | 3 |
| B | 0 | 32788 | 2 |
| C | 0 | 24809 | 2 |
| D | 0 | 29146 | 2 |
| Quadrant | Total seconds | Saturated seconds | Saturation percentage |
|---|---|---|---|
| A | 12167 | 104 | 0.854771% |
| B | 12167 | 756 | 6.213528% |
| C | 12167 | 66 | 0.542451% |
| D | 12167 | 206 | 1.693104% |
Noise dominated data is calculated using 1-second bins in cleaned event files. If a bin has >2000 counts, and if more than 50% of those come from <1% of pixels, then it is considered to be noise-dominated and hence unusable.
| Quadrant | # 1 sec bins | Bins with >0 counts | Bins with >2000 counts | High rate bins dominated by noise | Noise dominated (total time) | Noise dominated (detector-on time) | Marked lightcurve |
|---|---|---|---|---|---|---|---|
| A | 13352 | 12169 | 0 | 0 | 0.00% | 0.00% | 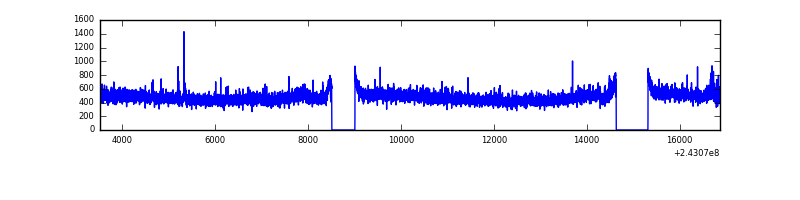 |
| B | 13352 | 12169 | 436 | 436 | 3.27% | 3.58% | 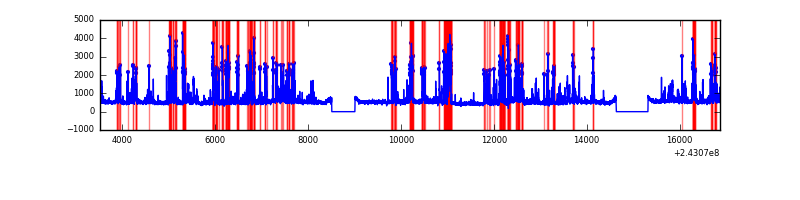 |
| C | 13352 | 12169 | 2 | 2 | 0.01% | 0.02% | 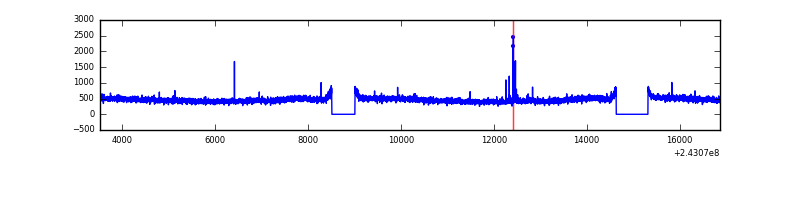 |
| D | 13352 | 12169 | 96 | 96 | 0.72% | 0.79% | 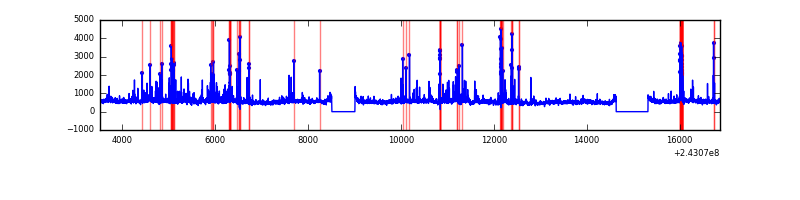 |
Top three noisy pixels from each quadrant. If the there are fewer than three noisy pixels in the level2.evt file, extra rows are filled as -1
| Pixel properties | Quadrant properties | ||||||
|---|---|---|---|---|---|---|---|
| Quadrant | DetID | PixID | Counts | Sigma | Mean | Median | Sigma |
| A | 13 | 251 | 42796 | 135.38 | 1465 | 1442 | 305.5 |
| A | 1 | 162 | 17334 | 52.02 | 1465 | 1442 | 305.5 |
| A | 13 | 210 | 16859 | 50.47 | 1465 | 1442 | 305.5 |
| B | 4 | 239 | 2405959 | 8711.85 | 1436 | 1406 | 276.0 |
| B | 0 | 219 | 188791 | 678.91 | 1436 | 1406 | 276.0 |
| B | 0 | 214 | 103199 | 368.8 | 1436 | 1406 | 276.0 |
| C | 4 | 254 | 40858 | 119.01 | 1420 | 1437 | 331.2 |
| C | 4 | 175 | 13062 | 35.09 | 1420 | 1437 | 331.2 |
| C | 13 | 61 | 10465 | 27.25 | 1420 | 1437 | 331.2 |
| D | 8 | 195 | 646979 | 1872.76 | 1409 | 1378 | 344.7 |
| D | 2 | 16 | 642263 | 1859.08 | 1409 | 1378 | 344.7 |
| D | 7 | 71 | 310700 | 897.28 | 1409 | 1378 | 344.7 |
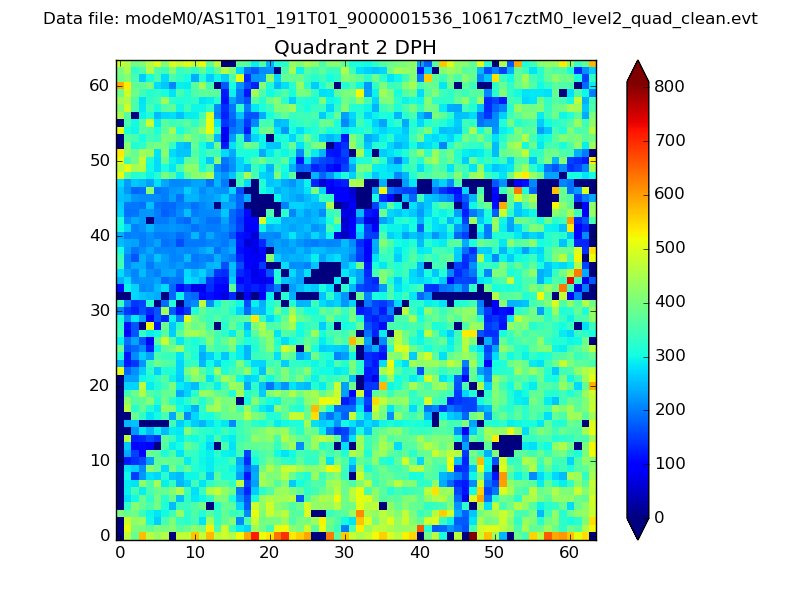
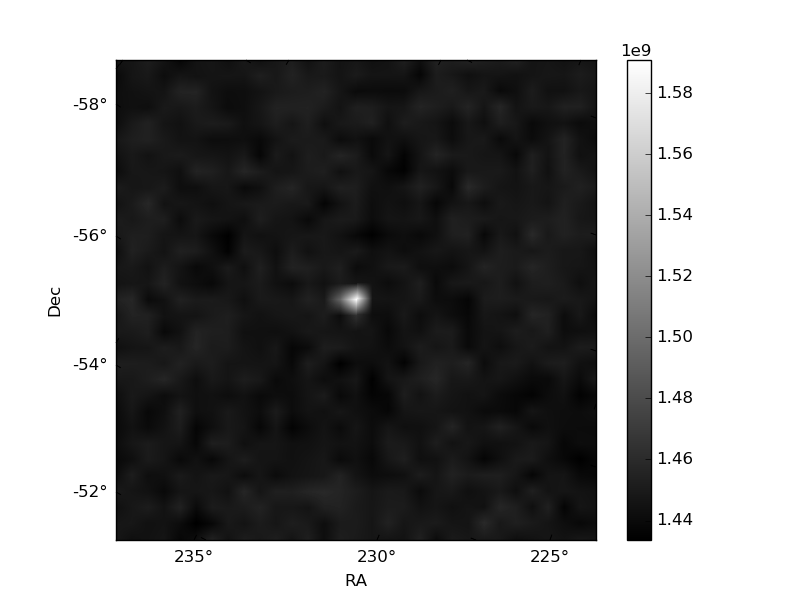
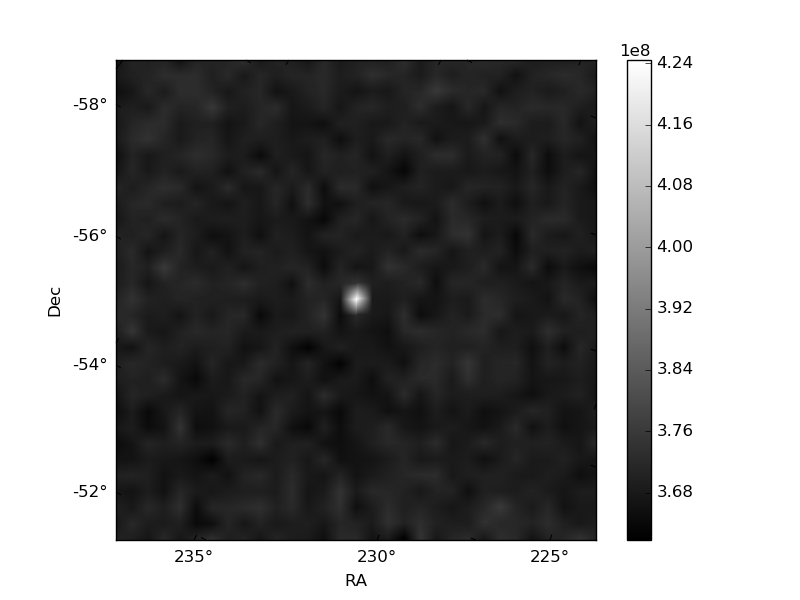
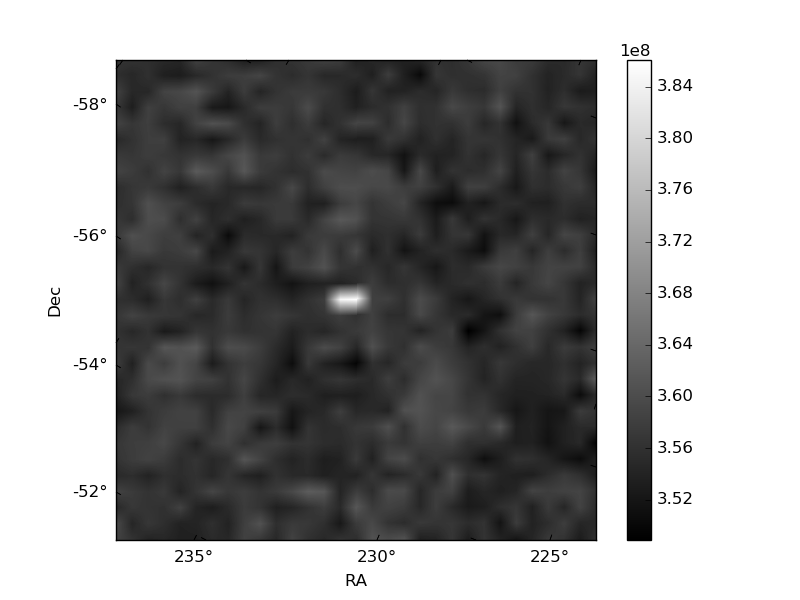
Histogram calculated using DETX and DETY for each event in the final _common_clean file
| Quadrant A | 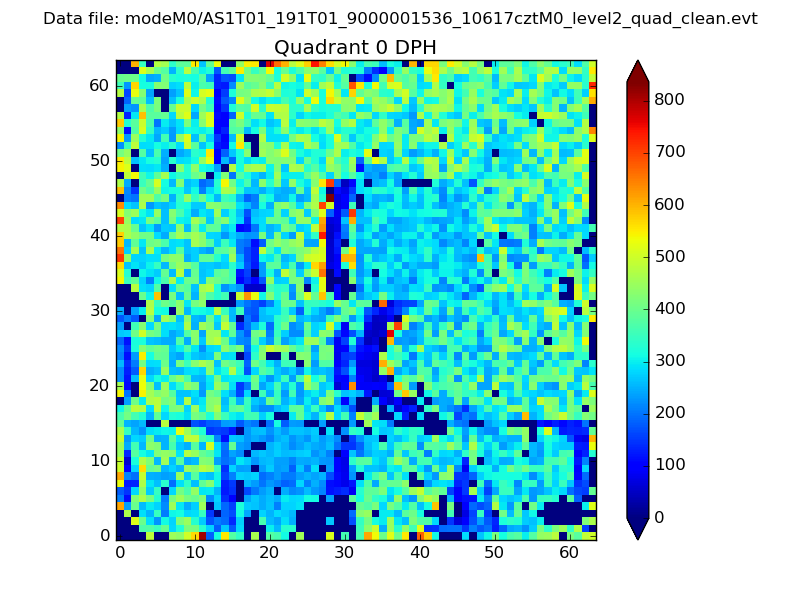 |
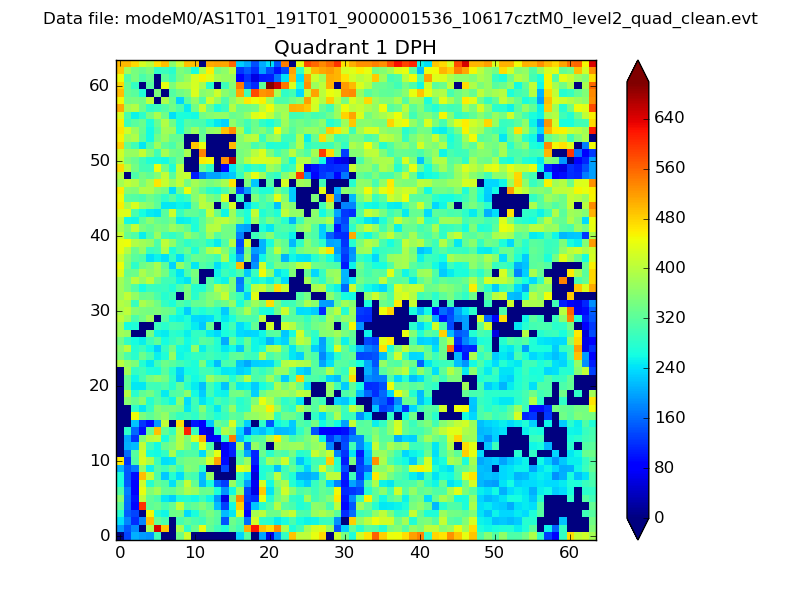 |
Quadrant B |
|---|---|---|---|
| Quadrant D | 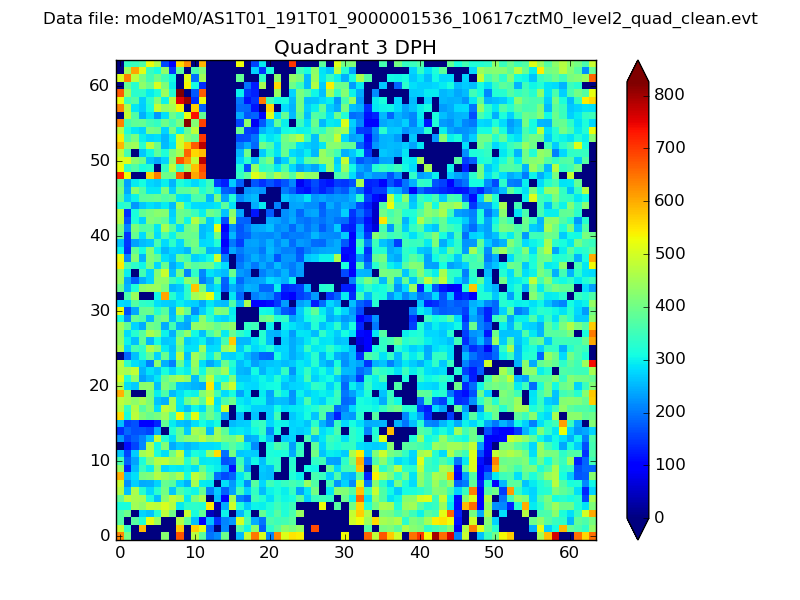 |
 |
Quadrant C |
| Plot type | Count rate plots | Images |
|---|---|---|
| Comparison with Poisson distribution Blue bars denote a histogram of data divided into 1 sec bins. Red curve is a Poisson curve with rate = median count rate of data. |
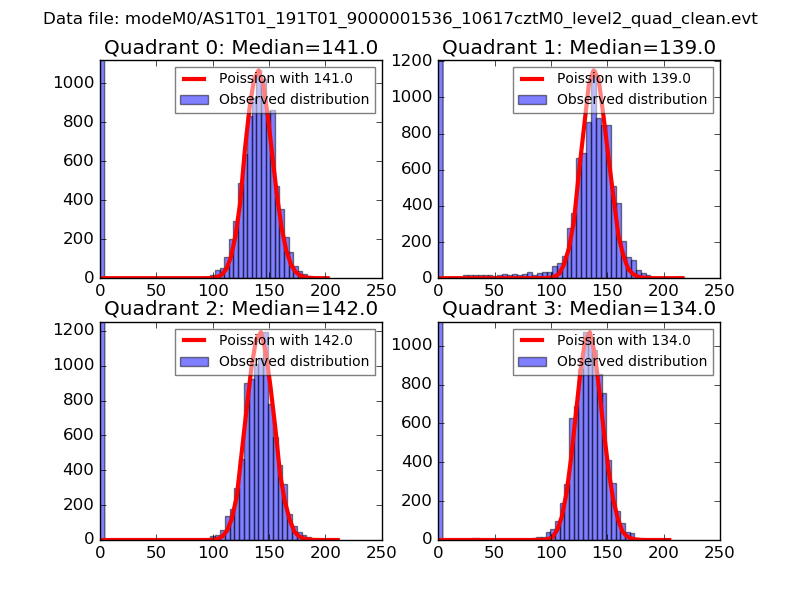 |
 |
| Quadrant-wise count rates Data is divided into 100 sec bins |
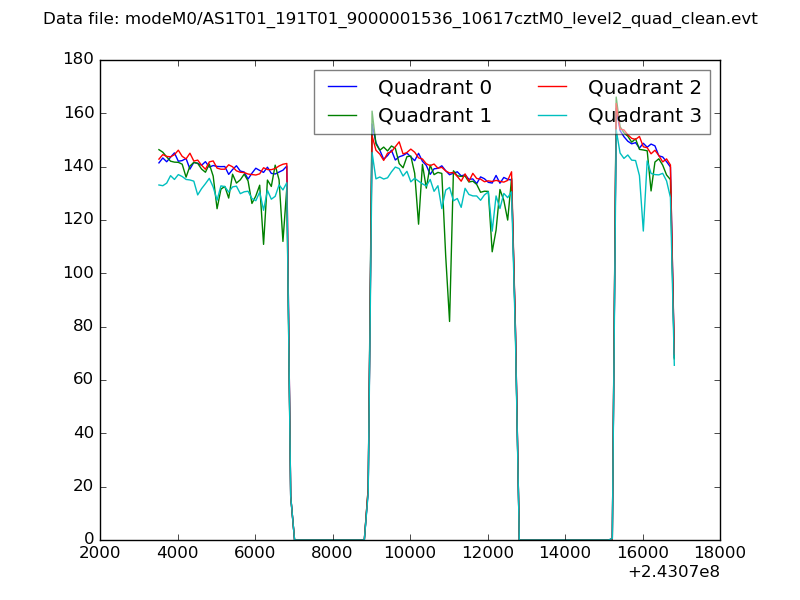 |
|
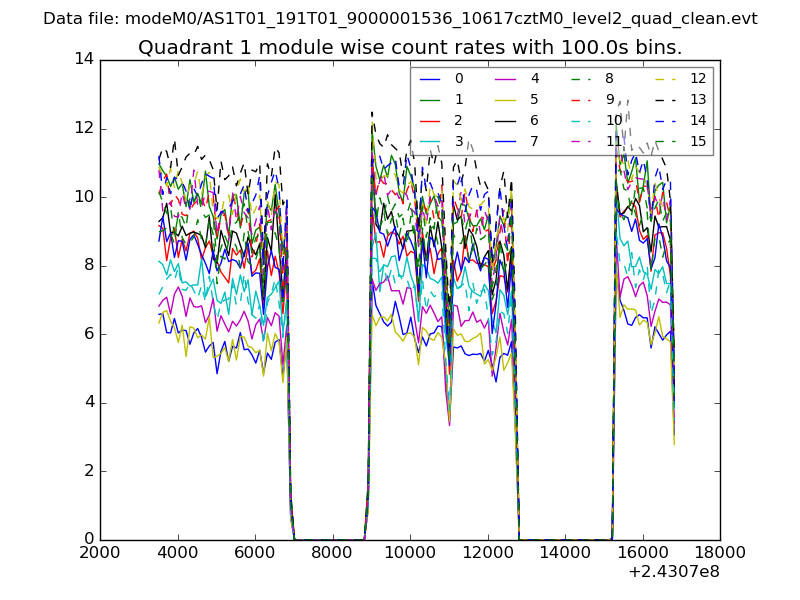
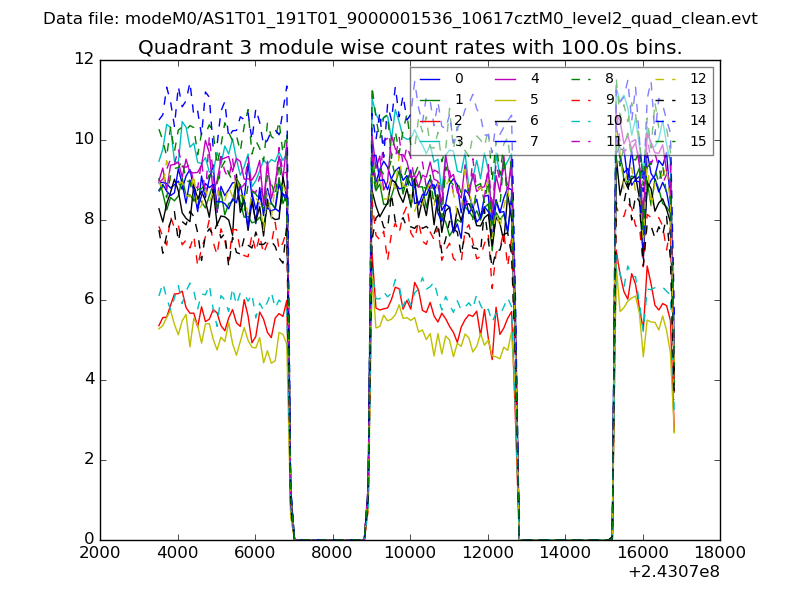
| Module-wise count rates for Quadrant A Data is divided into 100 sec bins |
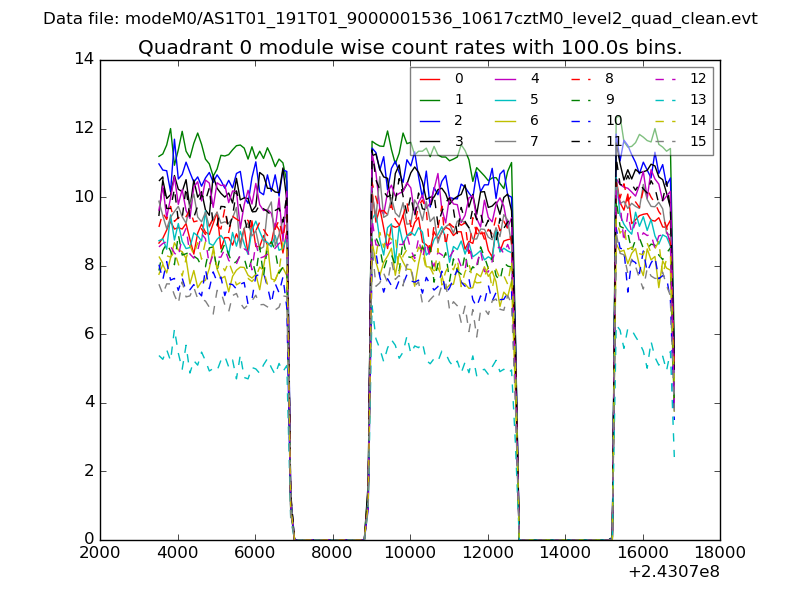 |
 |
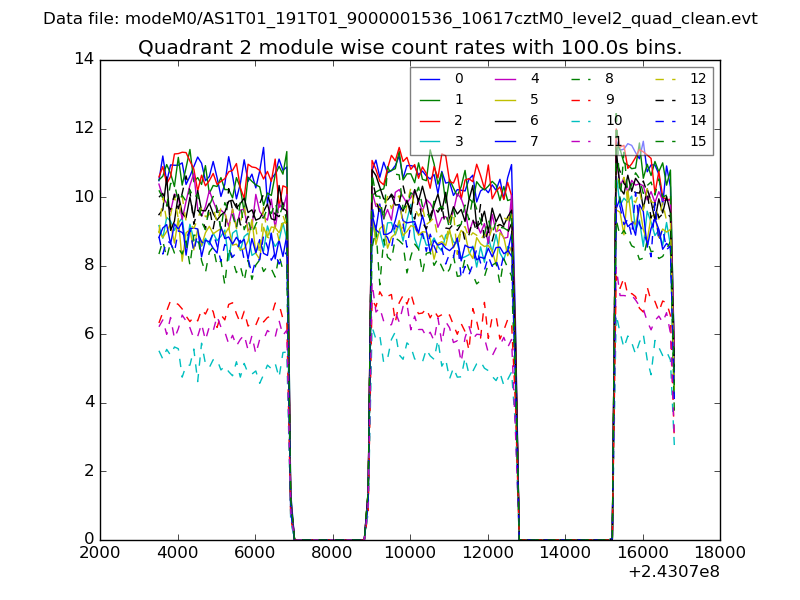
| Module-wise count rates for Quadrant B Data is divided into 100 sec bins |
 |
 |
| Module-wise count rates for Quadrant C Data is divided into 100 sec bins |
 |
 |
| Module-wise count rates for Quadrant D Data is divided into 100 sec bins |
 |
 |
| Parameter | Plot |
|---|---|
| CZT HV Monitor |  |
| D_VDD | 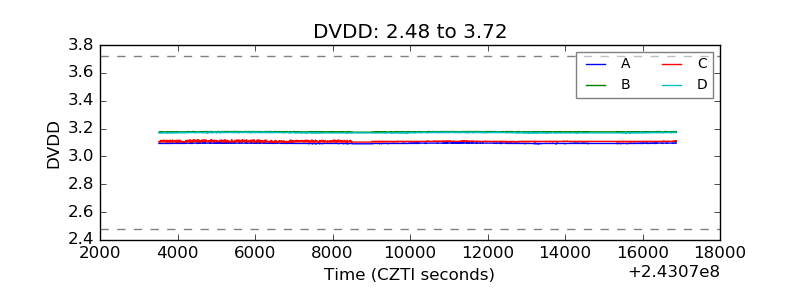 |
| Temperature 1 | 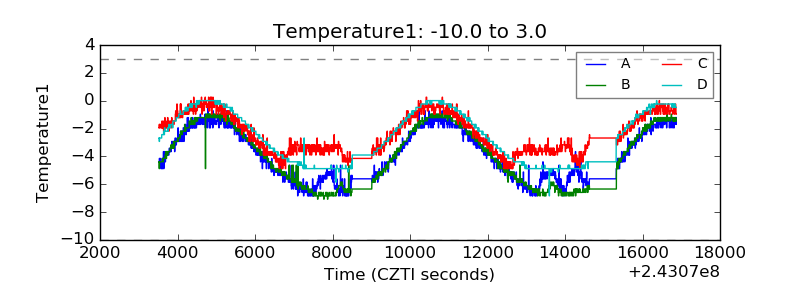 |
| Veto HV Monitor | 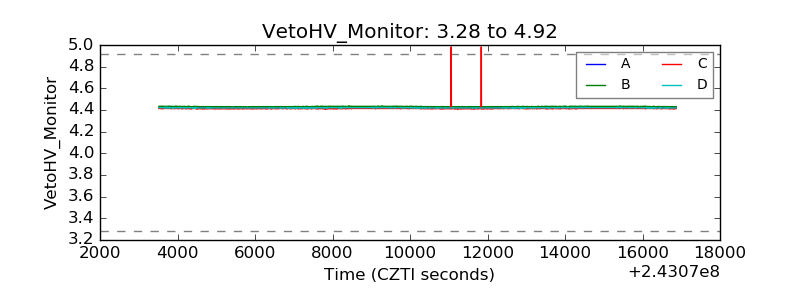 |
| Veto LLD |  |
| Alpha Counter | 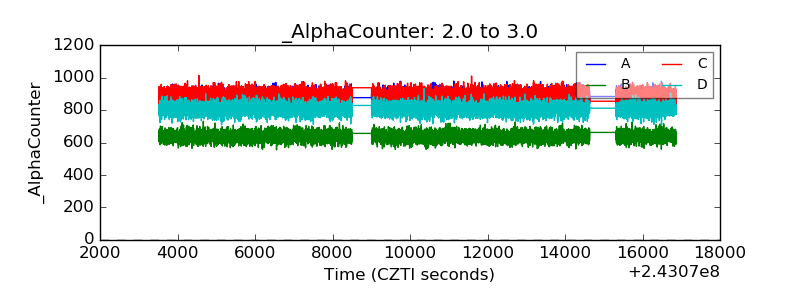 |
| _CPM_Rate | 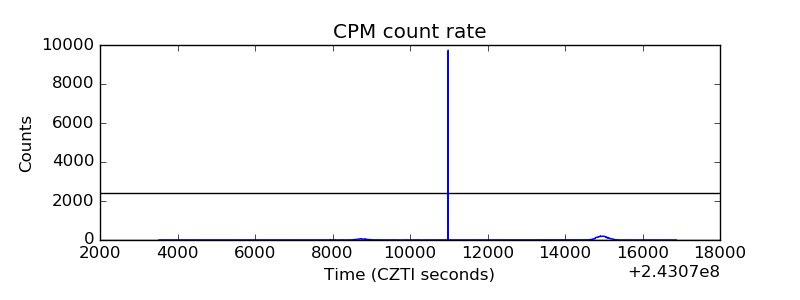 |
| CZT Counter | 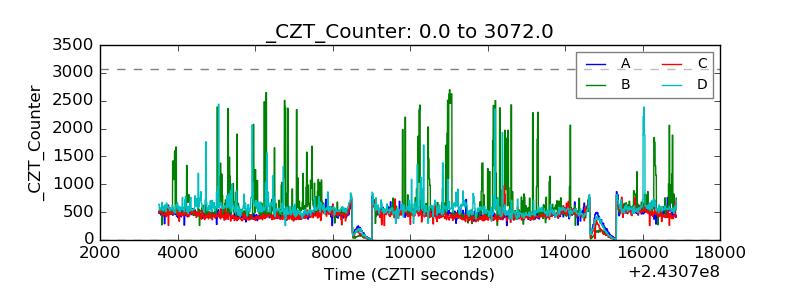 |
| +2.5 Volts monitor |  |
| +5 Volts monitor |  |
| _ROLL_ROT | 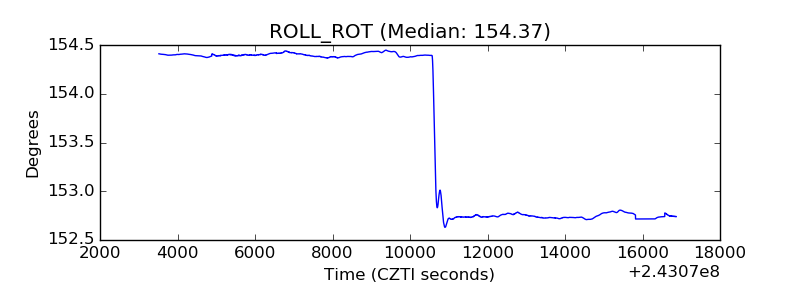 |
| _Roll_DEC | 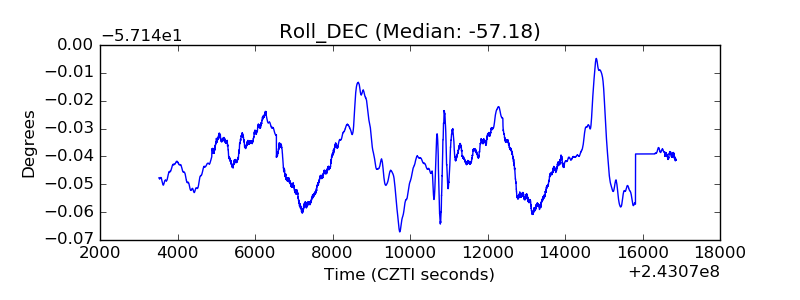 |
| _Roll_RA | 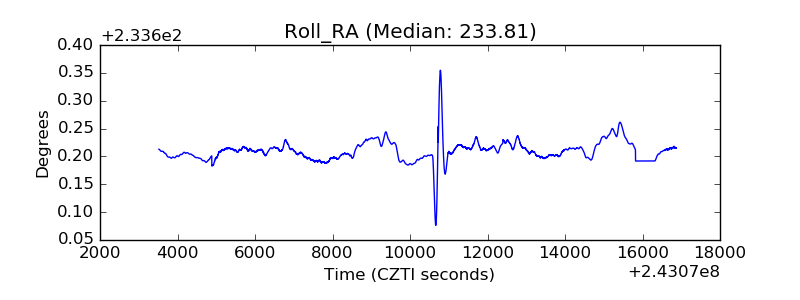 |
| Veto Counter | 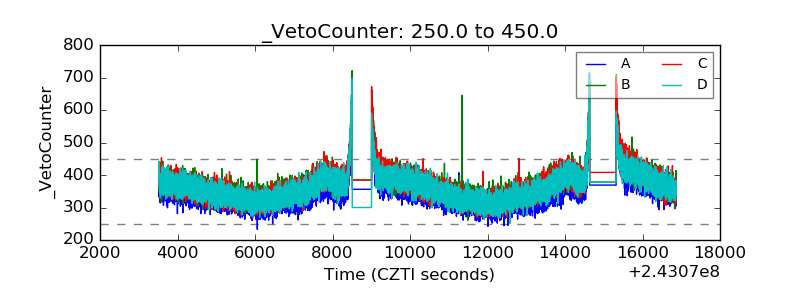 |