| Param | Original file | Final file |
|---|---|---|
| Filename | modeM0/AS1T01_191T01_9000001536_10621cztM0_level2.evt | modeM0/AS1T01_191T01_9000001536_10621cztM0_level2_quad_clean.evt |
| Size (bytes) | 444,974,400 | 90,987,840 |
| Size | 424.4 MB | 86.8 MB |
| Events in quadrant A | 2,923,456 | 603,901 |
| Events in quadrant B | 4,131,202 | 591,027 |
| Events in quadrant C | 2,676,470 | 597,032 |
| Events in quadrant D | 3,355,797 | 562,774 |
| Mode SS | |||
|---|---|---|---|
| Quadrant | BADHDUFLAG | Total packets | Discarded packets |
| A | 0 | 116 | 0 |
| B | 0 | 116 | 0 |
| C | 0 | 116 | 0 |
| D | 0 | 116 | 0 |
| Mode M9 | |||
|---|---|---|---|
| Quadrant | BADHDUFLAG | Total packets | Discarded packets |
| A | 0 | 12 | 0 |
| B | 0 | 12 | 0 |
| C | 0 | 12 | 0 |
| D | 0 | 12 | 0 |
| Mode M0 | |||
|---|---|---|---|
| Quadrant | BADHDUFLAG | Total packets | Discarded packets |
| A | 0 | 12364 | 2 |
| B | 0 | 15996 | 1 |
| C | 0 | 11917 | 1 |
| D | 0 | 13720 | 1 |
| Quadrant | Total seconds | Saturated seconds | Saturation percentage |
|---|---|---|---|
| A | 5733 | 44 | 0.767486% |
| B | 5733 | 282 | 4.918891% |
| C | 5733 | 26 | 0.453515% |
| D | 5733 | 47 | 0.819815% |
Noise dominated data is calculated using 1-second bins in cleaned event files. If a bin has >2000 counts, and if more than 50% of those come from <1% of pixels, then it is considered to be noise-dominated and hence unusable.
| Quadrant | # 1 sec bins | Bins with >0 counts | Bins with >2000 counts | High rate bins dominated by noise | Noise dominated (total time) | Noise dominated (detector-on time) | Marked lightcurve |
|---|---|---|---|---|---|---|---|
| A | 6913 | 5734 | 2 | 2 | 0.03% | 0.03% | 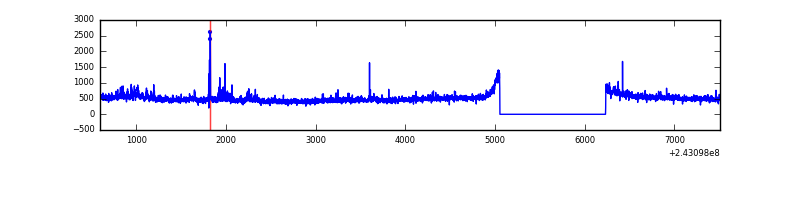 |
| B | 6913 | 5734 | 154 | 154 | 2.23% | 2.69% | 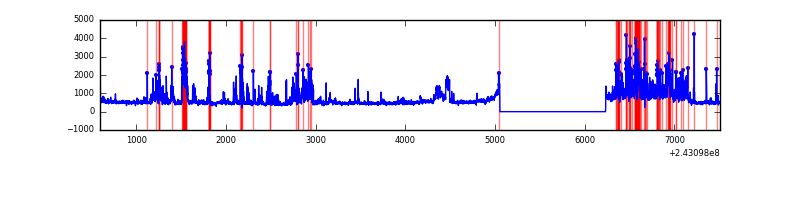 |
| C | 6913 | 5734 | 1 | 1 | 0.01% | 0.02% | 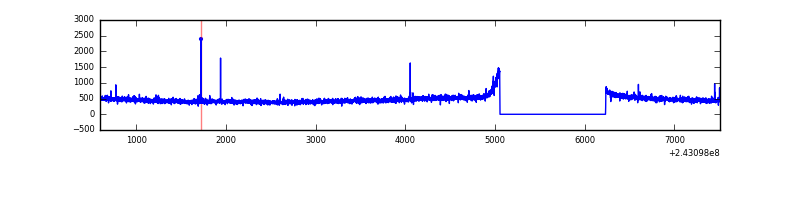 |
| D | 6913 | 5734 | 19 | 19 | 0.27% | 0.33% | 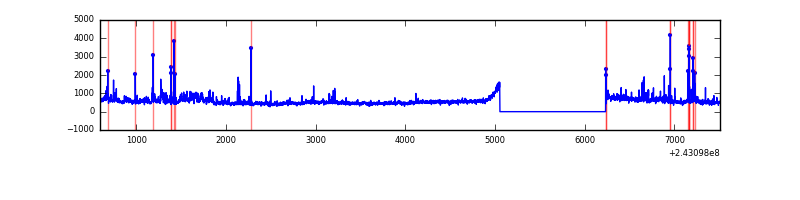 |
Top three noisy pixels from each quadrant. If the there are fewer than three noisy pixels in the level2.evt file, extra rows are filled as -1
| Pixel properties | Quadrant properties | ||||||
|---|---|---|---|---|---|---|---|
| Quadrant | DetID | PixID | Counts | Sigma | Mean | Median | Sigma |
| A | 13 | 251 | 95071 | 653.58 | 706 | 693 | 144.4 |
| A | 15 | 239 | 38609 | 262.57 | 706 | 693 | 144.4 |
| A | 1 | 162 | 33813 | 229.36 | 706 | 693 | 144.4 |
| B | 4 | 239 | 1159350 | 8717.31 | 693 | 681 | 132.9 |
| B | 10 | 246 | 118405 | 885.7 | 693 | 681 | 132.9 |
| B | 0 | 219 | 71840 | 535.37 | 693 | 681 | 132.9 |
| C | 4 | 254 | 16272 | 98.96 | 676 | 684 | 157.5 |
| C | 14 | 234 | 10788 | 64.14 | 676 | 684 | 157.5 |
| C | 13 | 61 | 5108 | 28.09 | 676 | 684 | 157.5 |
| D | 2 | 16 | 384373 | 2319.8 | 674 | 659 | 165.4 |
| D | 8 | 195 | 173465 | 1044.72 | 674 | 659 | 165.4 |
| D | 13 | 104 | 92724 | 556.59 | 674 | 659 | 165.4 |
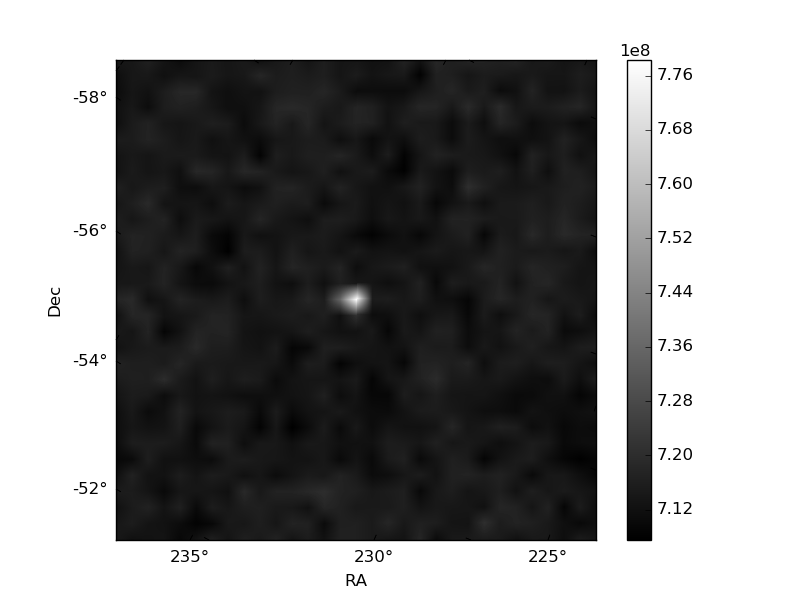
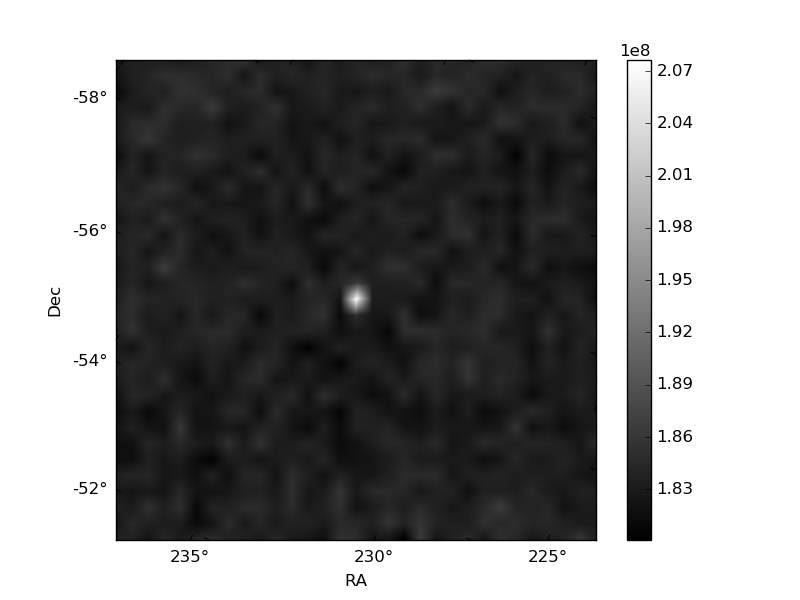
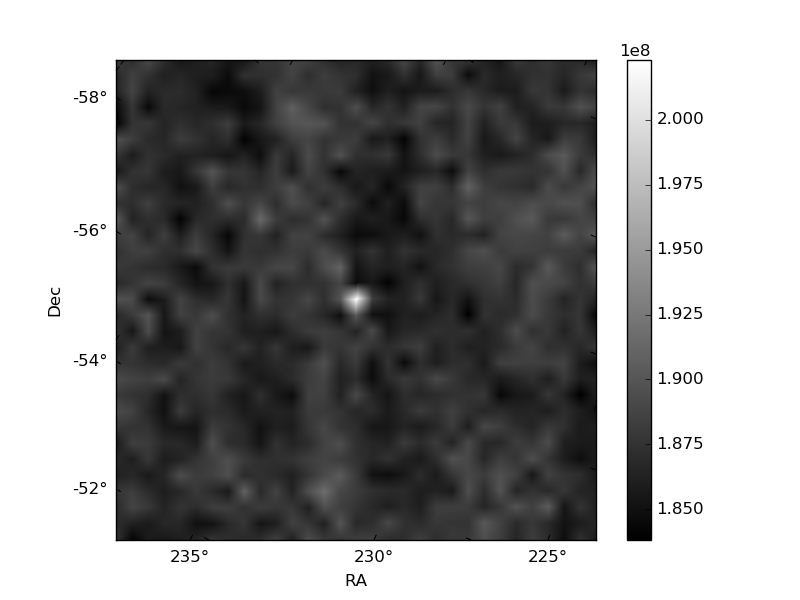
Histogram calculated using DETX and DETY for each event in the final _common_clean file
| Quadrant A | 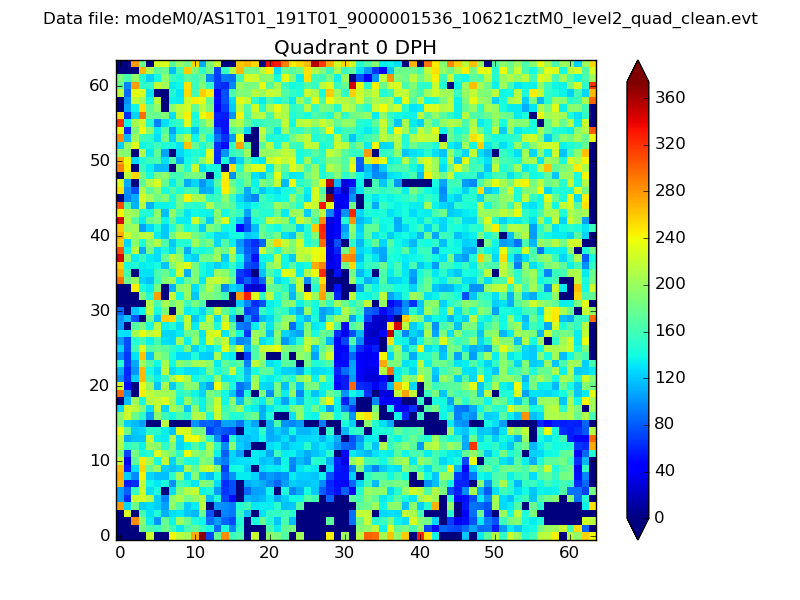 |
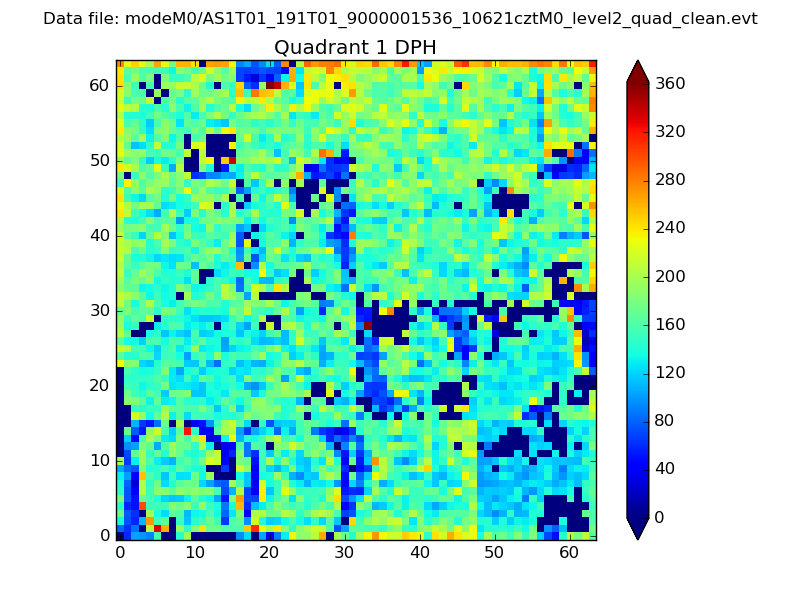 |
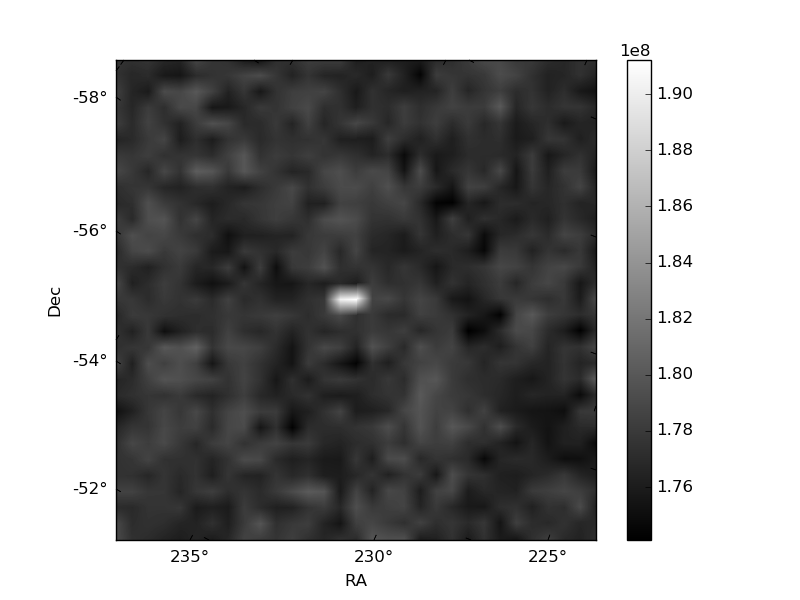
Quadrant B |
|---|---|---|---|
| Quadrant D | 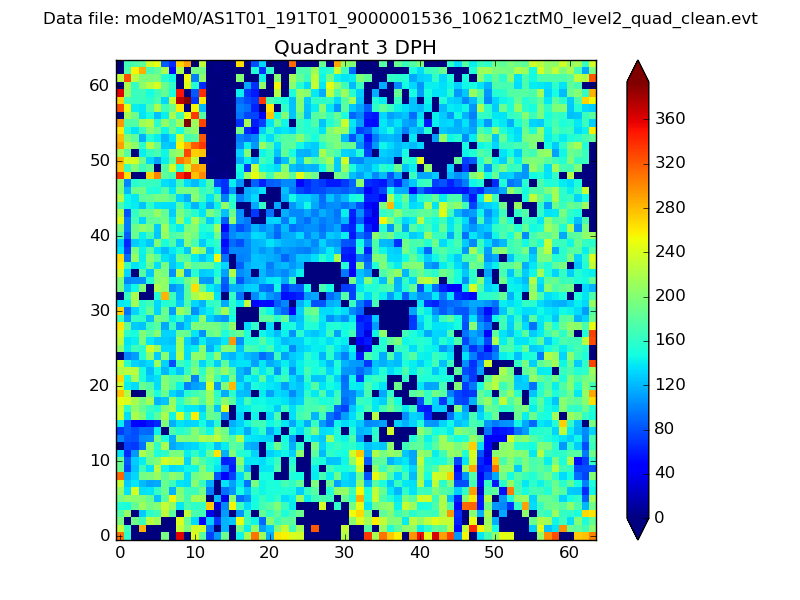 |
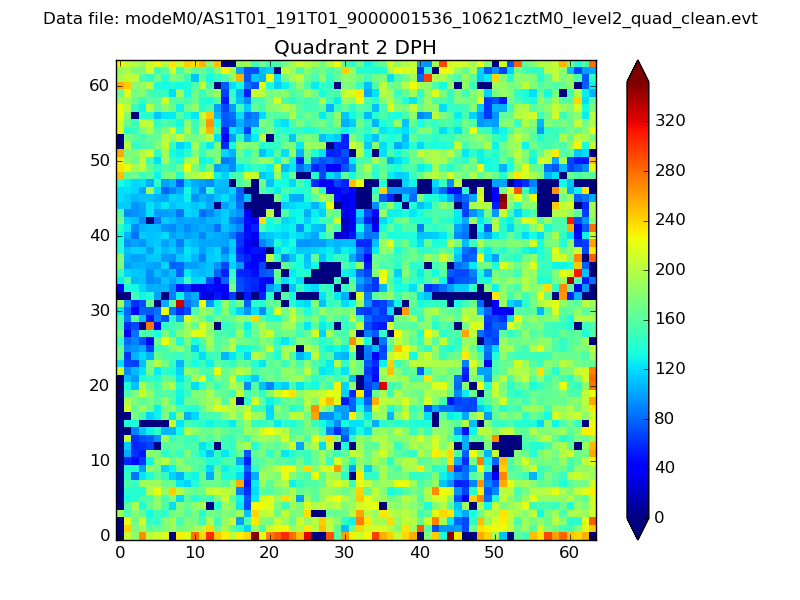 |
Quadrant C |
| Plot type | Count rate plots | Images |
|---|---|---|
| Comparison with Poisson distribution Blue bars denote a histogram of data divided into 1 sec bins. Red curve is a Poisson curve with rate = median count rate of data. |
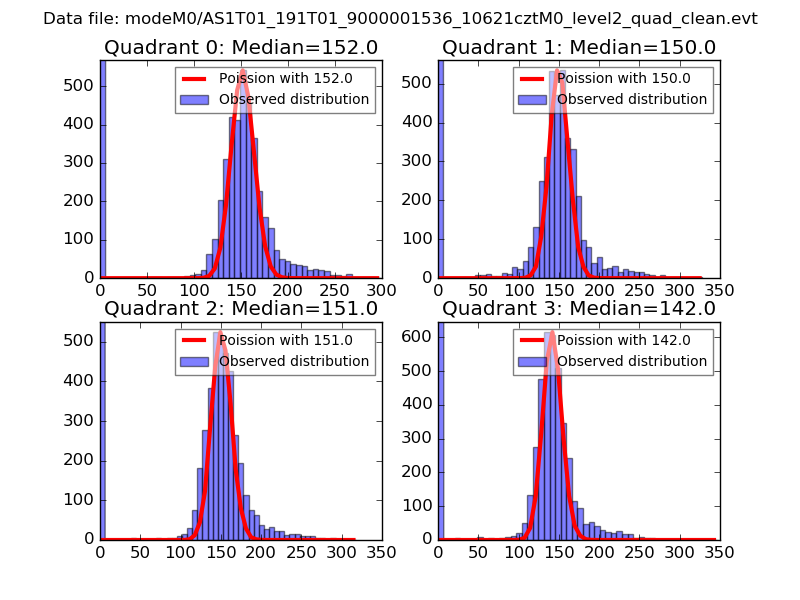 |
 |
| Quadrant-wise count rates Data is divided into 100 sec bins |
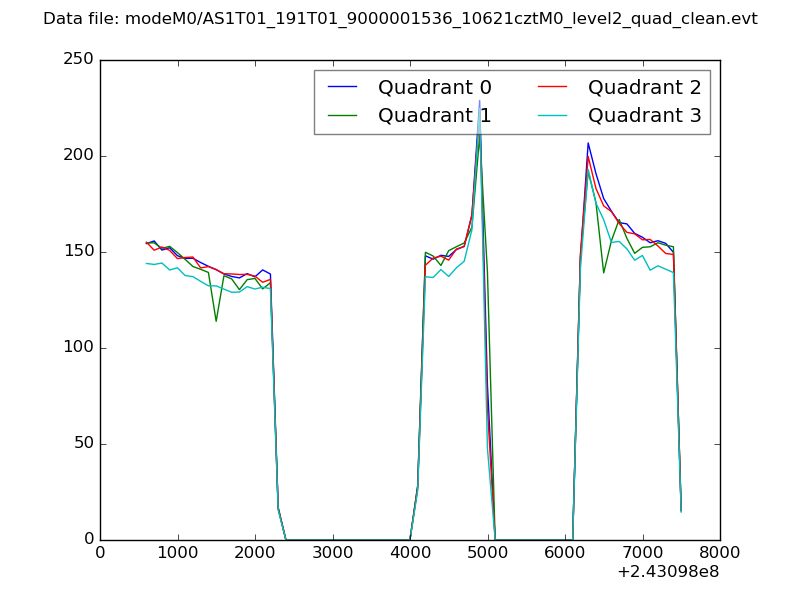 |
|
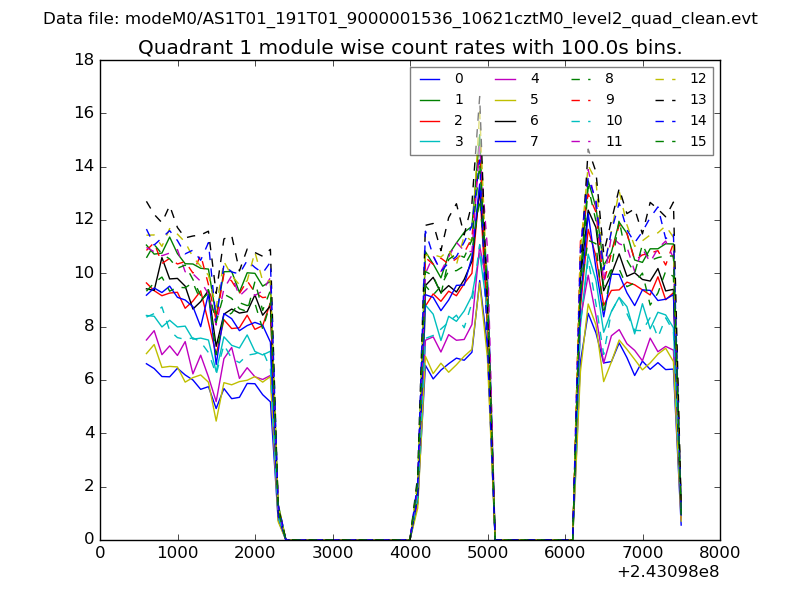
| Module-wise count rates for Quadrant A Data is divided into 100 sec bins |
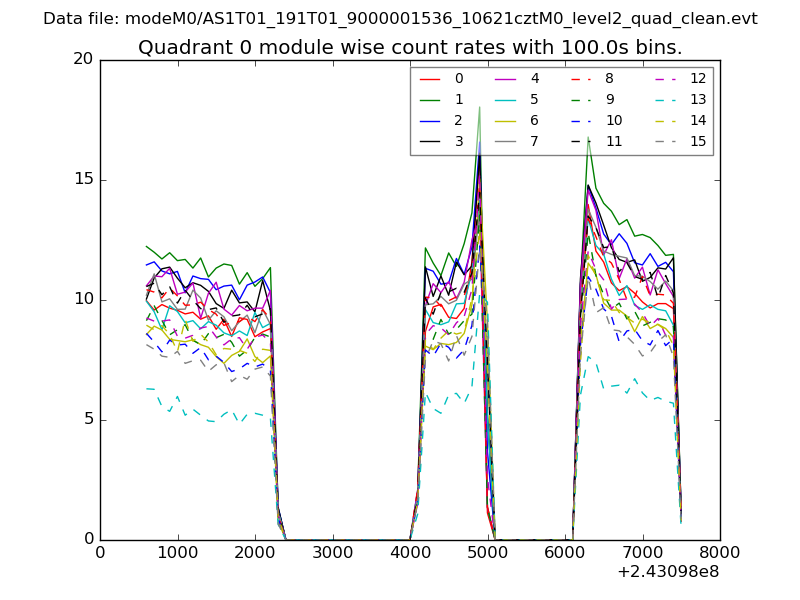 |
 |
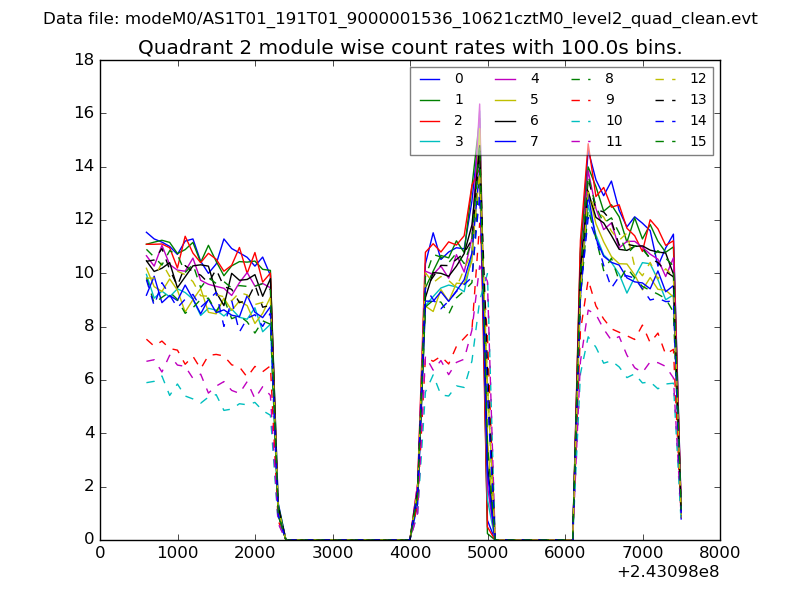
| Module-wise count rates for Quadrant B Data is divided into 100 sec bins |
 |
 |
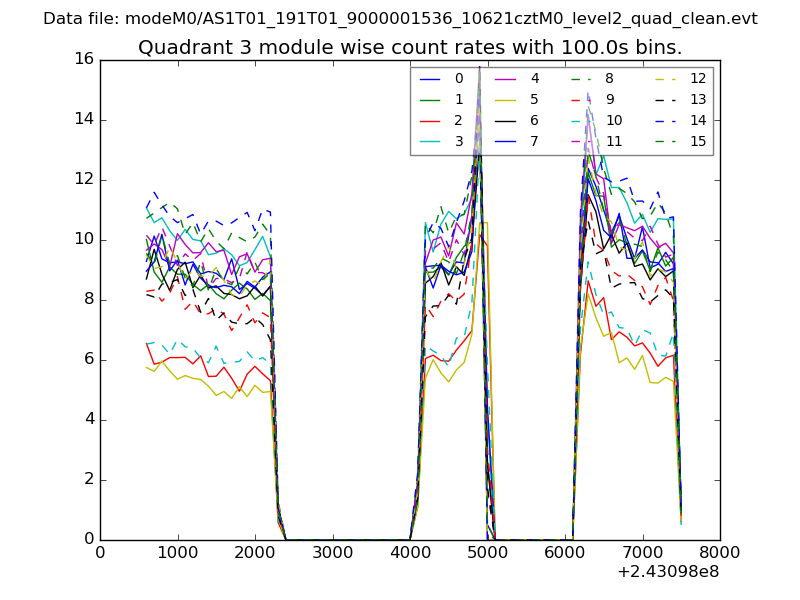
| Module-wise count rates for Quadrant C Data is divided into 100 sec bins |
 |
 |
| Module-wise count rates for Quadrant D Data is divided into 100 sec bins |
 |
 |
| Parameter | Plot |
|---|---|
| CZT HV Monitor | 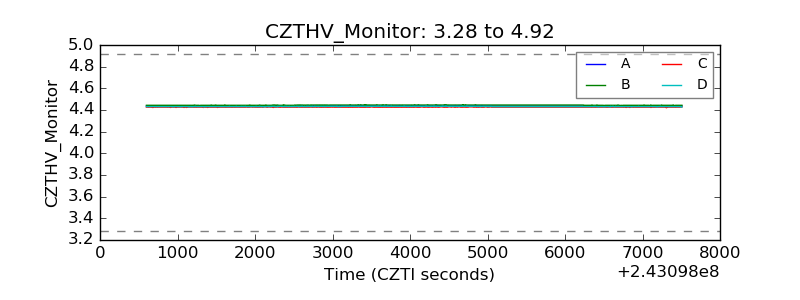 |
| D_VDD | 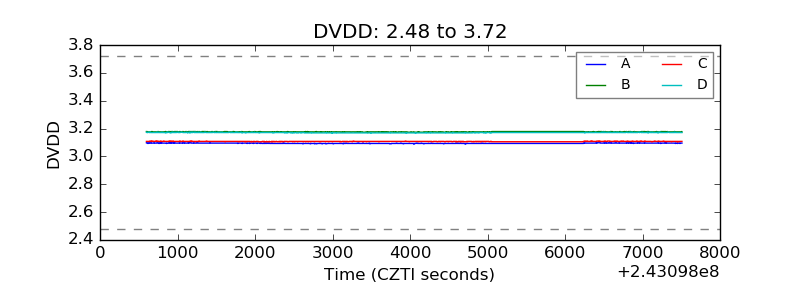 |
| Temperature 1 | 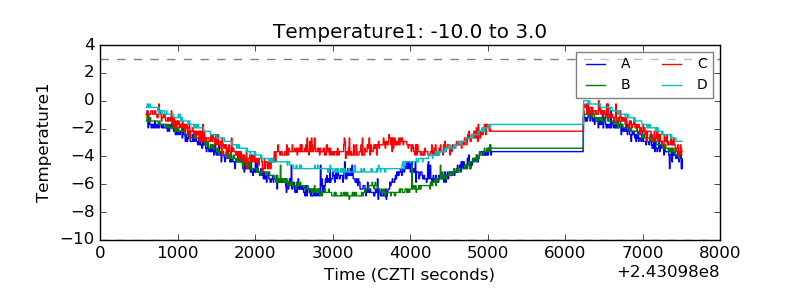 |
| Veto HV Monitor | 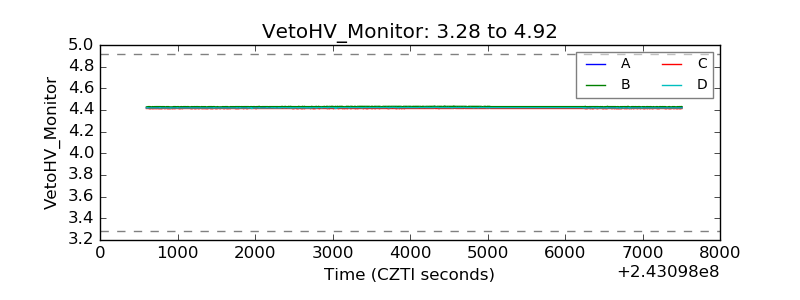 |
| Veto LLD | 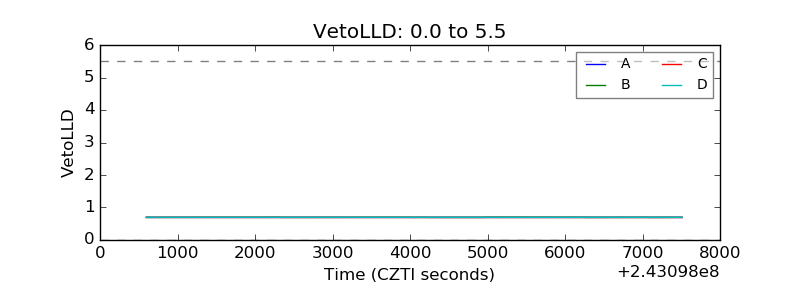 |
| Alpha Counter | 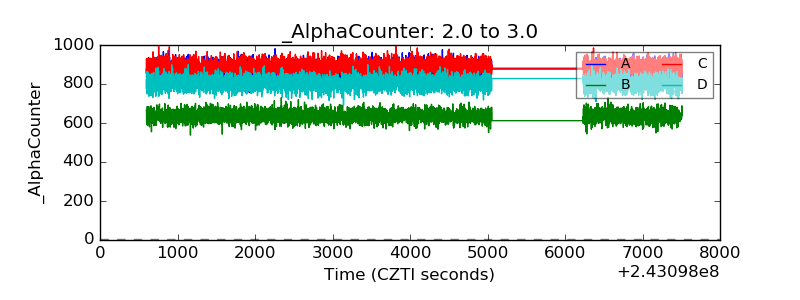 |
| _CPM_Rate | 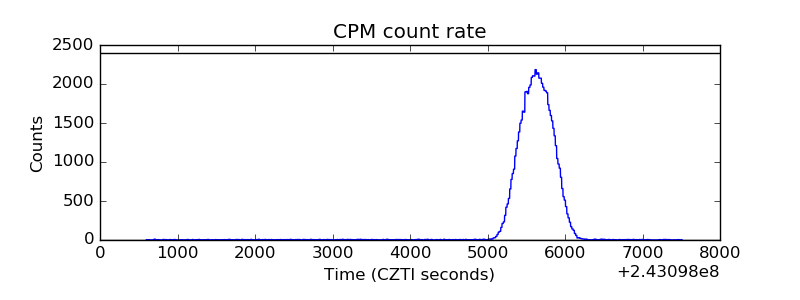 |
| CZT Counter | 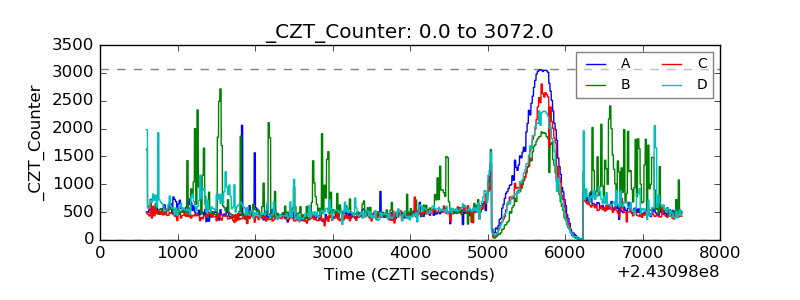 |
| +2.5 Volts monitor |  |
| +5 Volts monitor |  |
| _ROLL_ROT | 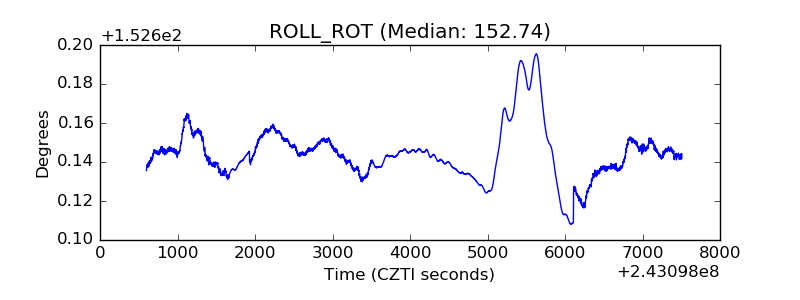 |
| _Roll_DEC |  |
| _Roll_RA | 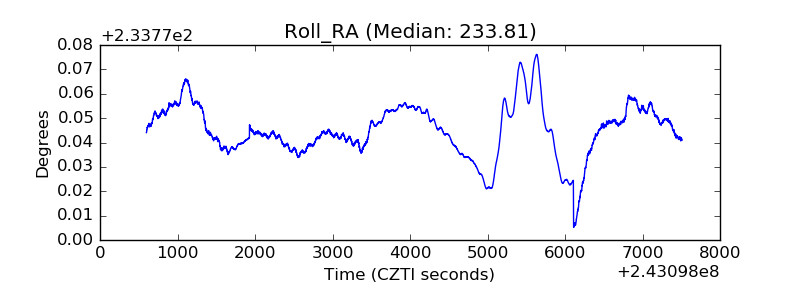 |
| Veto Counter | 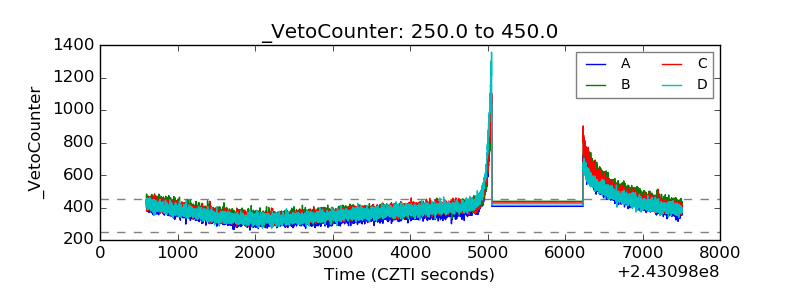 |