| Param | Original file | Final file |
|---|---|---|
| Filename | modeM0/AS1T01_191T01_9000001536_10622cztM0_level2.evt | modeM0/AS1T01_191T01_9000001536_10622cztM0_level2_quad_clean.evt |
| Size (bytes) | 434,940,480 | 90,198,720 |
| Size | 414.8 MB | 86.0 MB |
| Events in quadrant A | 2,866,188 | 601,105 |
| Events in quadrant B | 4,068,085 | 586,400 |
| Events in quadrant C | 2,680,306 | 592,799 |
| Events in quadrant D | 3,178,871 | 561,189 |
| Mode SS | |||
|---|---|---|---|
| Quadrant | BADHDUFLAG | Total packets | Discarded packets |
| A | 0 | 114 | 0 |
| B | 0 | 114 | 0 |
| C | 0 | 114 | 0 |
| D | 0 | 114 | 0 |
| Mode M9 | |||
|---|---|---|---|
| Quadrant | BADHDUFLAG | Total packets | Discarded packets |
| A | 0 | 12 | 0 |
| B | 0 | 12 | 0 |
| C | 0 | 12 | 0 |
| D | 0 | 12 | 0 |
| Mode M0 | |||
|---|---|---|---|
| Quadrant | BADHDUFLAG | Total packets | Discarded packets |
| A | 0 | 12251 | 2 |
| B | 0 | 15776 | 1 |
| C | 0 | 11744 | 1 |
| D | 0 | 12915 | 1 |
| Quadrant | Total seconds | Saturated seconds | Saturation percentage |
|---|---|---|---|
| A | 5573 | 37 | 0.663915% |
| B | 5573 | 340 | 6.100843% |
| C | 5573 | 13 | 0.233268% |
| D | 5573 | 27 | 0.484479% |
Noise dominated data is calculated using 1-second bins in cleaned event files. If a bin has >2000 counts, and if more than 50% of those come from <1% of pixels, then it is considered to be noise-dominated and hence unusable.
| Quadrant | # 1 sec bins | Bins with >0 counts | Bins with >2000 counts | High rate bins dominated by noise | Noise dominated (total time) | Noise dominated (detector-on time) | Marked lightcurve |
|---|---|---|---|---|---|---|---|
| A | 6818 | 5574 | 0 | 0 | 0.00% | 0.00% | 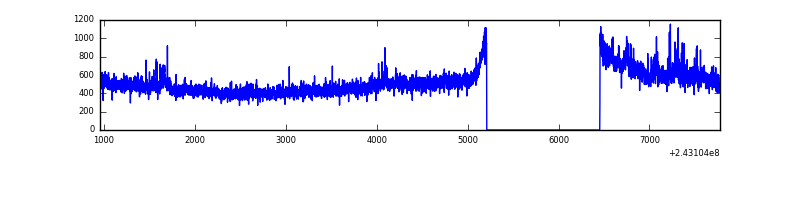 |
| B | 6818 | 5574 | 206 | 206 | 3.02% | 3.70% | 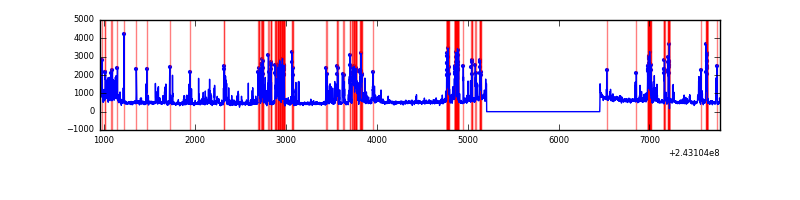 |
| C | 6818 | 5574 | 1 | 1 | 0.01% | 0.02% | 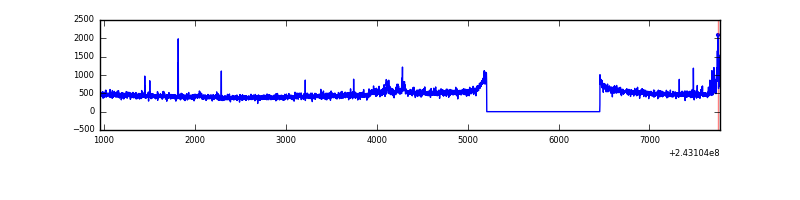 |
| D | 6818 | 5574 | 17 | 17 | 0.25% | 0.30% | 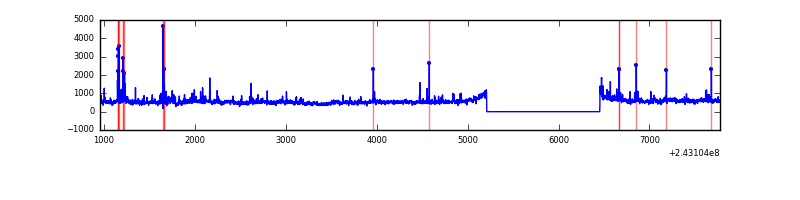 |
Top three noisy pixels from each quadrant. If the there are fewer than three noisy pixels in the level2.evt file, extra rows are filled as -1
| Pixel properties | Quadrant properties | ||||||
|---|---|---|---|---|---|---|---|
| Quadrant | DetID | PixID | Counts | Sigma | Mean | Median | Sigma |
| A | 13 | 251 | 149198 | 1038.39 | 692 | 682 | 143.0 |
| A | 1 | 162 | 27255 | 185.79 | 692 | 682 | 143.0 |
| A | 1 | 178 | 9526 | 61.83 | 692 | 682 | 143.0 |
| B | 4 | 239 | 1308872 | 10110.61 | 679 | 667 | 129.4 |
| B | 0 | 219 | 39901 | 303.22 | 679 | 667 | 129.4 |
| B | 0 | 214 | 23503 | 176.49 | 679 | 667 | 129.4 |
| C | 4 | 254 | 94964 | 614.72 | 660 | 668 | 153.4 |
| C | 14 | 234 | 5399 | 30.84 | 660 | 668 | 153.4 |
| C | 13 | 61 | 4997 | 28.22 | 660 | 668 | 153.4 |
| D | 2 | 16 | 286687 | 1770.58 | 654 | 639 | 161.6 |
| D | 8 | 195 | 220093 | 1358.38 | 654 | 639 | 161.6 |
| D | 13 | 104 | 64502 | 395.3 | 654 | 639 | 161.6 |
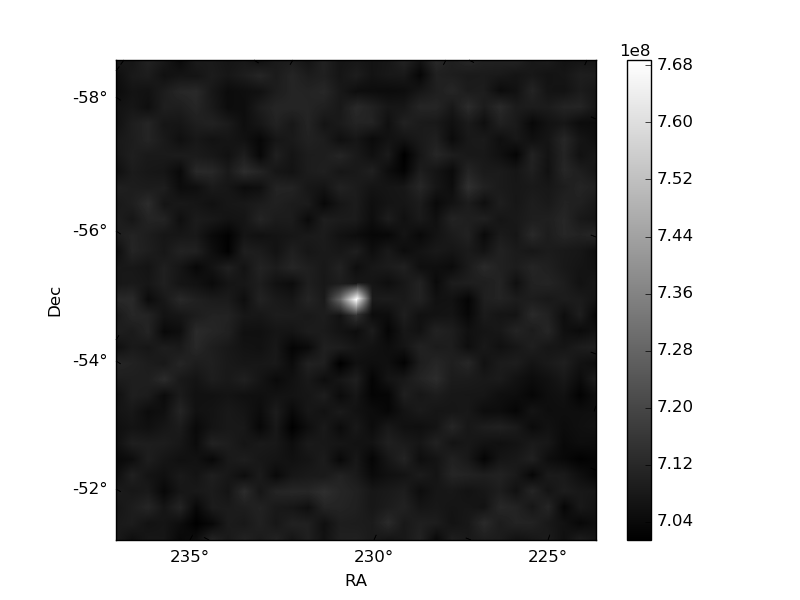
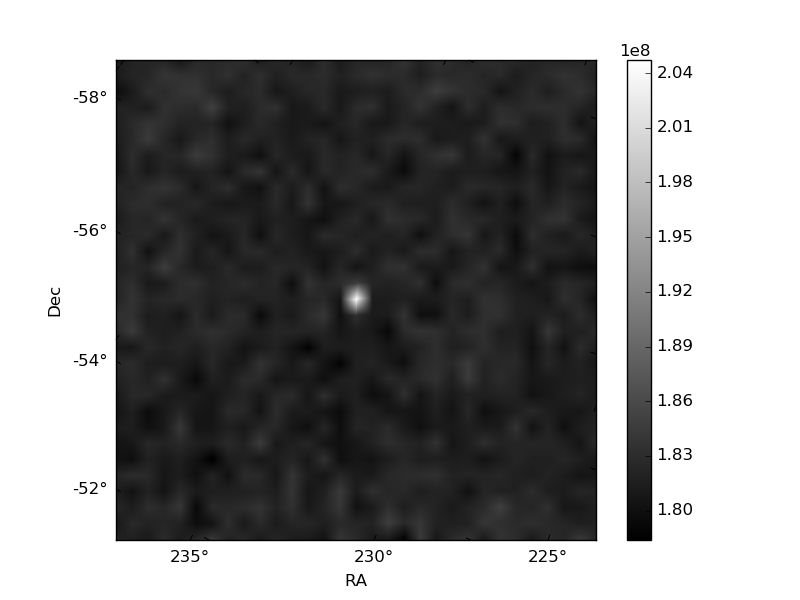
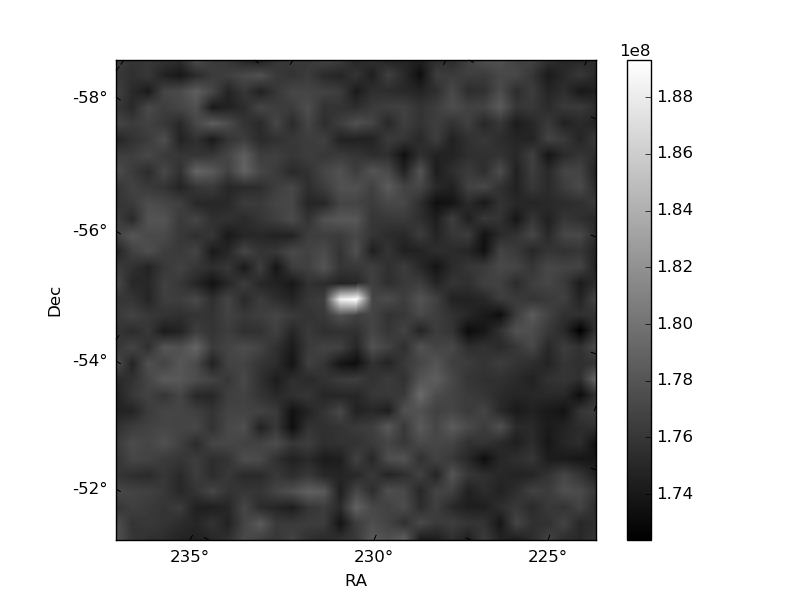
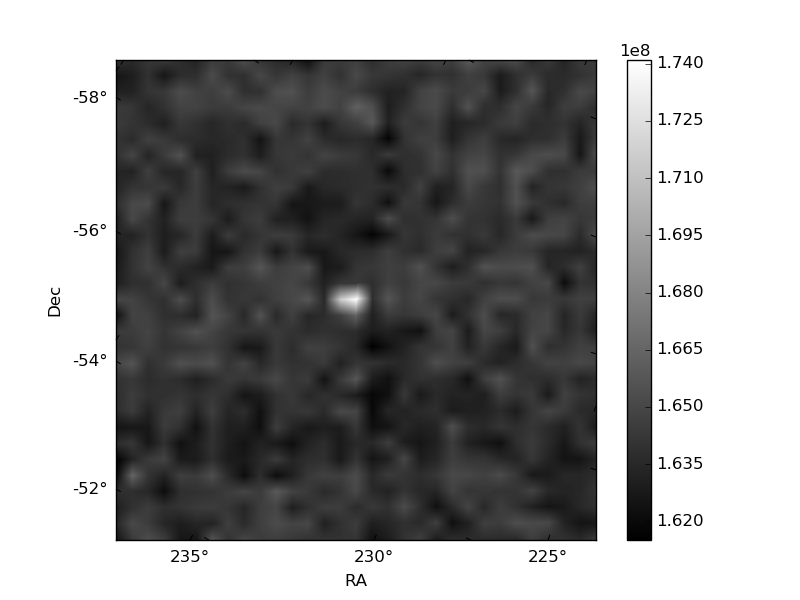
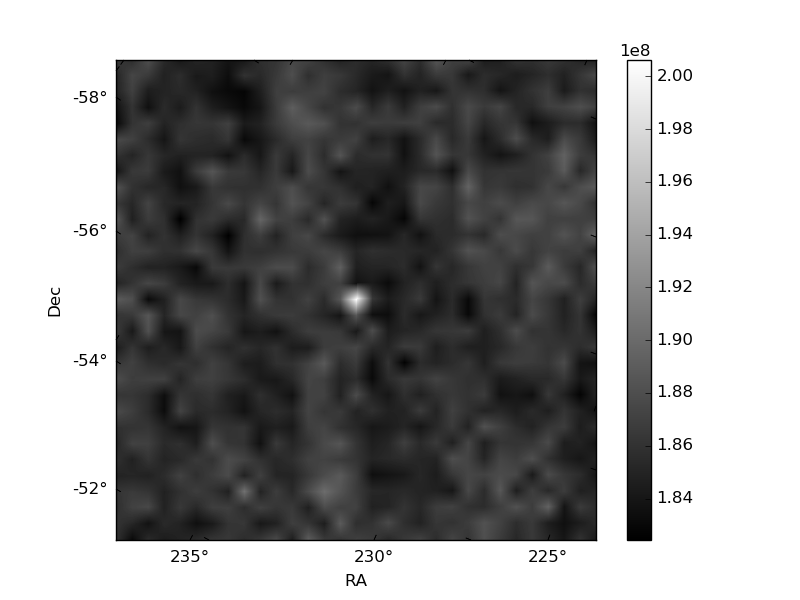
Histogram calculated using DETX and DETY for each event in the final _common_clean file
| Quadrant A | 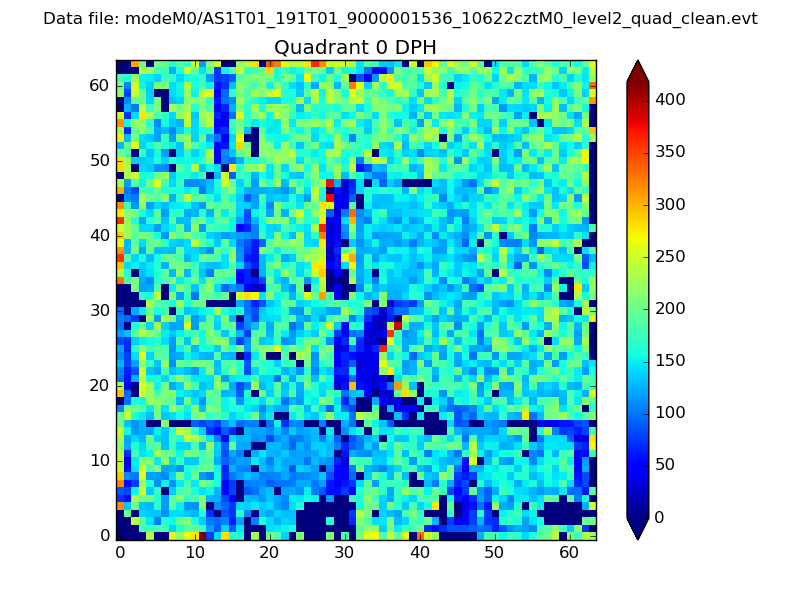 |
 |
Quadrant B |
|---|---|---|---|
| Quadrant D | 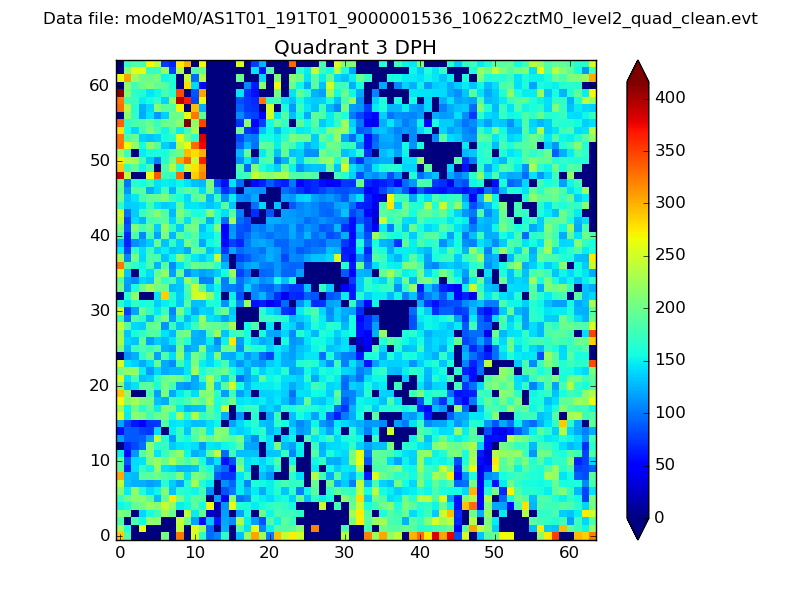 |
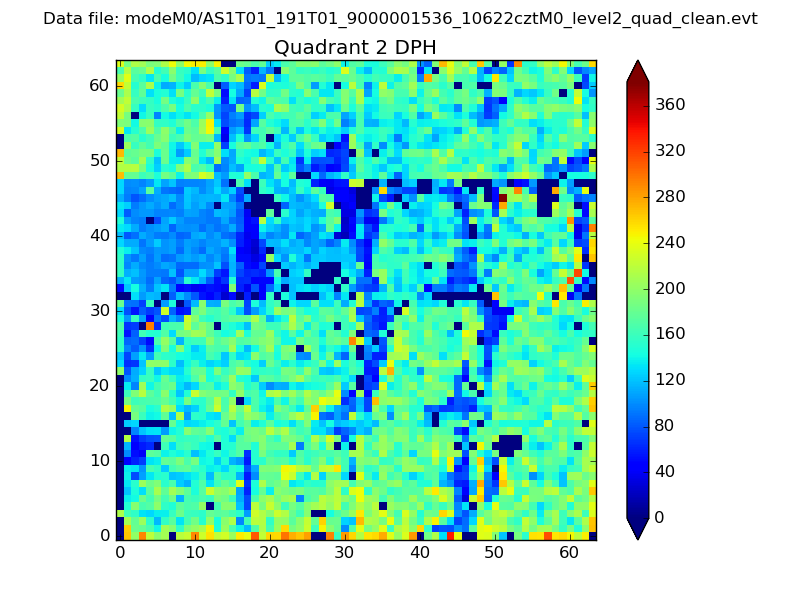 |
Quadrant C |
| Plot type | Count rate plots | Images |
|---|---|---|
| Comparison with Poisson distribution Blue bars denote a histogram of data divided into 1 sec bins. Red curve is a Poisson curve with rate = median count rate of data. |
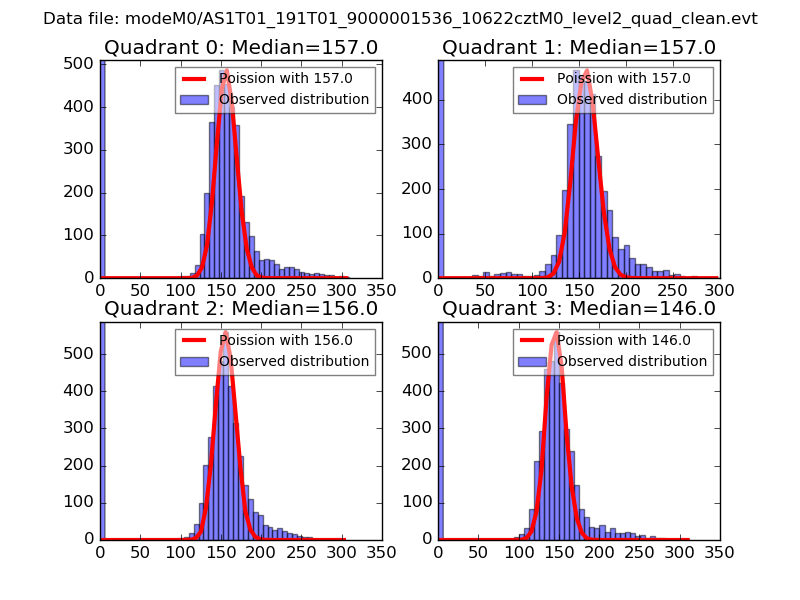 |
 |
| Quadrant-wise count rates Data is divided into 100 sec bins |
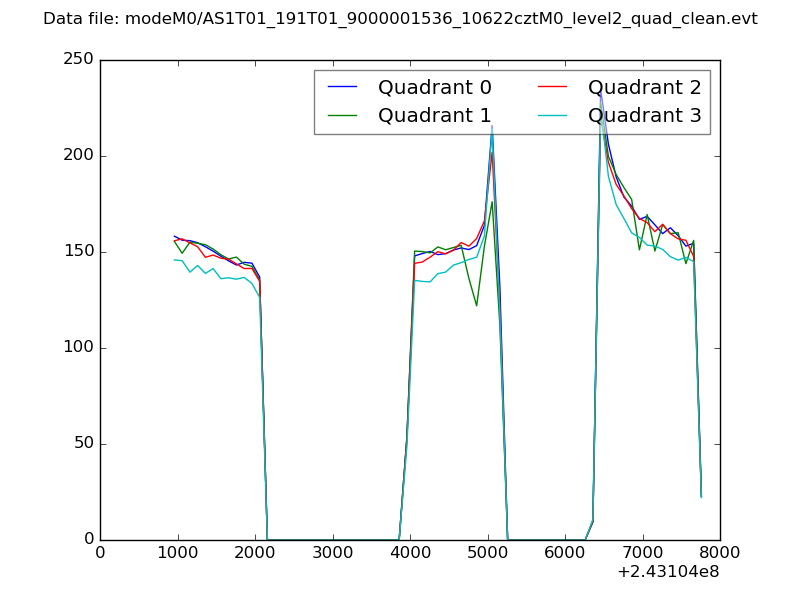 |
|
| Module-wise count rates for Quadrant A Data is divided into 100 sec bins |
 |
 |
| Module-wise count rates for Quadrant B Data is divided into 100 sec bins |
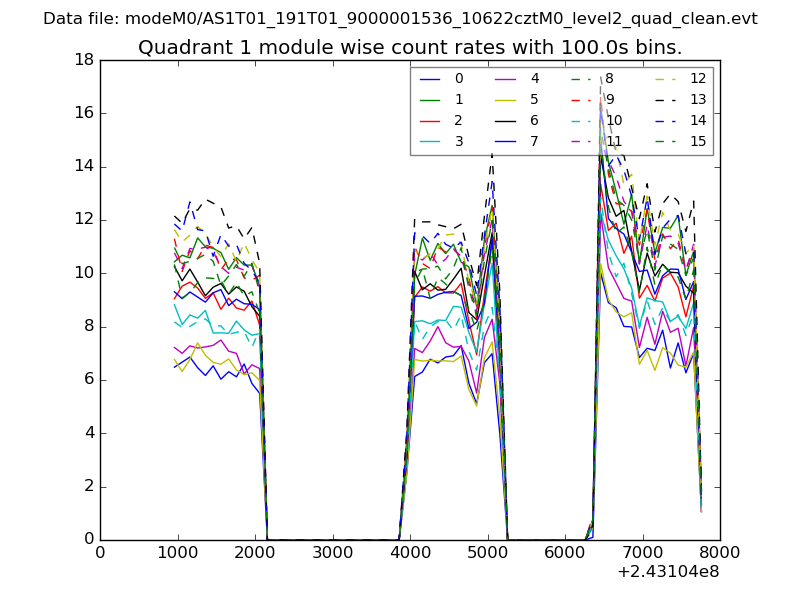 |
 |
| Module-wise count rates for Quadrant C Data is divided into 100 sec bins |
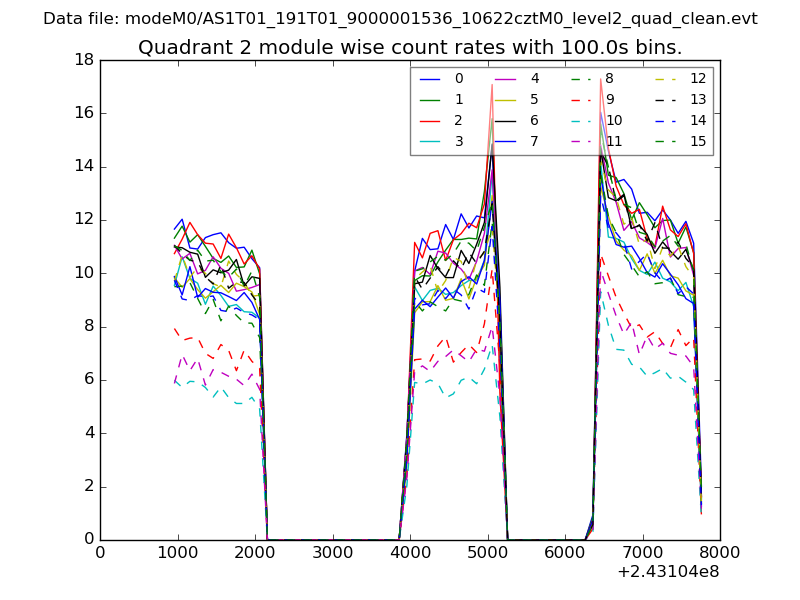 |
 |
| Module-wise count rates for Quadrant D Data is divided into 100 sec bins |
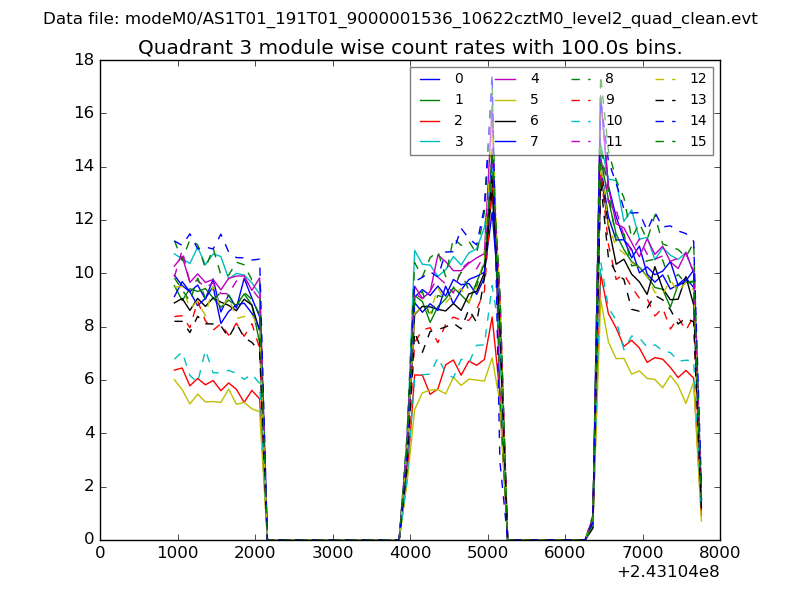 |
 |
| Parameter | Plot |
|---|---|
| CZT HV Monitor |  |
| D_VDD | 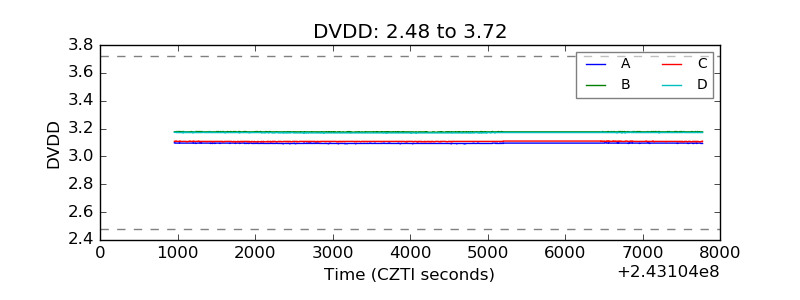 |
| Temperature 1 | 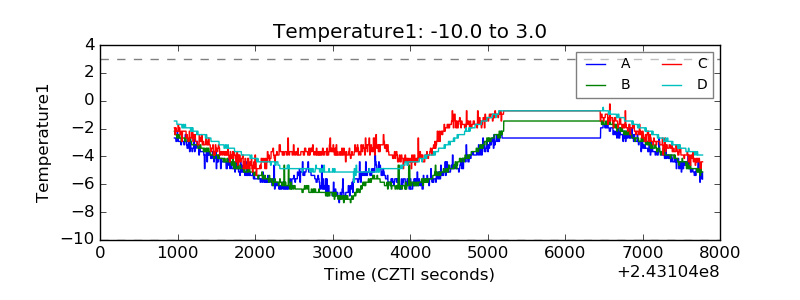 |
| Veto HV Monitor | 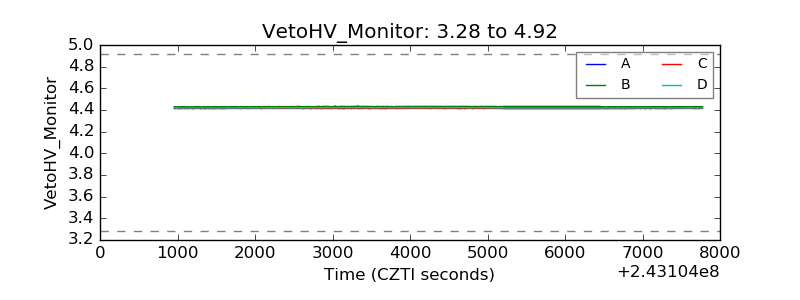 |
| Veto LLD | 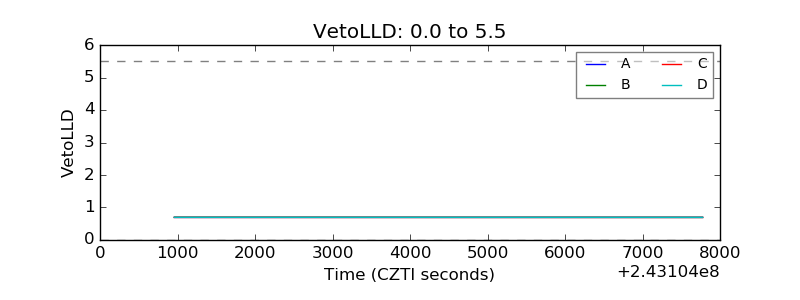 |
| Alpha Counter |  |
| _CPM_Rate | 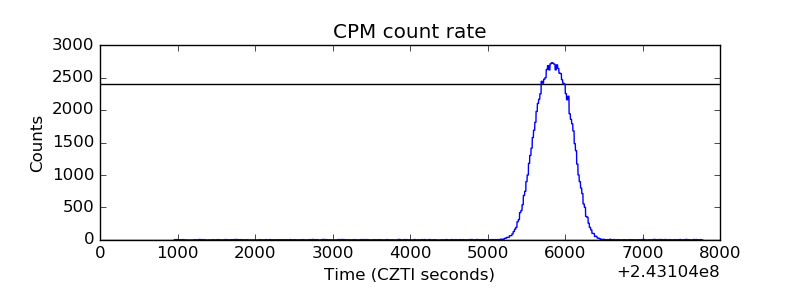 |
| CZT Counter | 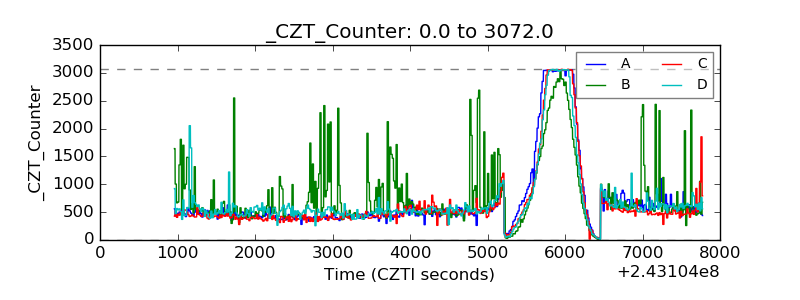 |
| +2.5 Volts monitor |  |
| +5 Volts monitor | 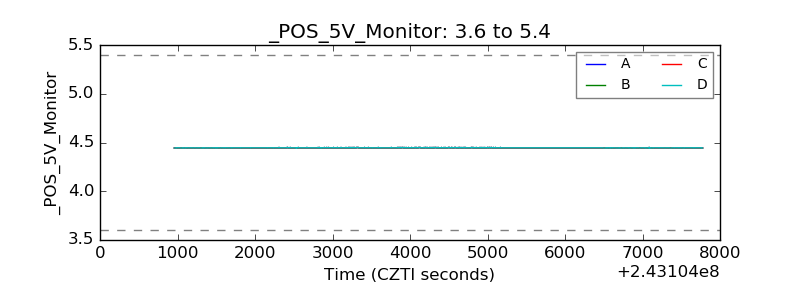 |
| _ROLL_ROT | 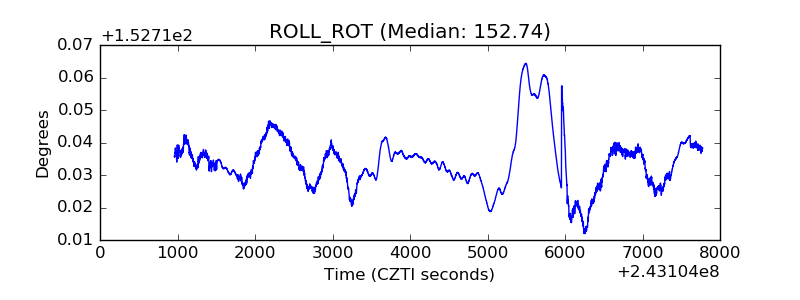 |
| _Roll_DEC | 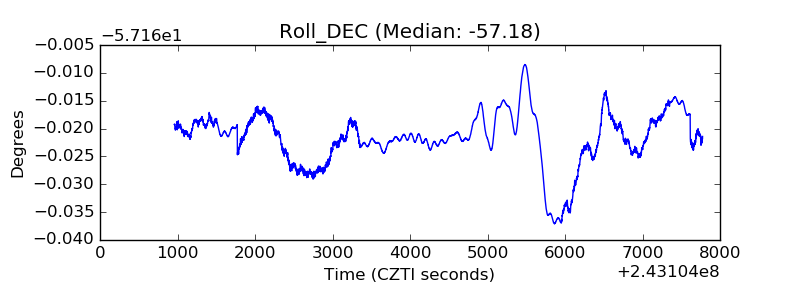 |
| _Roll_RA | 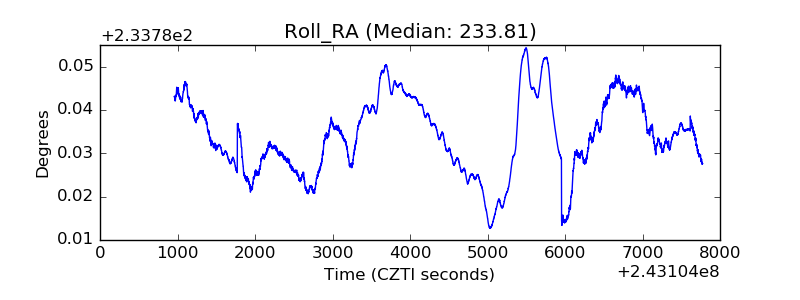 |
| Veto Counter | 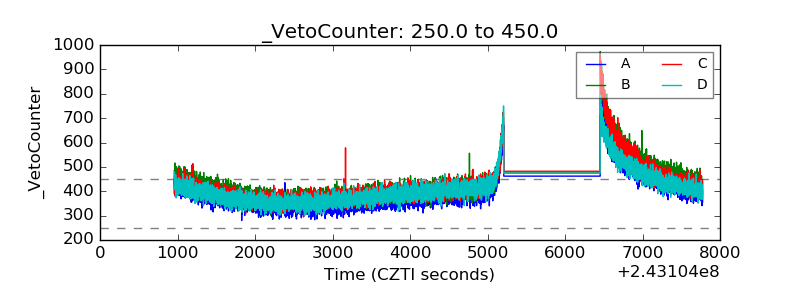 |