| Param | Original file | Final file |
|---|---|---|
| Filename | modeM0/AS1T01_191T01_9000001536_10624cztM0_level2.evt | modeM0/AS1T01_191T01_9000001536_10624cztM0_level2_quad_clean.evt |
| Size (bytes) | 483,249,600 | 84,064,320 |
| Size | 460.9 MB | 80.2 MB |
| Events in quadrant A | 2,890,508 | 544,644 |
| Events in quadrant B | 3,990,403 | 549,691 |
| Events in quadrant C | 2,866,594 | 548,238 |
| Events in quadrant D | 4,493,236 | 496,665 |
| Mode SS | |||
|---|---|---|---|
| Quadrant | BADHDUFLAG | Total packets | Discarded packets |
| A | 0 | 120 | 0 |
| B | 0 | 120 | 0 |
| C | 0 | 120 | 0 |
| D | 0 | 120 | 0 |
| Mode M9 | |||
|---|---|---|---|
| Quadrant | BADHDUFLAG | Total packets | Discarded packets |
| A | 0 | 13 | 0 |
| B | 0 | 13 | 0 |
| C | 0 | 13 | 0 |
| D | 0 | 13 | 0 |
| Mode M0 | |||
|---|---|---|---|
| Quadrant | BADHDUFLAG | Total packets | Discarded packets |
| A | 0 | 12186 | 2 |
| B | 0 | 15571 | 1 |
| C | 0 | 12250 | 1 |
| D | 0 | 17250 | 1 |
| Quadrant | Total seconds | Saturated seconds | Saturation percentage |
|---|---|---|---|
| A | 5810 | 30 | 0.516351% |
| B | 5810 | 300 | 5.163511% |
| C | 5810 | 7 | 0.120482% |
| D | 5810 | 234 | 4.027539% |
Noise dominated data is calculated using 1-second bins in cleaned event files. If a bin has >2000 counts, and if more than 50% of those come from <1% of pixels, then it is considered to be noise-dominated and hence unusable.
| Quadrant | # 1 sec bins | Bins with >0 counts | Bins with >2000 counts | High rate bins dominated by noise | Noise dominated (total time) | Noise dominated (detector-on time) | Marked lightcurve |
|---|---|---|---|---|---|---|---|
| A | 7145 | 5811 | 0 | 0 | 0.00% | 0.00% | 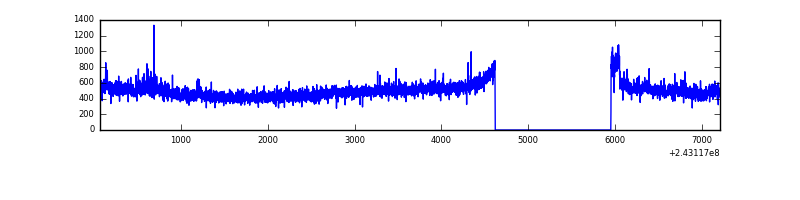 |
| B | 7145 | 5811 | 203 | 203 | 2.84% | 3.49% | 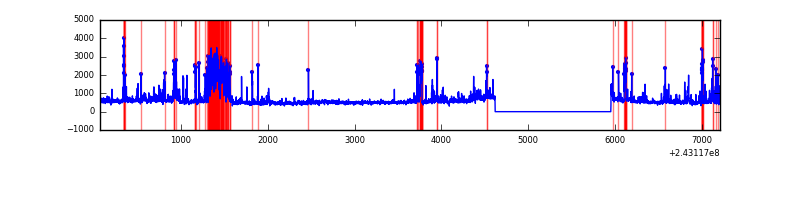 |
| C | 7145 | 5811 | 0 | 0 | 0.00% | 0.00% | 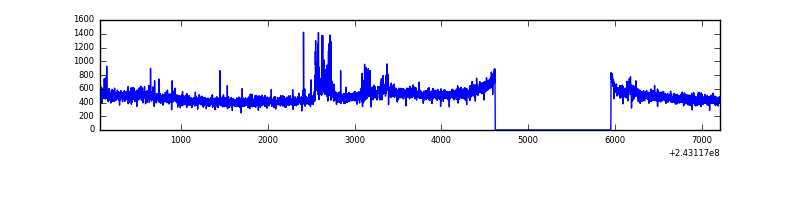 |
| D | 7145 | 5811 | 186 | 186 | 2.60% | 3.20% | 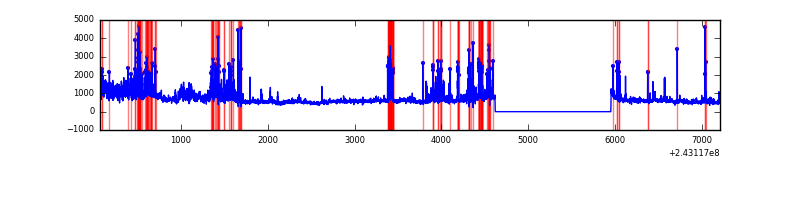 |
Top three noisy pixels from each quadrant. If the there are fewer than three noisy pixels in the level2.evt file, extra rows are filled as -1
| Pixel properties | Quadrant properties | ||||||
|---|---|---|---|---|---|---|---|
| Quadrant | DetID | PixID | Counts | Sigma | Mean | Median | Sigma |
| A | 13 | 251 | 51562 | 341.3 | 723 | 711 | 149.0 |
| A | 1 | 162 | 25051 | 163.36 | 723 | 711 | 149.0 |
| A | 13 | 14 | 9288 | 57.57 | 723 | 711 | 149.0 |
| B | 4 | 239 | 965839 | 7086.86 | 719 | 706 | 136.2 |
| B | 0 | 219 | 168987 | 1235.67 | 719 | 706 | 136.2 |
| B | 0 | 214 | 36104 | 259.92 | 719 | 706 | 136.2 |
| C | 4 | 254 | 124198 | 773.8 | 699 | 707 | 159.6 |
| C | 14 | 234 | 10217 | 59.59 | 699 | 707 | 159.6 |
| C | 13 | 61 | 5250 | 28.47 | 699 | 707 | 159.6 |
| D | 2 | 16 | 522042 | 3209.86 | 676 | 660 | 162.4 |
| D | 13 | 104 | 500850 | 3079.39 | 676 | 660 | 162.4 |
| D | 5 | 222 | 452022 | 2778.78 | 676 | 660 | 162.4 |
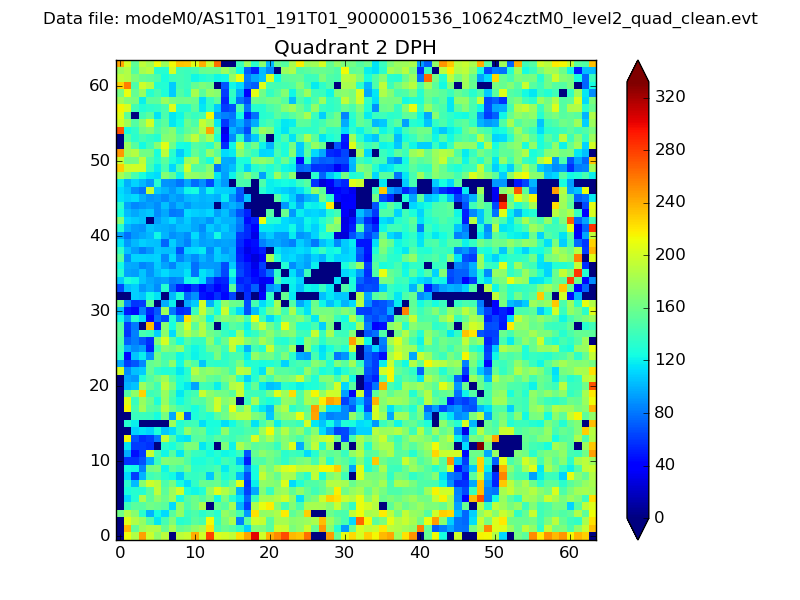
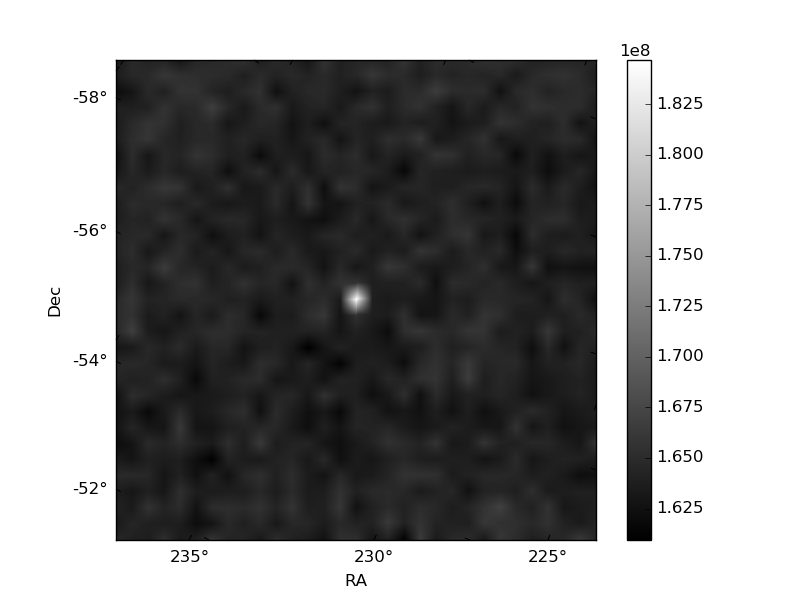
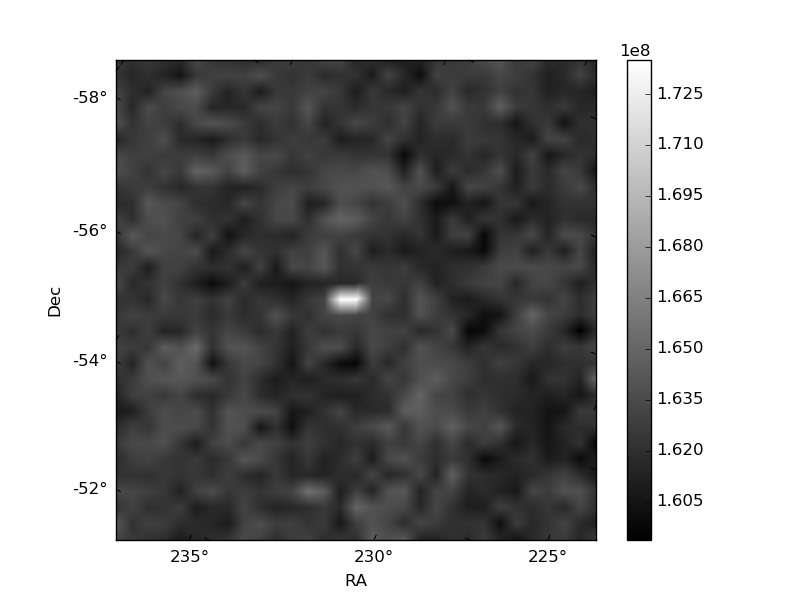
Histogram calculated using DETX and DETY for each event in the final _common_clean file
| Quadrant A | 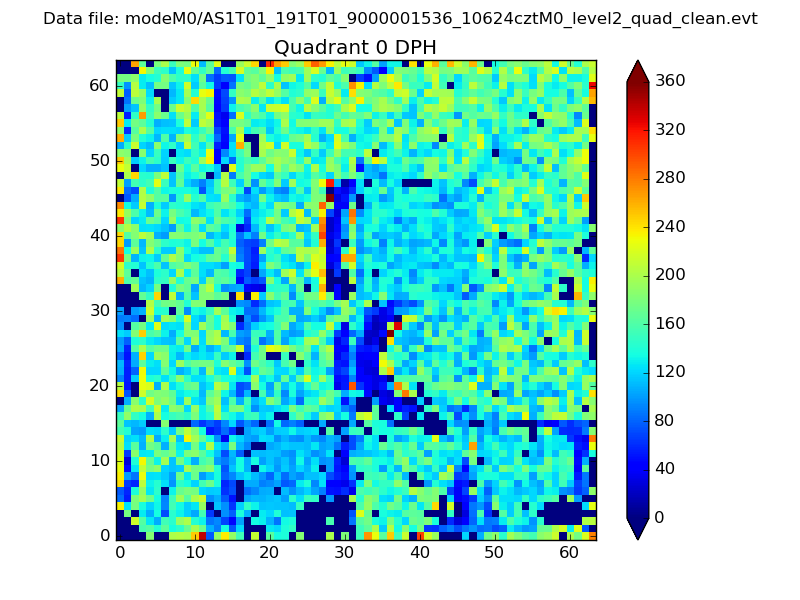 |
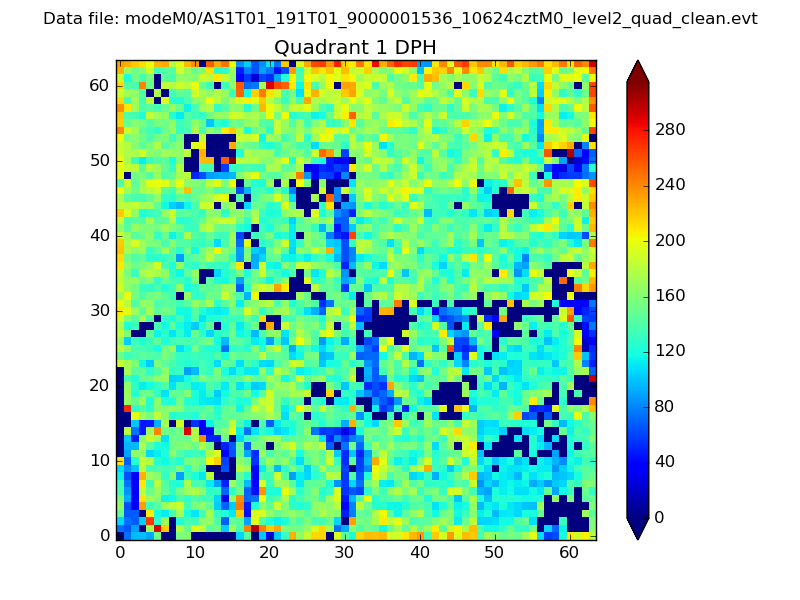 |
Quadrant B |
|---|---|---|---|
| Quadrant D | 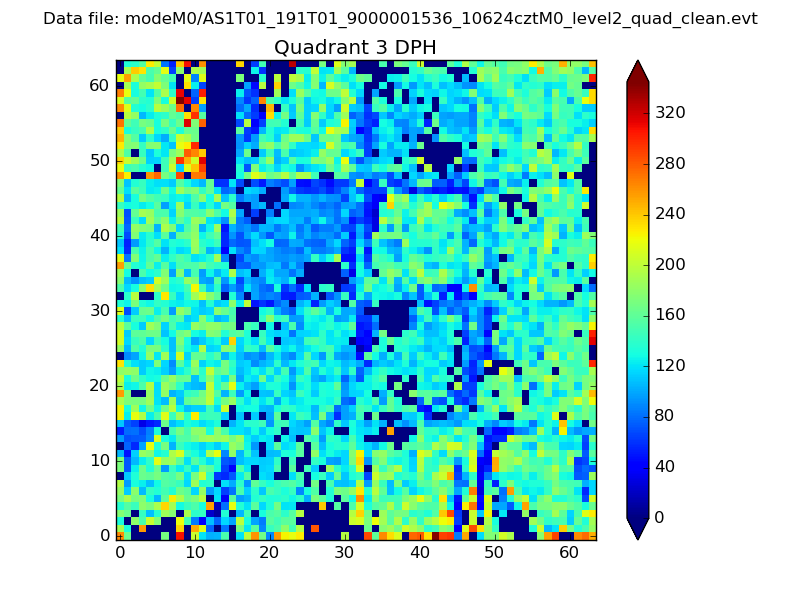 |
 |
Quadrant C |
| Plot type | Count rate plots | Images |
|---|---|---|
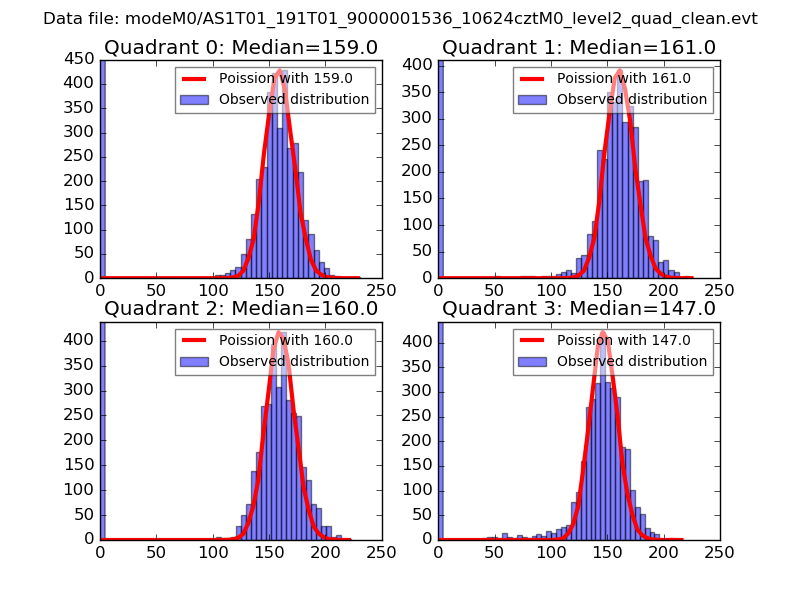
| Comparison with Poisson distribution Blue bars denote a histogram of data divided into 1 sec bins. Red curve is a Poisson curve with rate = median count rate of data. |
 |
 |
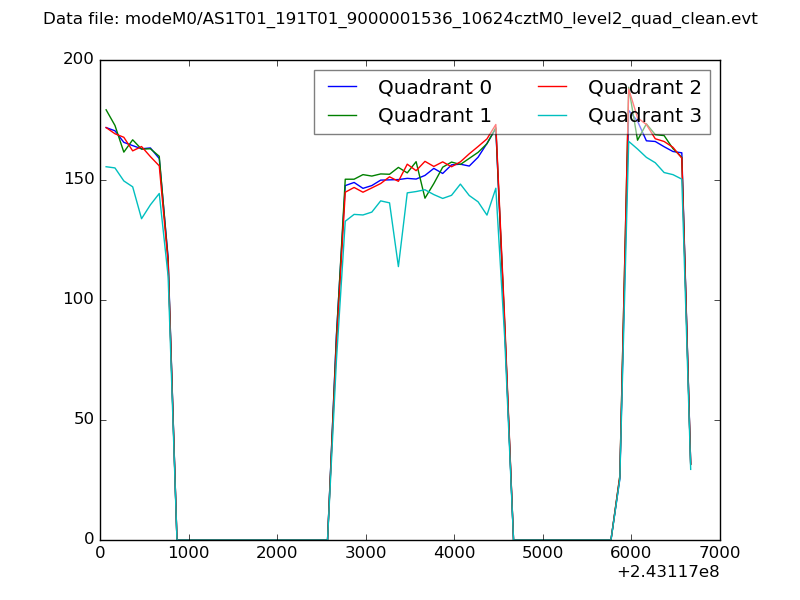
| Quadrant-wise count rates Data is divided into 100 sec bins |
 |
|
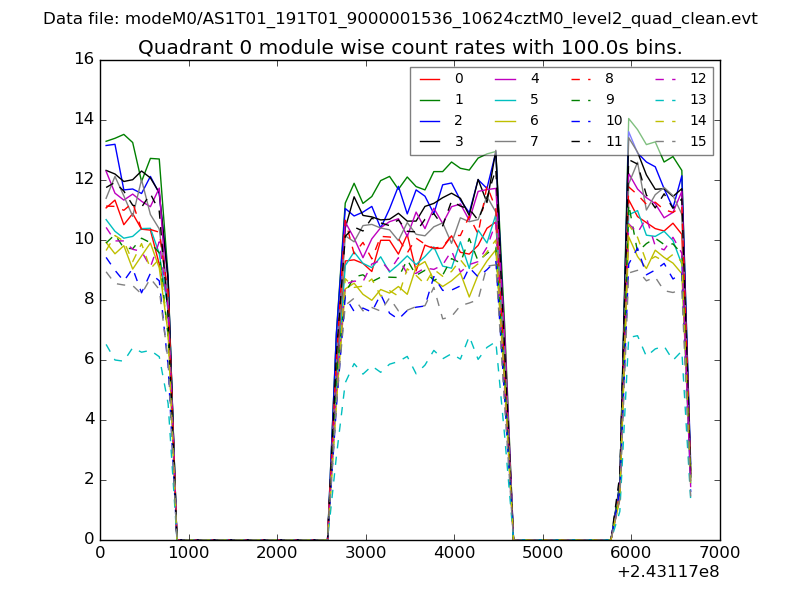
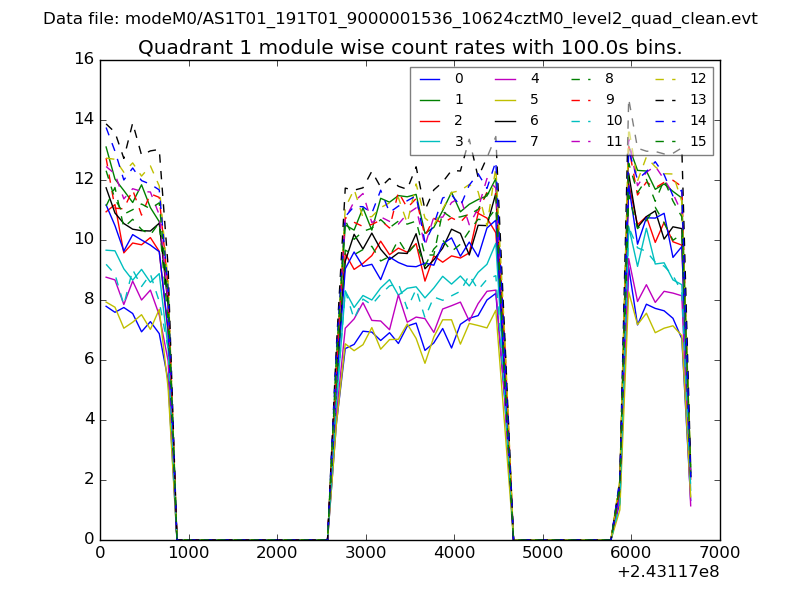
| Module-wise count rates for Quadrant A Data is divided into 100 sec bins |
 |
 |
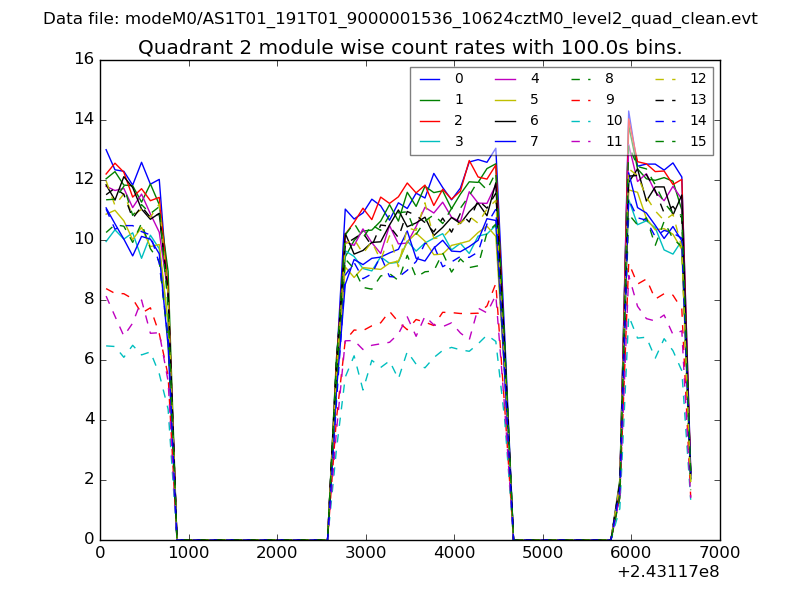
| Module-wise count rates for Quadrant B Data is divided into 100 sec bins |
 |
 |
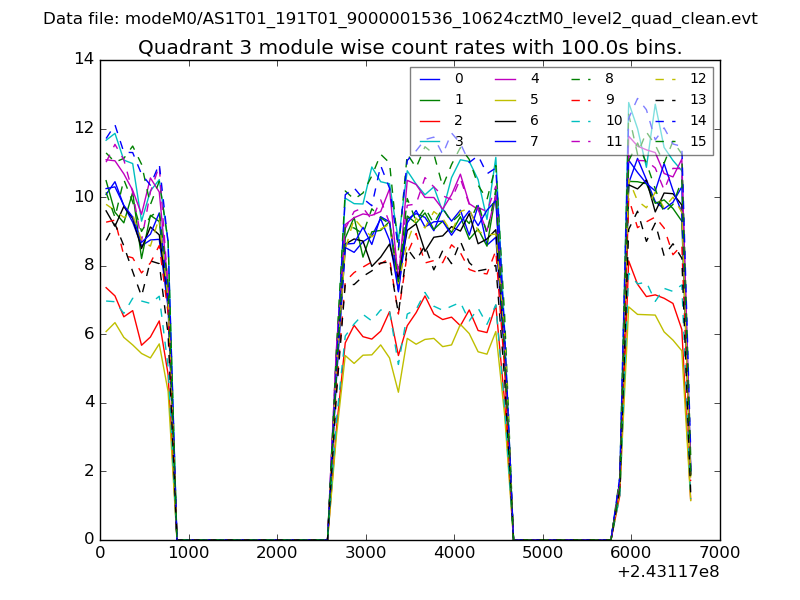
| Module-wise count rates for Quadrant C Data is divided into 100 sec bins |
 |
 |
| Module-wise count rates for Quadrant D Data is divided into 100 sec bins |
 |
 |
| Parameter | Plot |
|---|---|
| CZT HV Monitor | 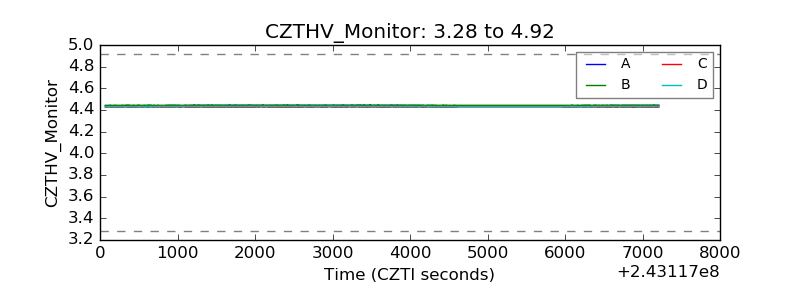 |
| D_VDD | 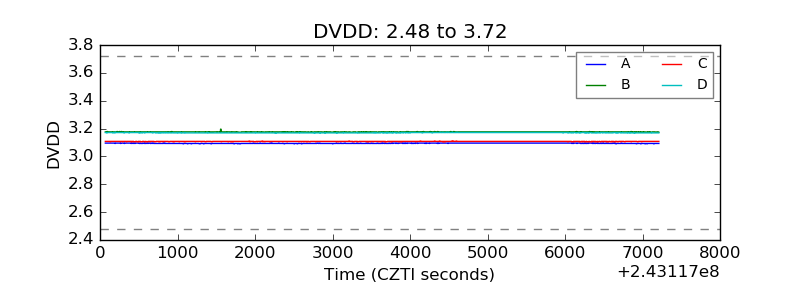 |
| Temperature 1 | 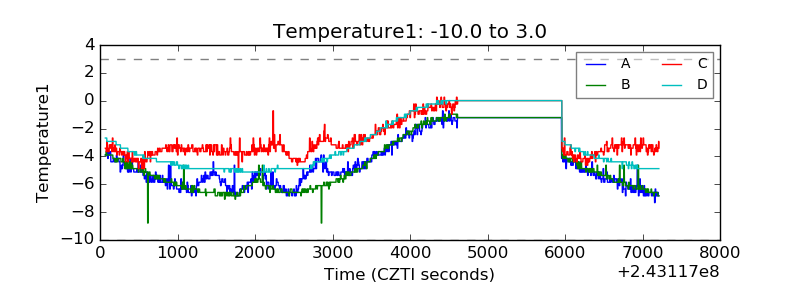 |
| Veto HV Monitor | 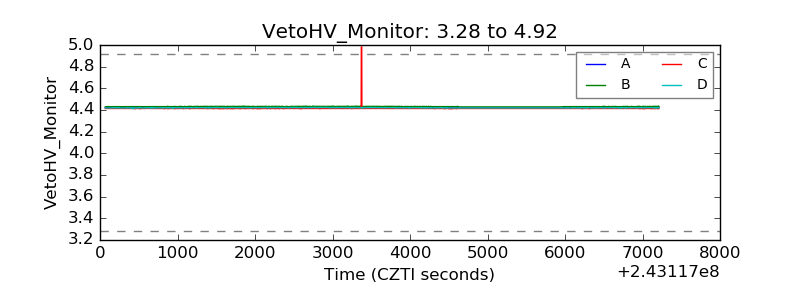 |
| Veto LLD | 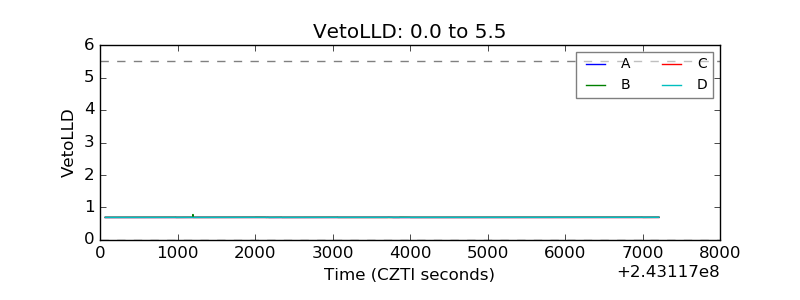 |
| Alpha Counter | 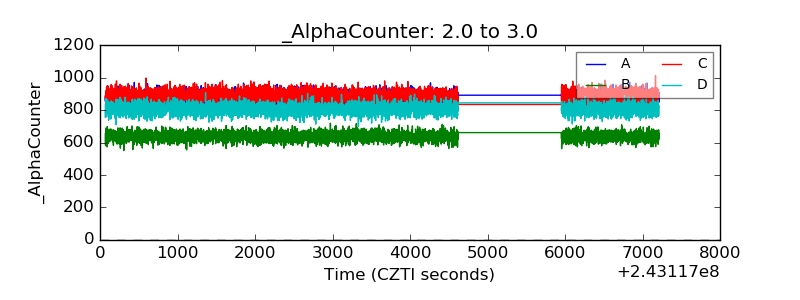 |
| _CPM_Rate | 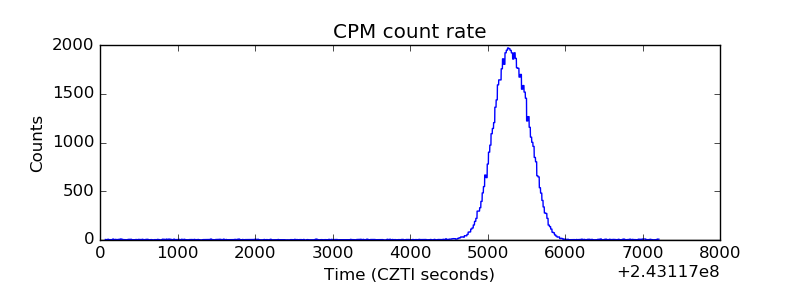 |
| CZT Counter | 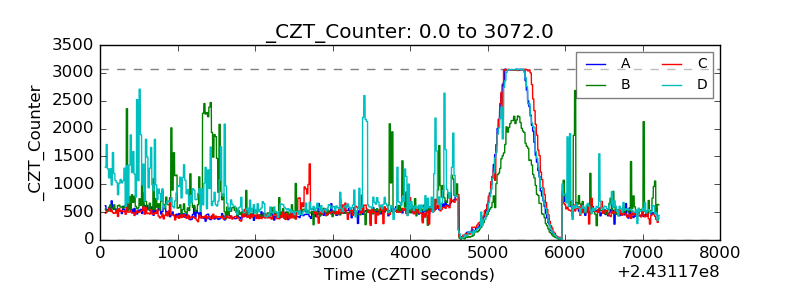 |
| +2.5 Volts monitor |  |
| +5 Volts monitor |  |
| _ROLL_ROT | 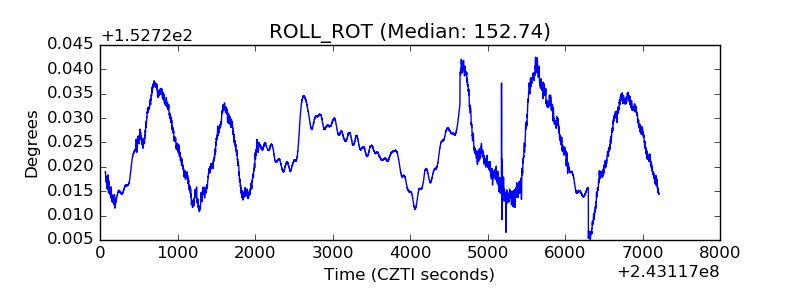 |
| _Roll_DEC | 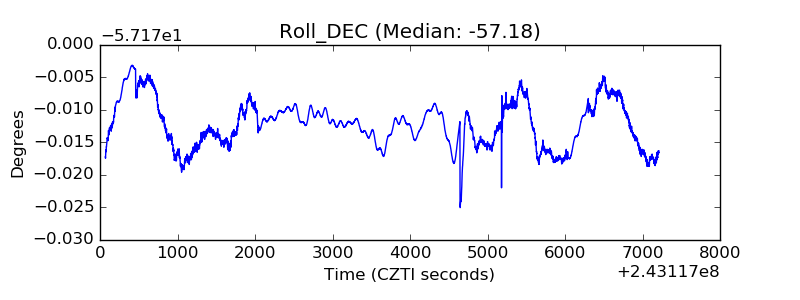 |
| _Roll_RA | 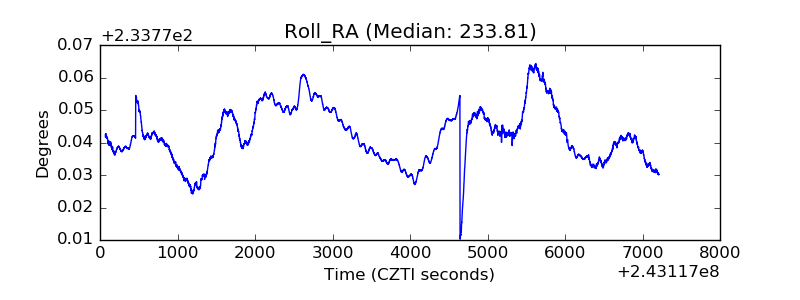 |
| Veto Counter | 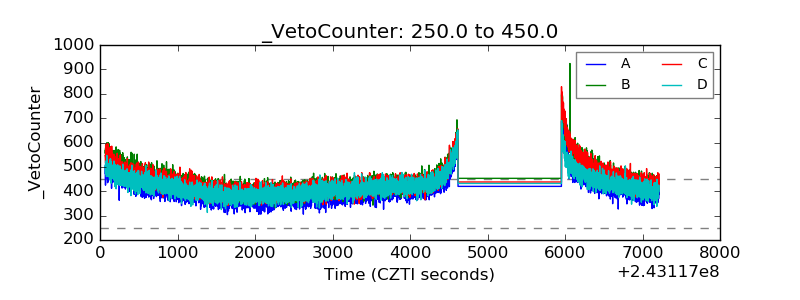 |