| Param | Original file | Final file |
|---|---|---|
| Filename | modeM0/AS1T01_191T01_9000001536_10625cztM0_level2.evt | modeM0/AS1T01_191T01_9000001536_10625cztM0_level2_quad_clean.evt |
| Size (bytes) | 467,628,480 | 84,660,480 |
| Size | 446.0 MB | 80.7 MB |
| Events in quadrant A | 3,143,240 | 538,262 |
| Events in quadrant B | 3,950,766 | 542,517 |
| Events in quadrant C | 3,022,042 | 542,082 |
| Events in quadrant D | 3,622,826 | 505,740 |
| Mode SS | |||
|---|---|---|---|
| Quadrant | BADHDUFLAG | Total packets | Discarded packets |
| A | 0 | 124 | 0 |
| B | 0 | 124 | 0 |
| C | 0 | 124 | 0 |
| D | 0 | 124 | 0 |
| Mode M9 | |||
|---|---|---|---|
| Quadrant | BADHDUFLAG | Total packets | Discarded packets |
| A | 0 | 13 | 0 |
| B | 0 | 13 | 0 |
| C | 0 | 13 | 0 |
| D | 0 | 13 | 0 |
| Mode M0 | |||
|---|---|---|---|
| Quadrant | BADHDUFLAG | Total packets | Discarded packets |
| A | 0 | 13189 | 2 |
| B | 0 | 15846 | 1 |
| C | 0 | 13118 | 1 |
| D | 0 | 14910 | 1 |
| Quadrant | Total seconds | Saturated seconds | Saturation percentage |
|---|---|---|---|
| A | 6244 | 34 | 0.544523% |
| B | 6244 | 163 | 2.610506% |
| C | 6244 | 25 | 0.400384% |
| D | 6244 | 57 | 0.912876% |
Noise dominated data is calculated using 1-second bins in cleaned event files. If a bin has >2000 counts, and if more than 50% of those come from <1% of pixels, then it is considered to be noise-dominated and hence unusable.
| Quadrant | # 1 sec bins | Bins with >0 counts | Bins with >2000 counts | High rate bins dominated by noise | Noise dominated (total time) | Noise dominated (detector-on time) | Marked lightcurve |
|---|---|---|---|---|---|---|---|
| A | 7484 | 6245 | 0 | 0 | 0.00% | 0.00% | 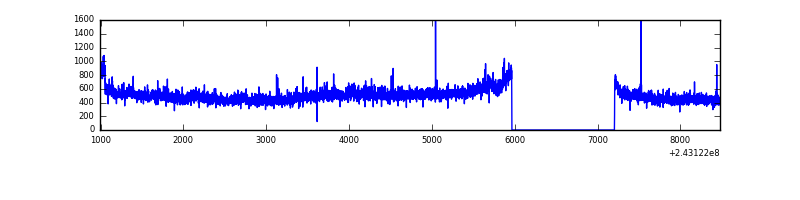 |
| B | 7484 | 6245 | 71 | 71 | 0.95% | 1.14% | 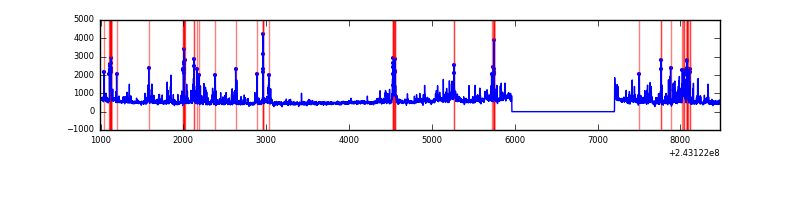 |
| C | 7484 | 6245 | 1 | 1 | 0.01% | 0.02% | 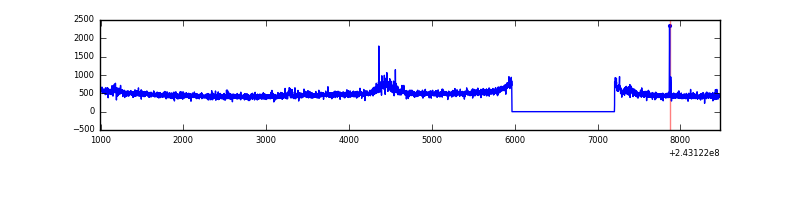 |
| D | 7484 | 6245 | 18 | 18 | 0.24% | 0.29% | 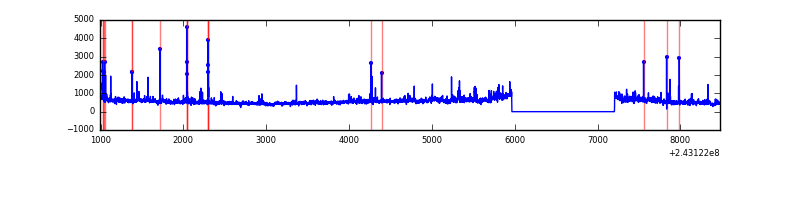 |
Top three noisy pixels from each quadrant. If the there are fewer than three noisy pixels in the level2.evt file, extra rows are filled as -1
| Pixel properties | Quadrant properties | ||||||
|---|---|---|---|---|---|---|---|
| Quadrant | DetID | PixID | Counts | Sigma | Mean | Median | Sigma |
| A | 13 | 251 | 146630 | 923.43 | 767 | 754 | 158.0 |
| A | 1 | 162 | 20395 | 124.33 | 767 | 754 | 158.0 |
| A | 13 | 14 | 8568 | 49.46 | 767 | 754 | 158.0 |
| B | 4 | 239 | 716027 | 4906.6 | 769 | 754 | 145.8 |
| B | 0 | 219 | 95202 | 647.89 | 769 | 754 | 145.8 |
| B | 0 | 85 | 66432 | 450.54 | 769 | 754 | 145.8 |
| C | 4 | 254 | 100245 | 583.12 | 744 | 751 | 170.6 |
| C | 12 | 4 | 11070 | 60.48 | 744 | 751 | 170.6 |
| C | 14 | 67 | 9870 | 53.44 | 744 | 751 | 170.6 |
| D | 2 | 16 | 531523 | 3016.34 | 732 | 714 | 176.0 |
| D | 13 | 104 | 80140 | 451.34 | 732 | 714 | 176.0 |
| D | 8 | 195 | 76832 | 432.54 | 732 | 714 | 176.0 |
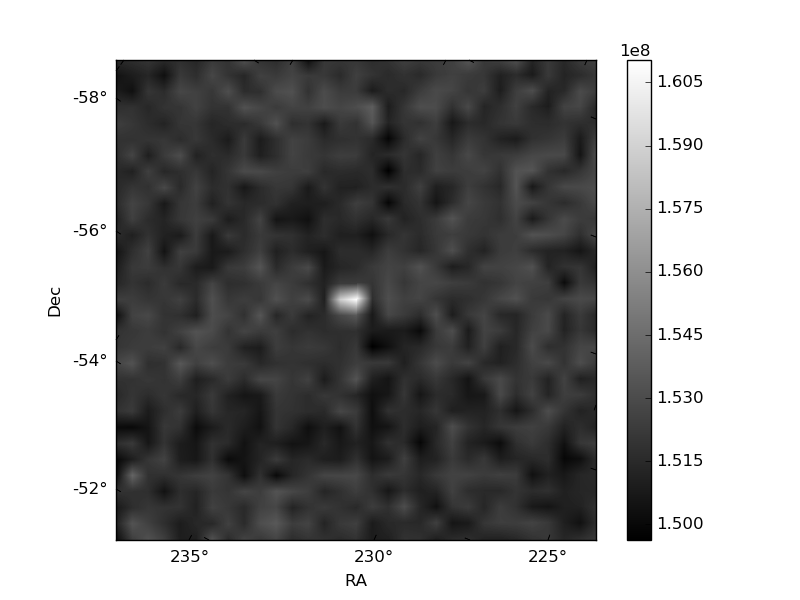
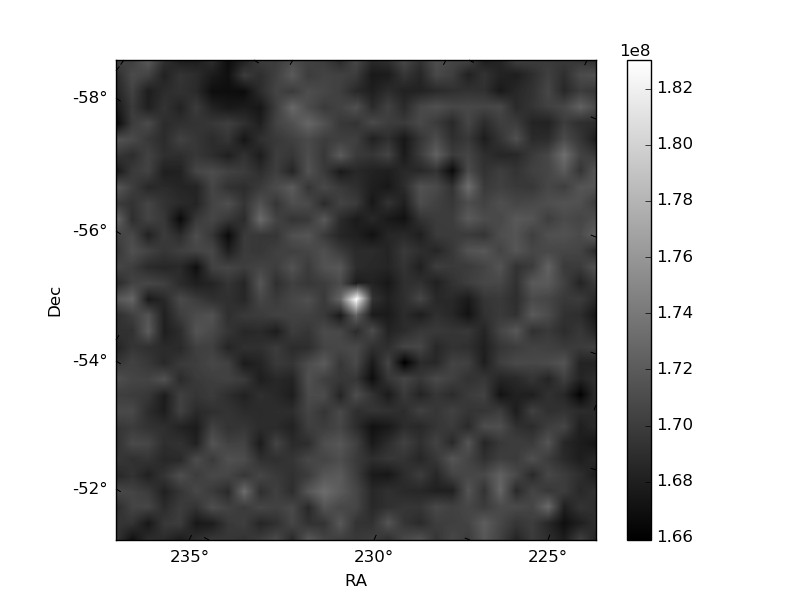
Histogram calculated using DETX and DETY for each event in the final _common_clean file
| Quadrant A | 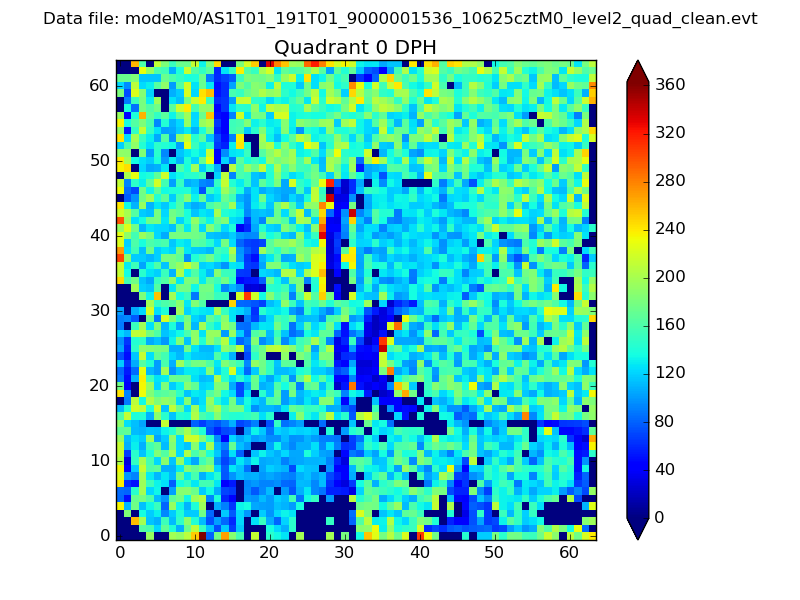 |
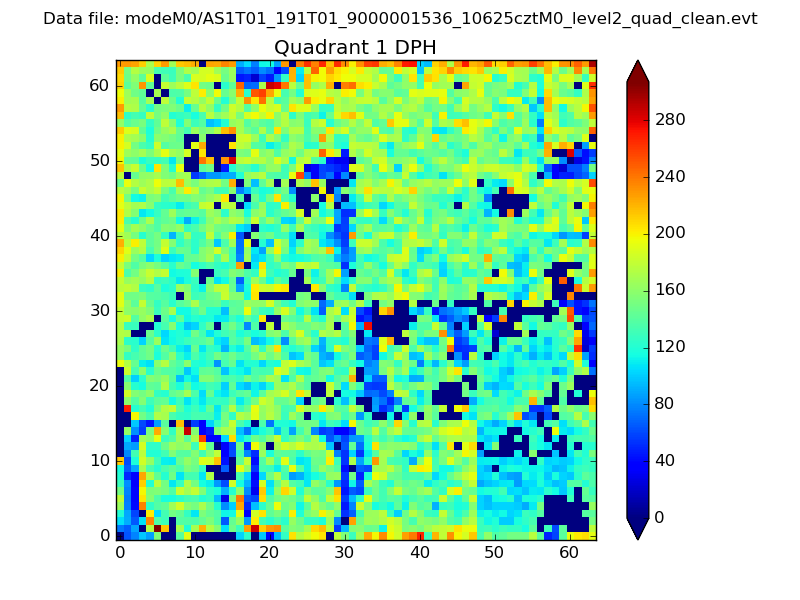 |
Quadrant B |
|---|---|---|---|
| Quadrant D | 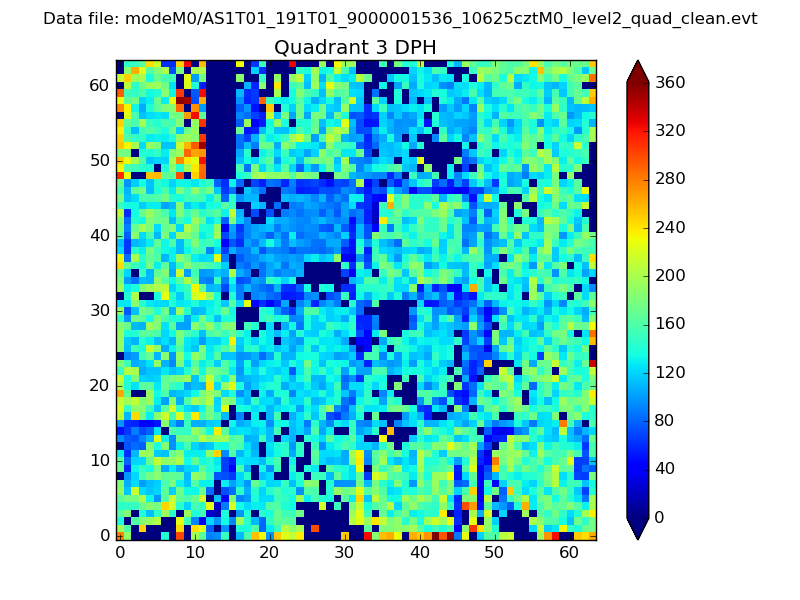 |
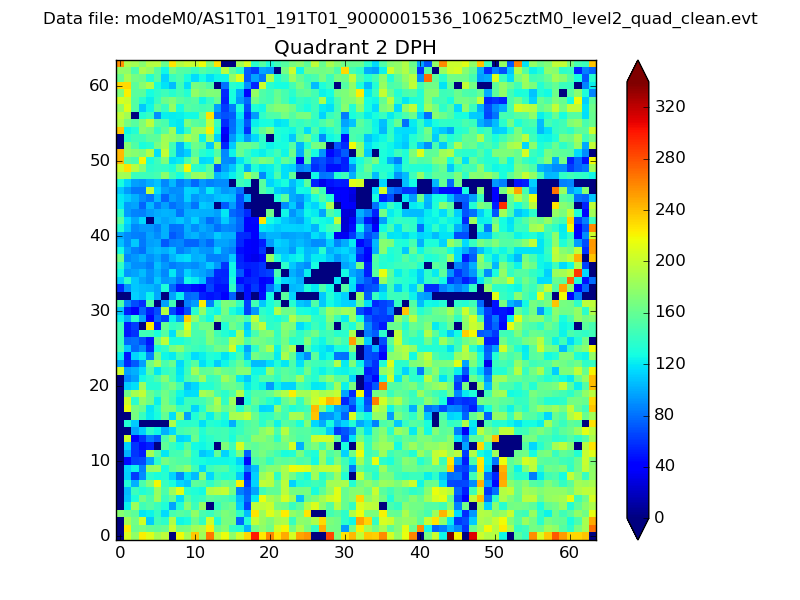 |
Quadrant C |
| Plot type | Count rate plots | Images |
|---|---|---|
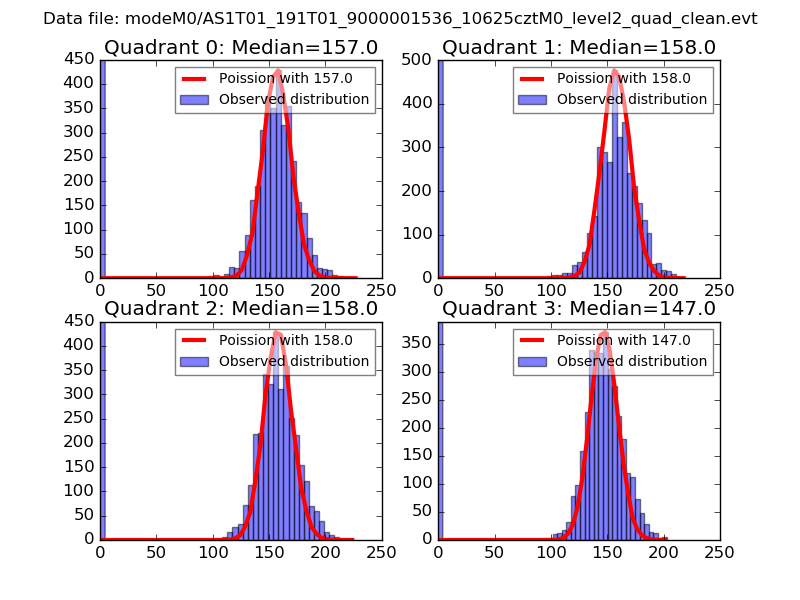
| Comparison with Poisson distribution Blue bars denote a histogram of data divided into 1 sec bins. Red curve is a Poisson curve with rate = median count rate of data. |
 |
 |
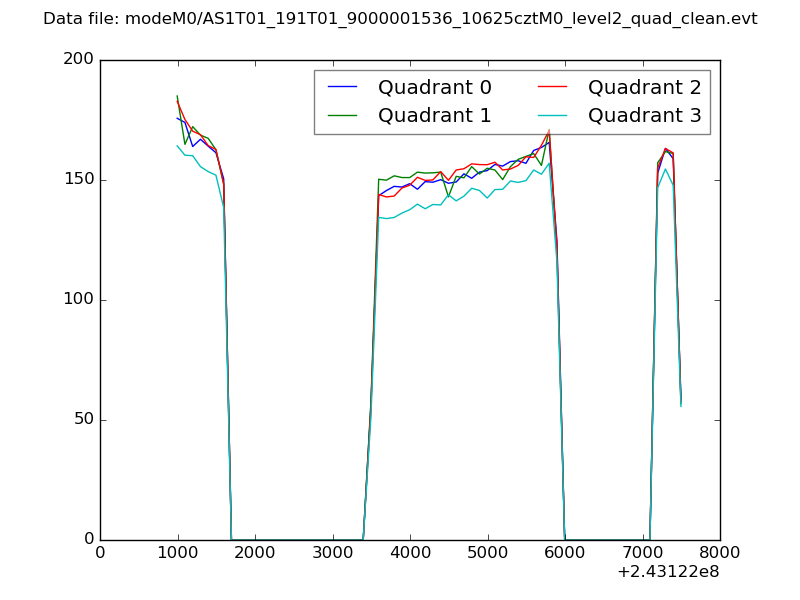
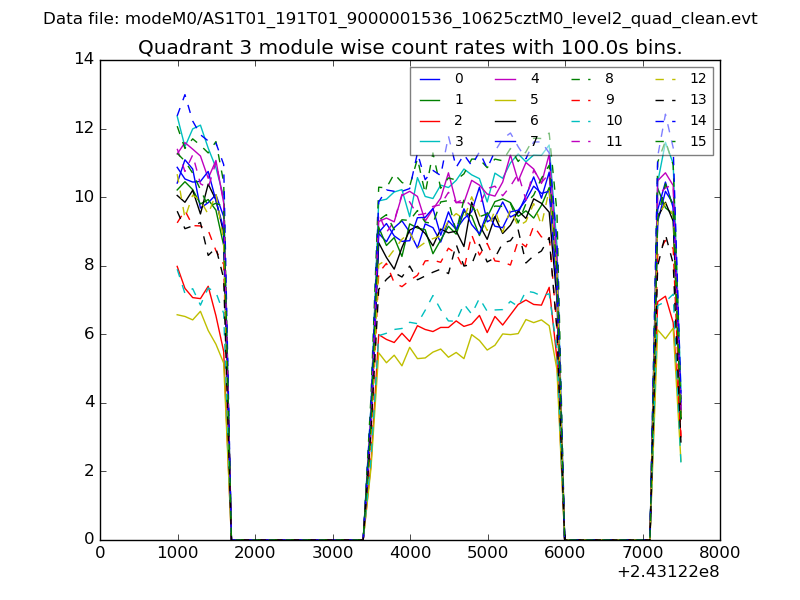
| Quadrant-wise count rates Data is divided into 100 sec bins |
 |
|
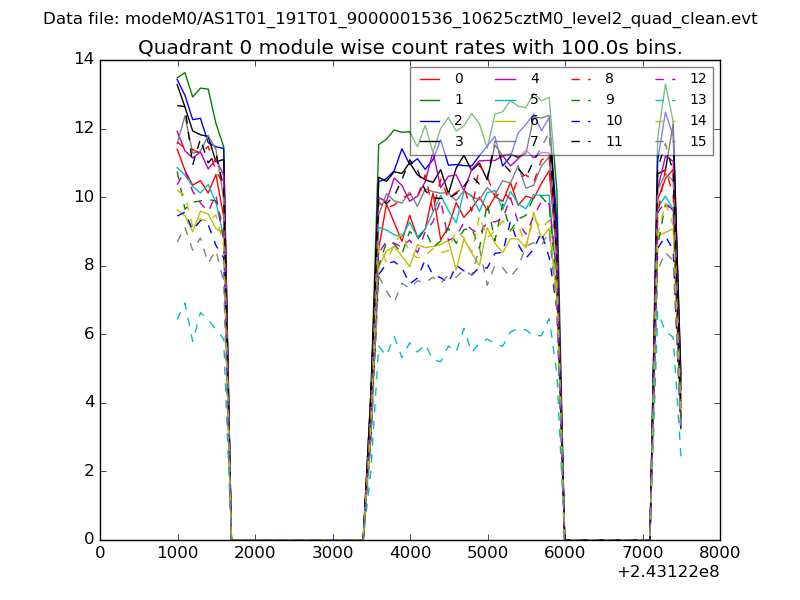
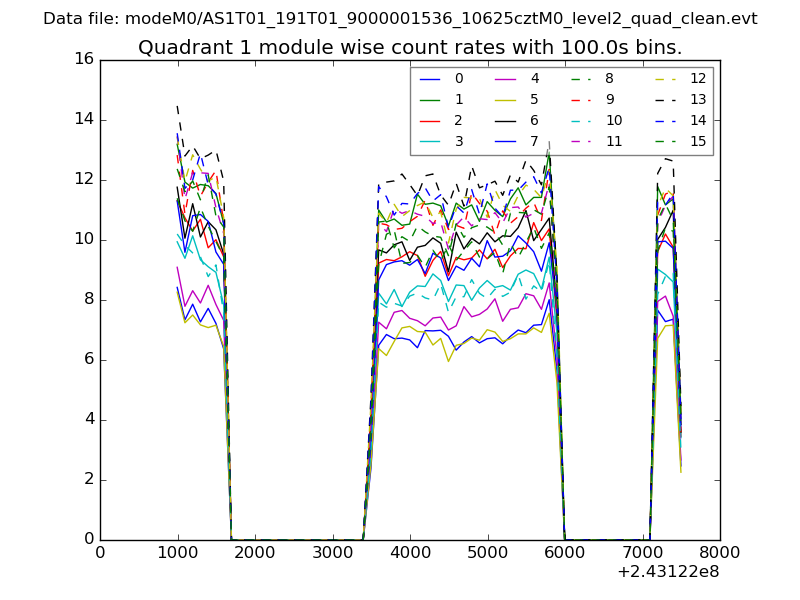
| Module-wise count rates for Quadrant A Data is divided into 100 sec bins |
 |
 |
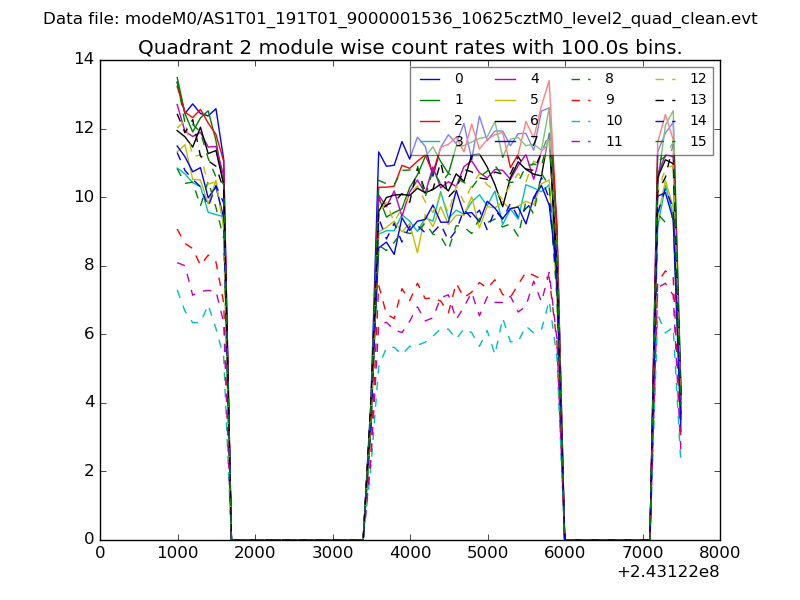
| Module-wise count rates for Quadrant B Data is divided into 100 sec bins |
 |
 |
| Module-wise count rates for Quadrant C Data is divided into 100 sec bins |
 |
 |
| Module-wise count rates for Quadrant D Data is divided into 100 sec bins |
 |
 |
| Parameter | Plot |
|---|---|
| CZT HV Monitor | 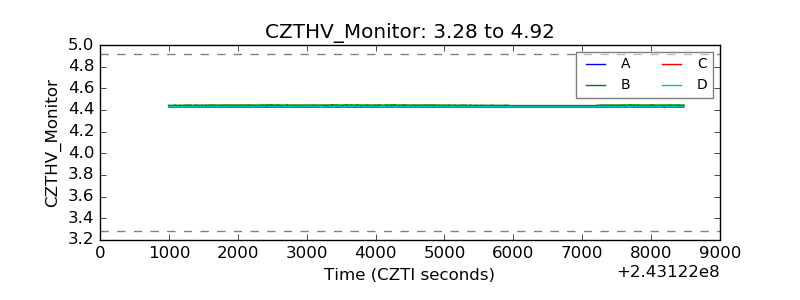 |
| D_VDD | 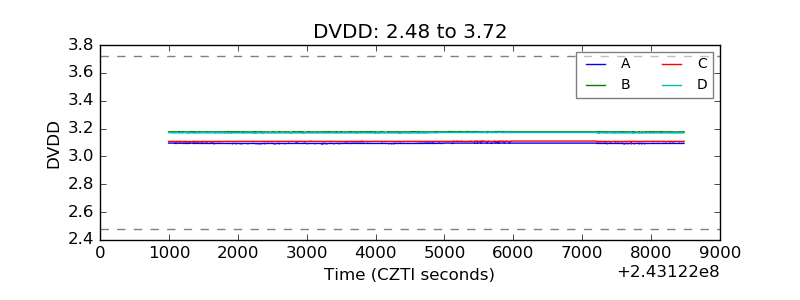 |
| Temperature 1 | 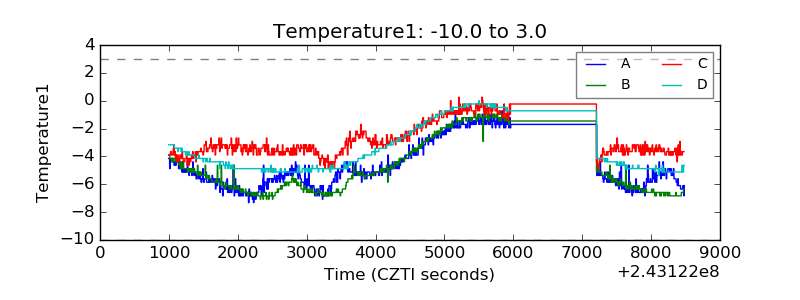 |
| Veto HV Monitor | 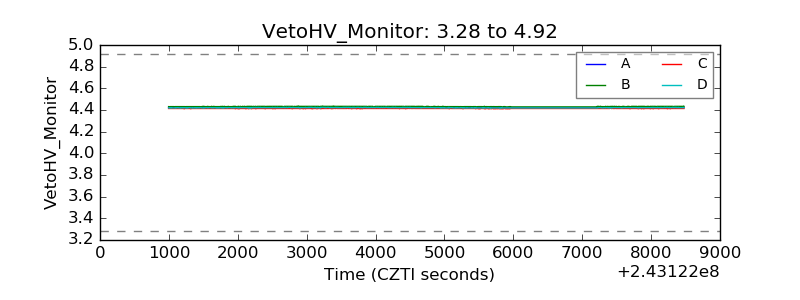 |
| Veto LLD | 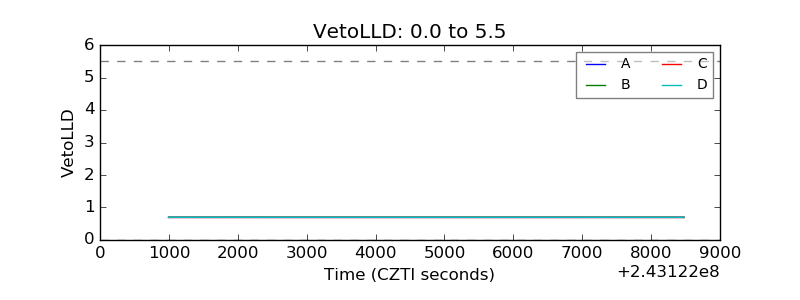 |
| Alpha Counter | 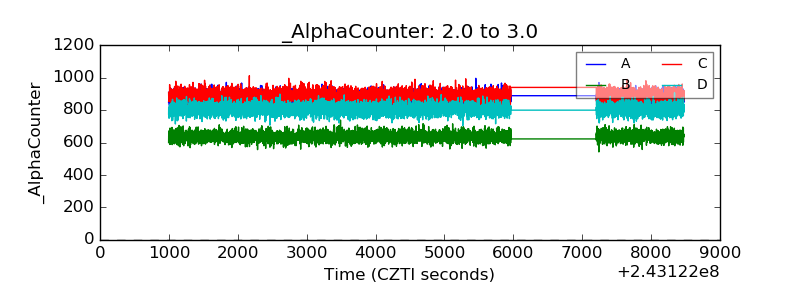 |
| _CPM_Rate | 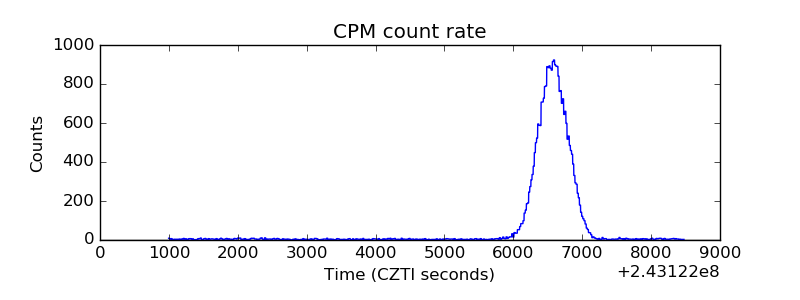 |
| CZT Counter | 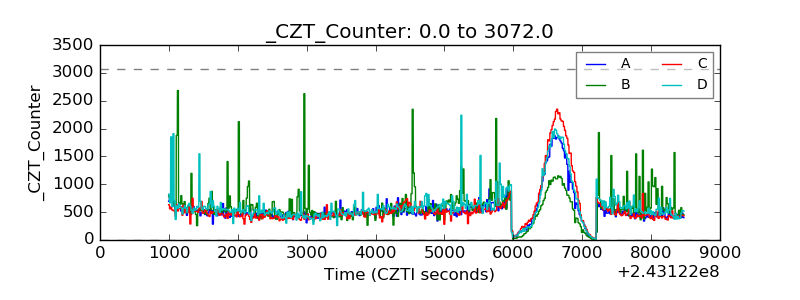 |
| +2.5 Volts monitor | 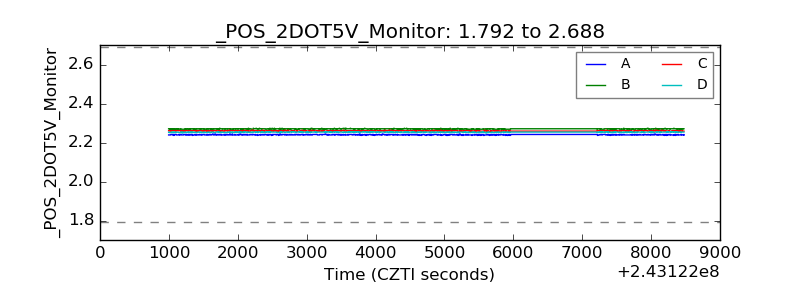 |
| +5 Volts monitor | 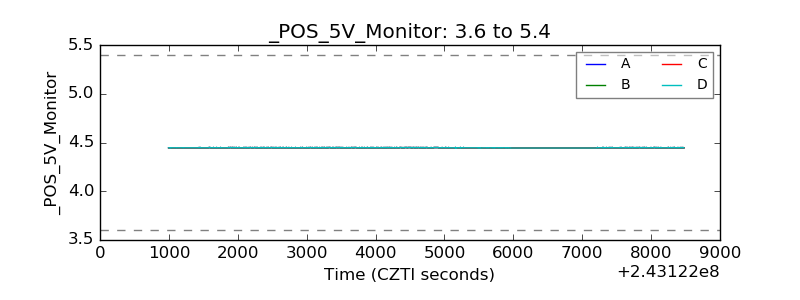 |
| _ROLL_ROT | 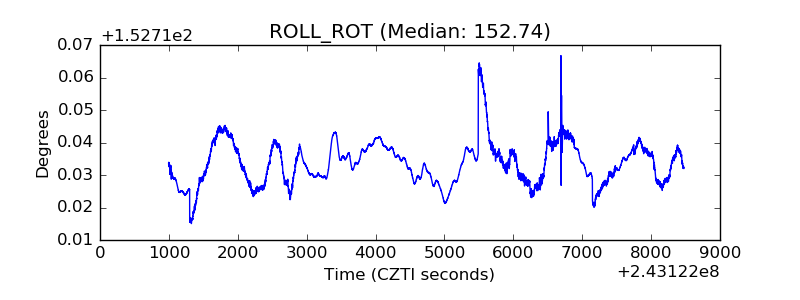 |
| _Roll_DEC | 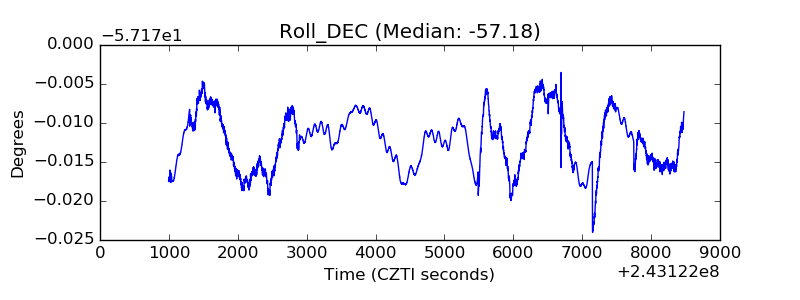 |
| _Roll_RA | 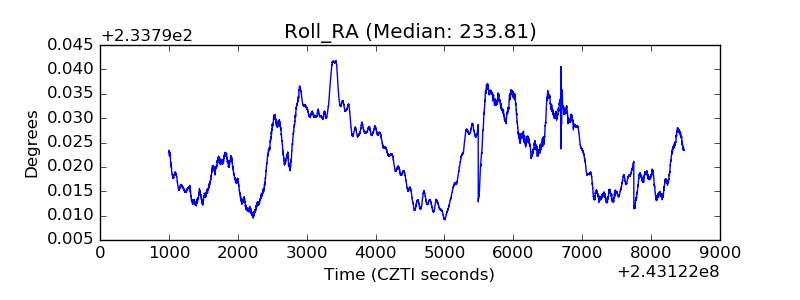 |
| Veto Counter | 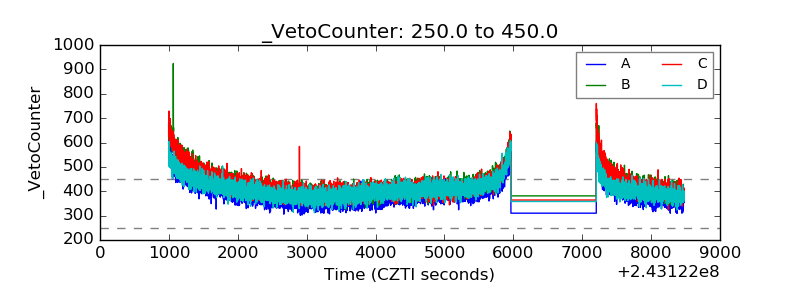 |