| Param | Original file | Final file |
|---|---|---|
| Filename | modeM0/AS1T01_191T01_9000001536_10627cztM0_level2.evt | modeM0/AS1T01_191T01_9000001536_10627cztM0_level2_quad_clean.evt |
| Size (bytes) | 639,187,200 | 109,094,400 |
| Size | 609.6 MB | 104.0 MB |
| Events in quadrant A | 3,956,027 | 701,222 |
| Events in quadrant B | 5,213,524 | 680,947 |
| Events in quadrant C | 4,287,502 | 697,444 |
| Events in quadrant D | 5,362,389 | 671,678 |
| Mode SS | |||
|---|---|---|---|
| Quadrant | BADHDUFLAG | Total packets | Discarded packets |
| A | 0 | 164 | 0 |
| B | 0 | 164 | 0 |
| C | 0 | 164 | 0 |
| D | 0 | 164 | 0 |
| Mode M9 | |||
|---|---|---|---|
| Quadrant | BADHDUFLAG | Total packets | Discarded packets |
| A | 0 | 14 | 0 |
| B | 0 | 14 | 0 |
| C | 0 | 14 | 0 |
| D | 0 | 14 | 0 |
| Mode M0 | |||
|---|---|---|---|
| Quadrant | BADHDUFLAG | Total packets | Discarded packets |
| A | 0 | 16914 | 3 |
| B | 0 | 20700 | 2 |
| C | 0 | 18170 | 2 |
| D | 0 | 21266 | 2 |
| Quadrant | Total seconds | Saturated seconds | Saturation percentage |
|---|---|---|---|
| A | 7945 | 148 | 1.862807% |
| B | 7945 | 467 | 5.877911% |
| C | 7945 | 196 | 2.466960% |
| D | 7945 | 213 | 2.680931% |
Noise dominated data is calculated using 1-second bins in cleaned event files. If a bin has >2000 counts, and if more than 50% of those come from <1% of pixels, then it is considered to be noise-dominated and hence unusable.
| Quadrant | # 1 sec bins | Bins with >0 counts | Bins with >2000 counts | High rate bins dominated by noise | Noise dominated (total time) | Noise dominated (detector-on time) | Marked lightcurve |
|---|---|---|---|---|---|---|---|
| A | 9315 | 7947 | 0 | 0 | 0.00% | 0.00% | 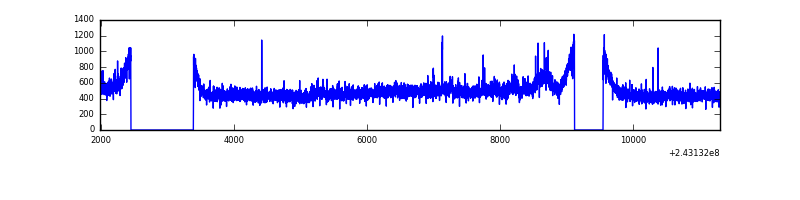 |
| B | 9315 | 7947 | 155 | 155 | 1.66% | 1.95% | 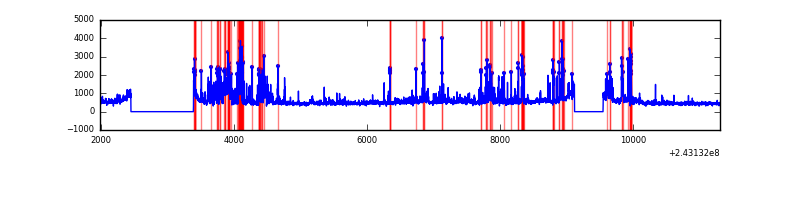 |
| C | 9315 | 7947 | 76 | 76 | 0.82% | 0.96% | 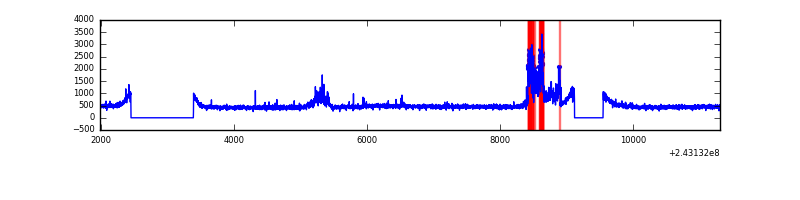 |
| D | 9315 | 7947 | 35 | 35 | 0.38% | 0.44% | 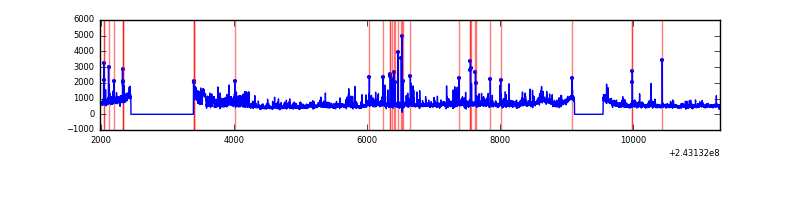 |
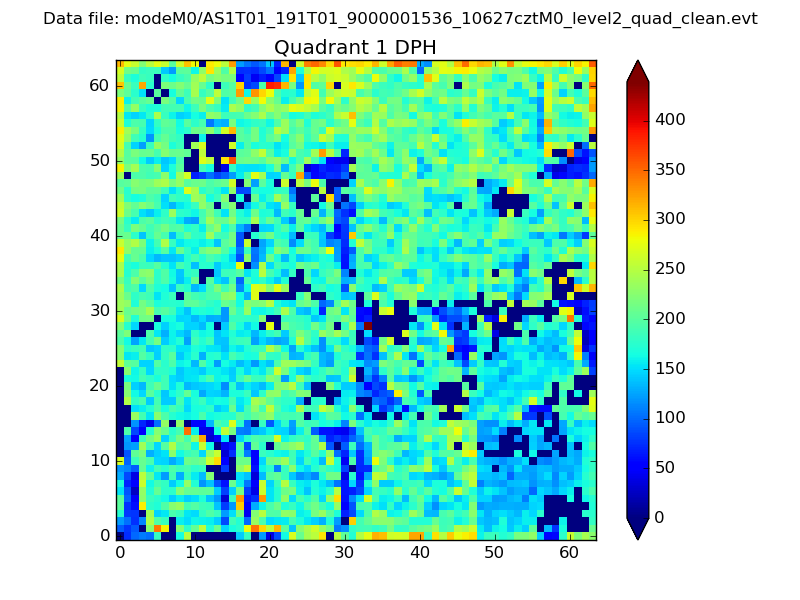
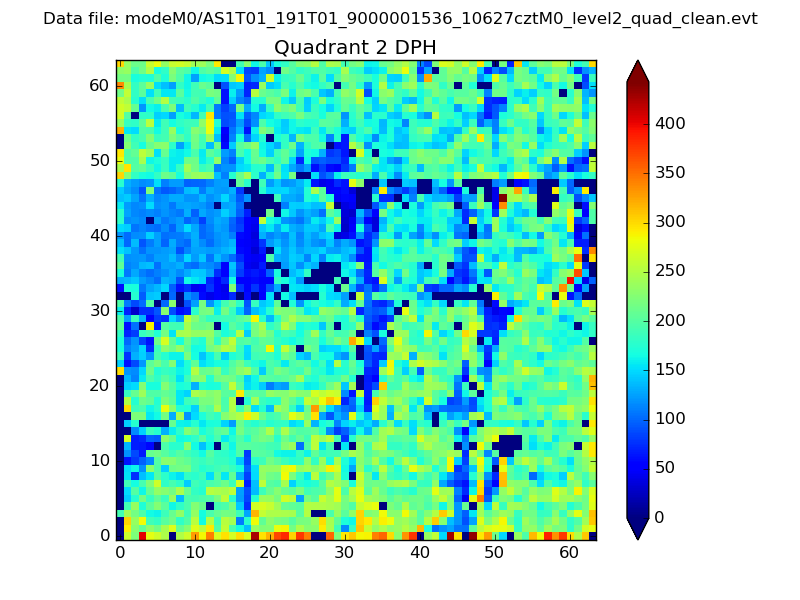
Top three noisy pixels from each quadrant. If the there are fewer than three noisy pixels in the level2.evt file, extra rows are filled as -1
| Pixel properties | Quadrant properties | ||||||
|---|---|---|---|---|---|---|---|
| Quadrant | DetID | PixID | Counts | Sigma | Mean | Median | Sigma |
| A | 13 | 251 | 124421 | 607.91 | 982 | 965 | 203.1 |
| A | 1 | 162 | 24713 | 116.94 | 982 | 965 | 203.1 |
| A | 0 | 226 | 8910 | 39.12 | 982 | 965 | 203.1 |
| B | 4 | 239 | 1167309 | 6285.36 | 964 | 940 | 185.6 |
| B | 0 | 219 | 85901 | 457.84 | 964 | 940 | 185.6 |
| B | 11 | 51 | 78432 | 417.59 | 964 | 940 | 185.6 |
| C | 4 | 254 | 526225 | 2359.41 | 956 | 966 | 222.6 |
| C | 14 | 234 | 11829 | 48.8 | 956 | 966 | 222.6 |
| C | 4 | 175 | 10010 | 40.62 | 956 | 966 | 222.6 |
| D | 1 | 52 | 874609 | 3758.56 | 948 | 923 | 232.5 |
| D | 2 | 16 | 587996 | 2525.56 | 948 | 923 | 232.5 |
| D | 8 | 195 | 179110 | 766.55 | 948 | 923 | 232.5 |
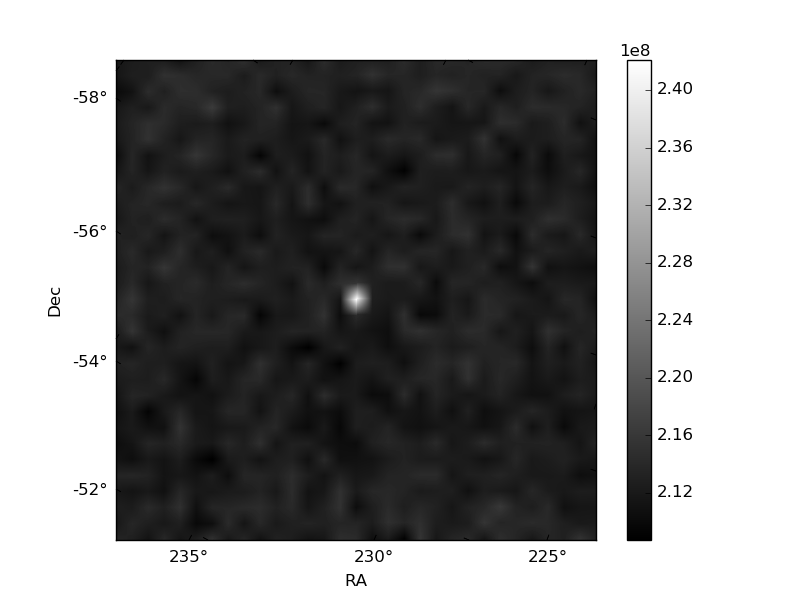
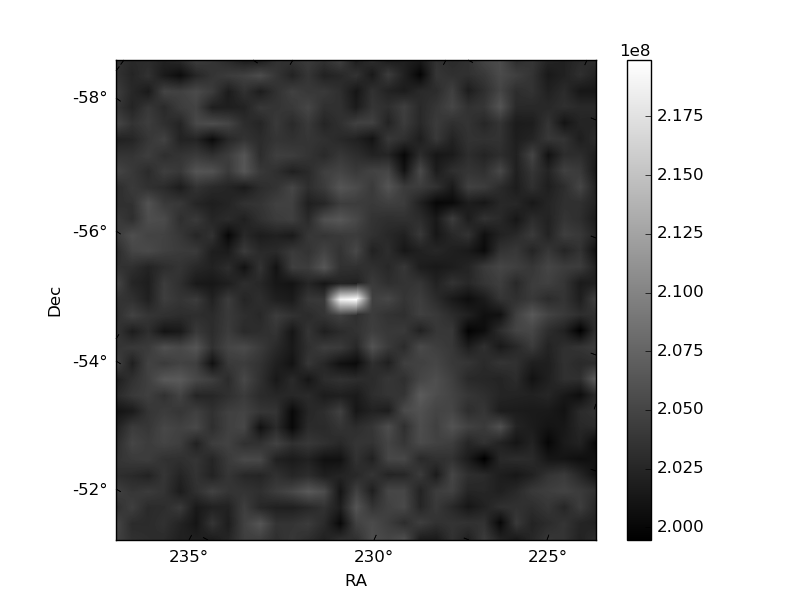
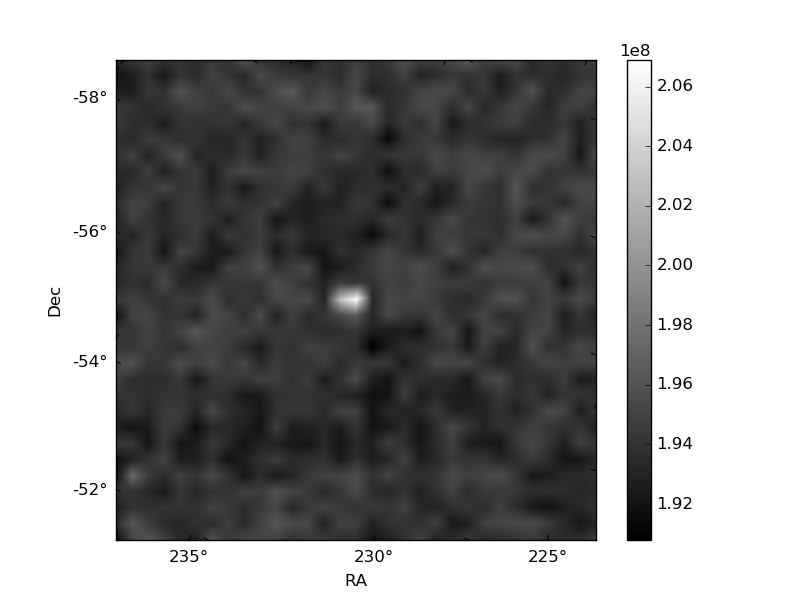
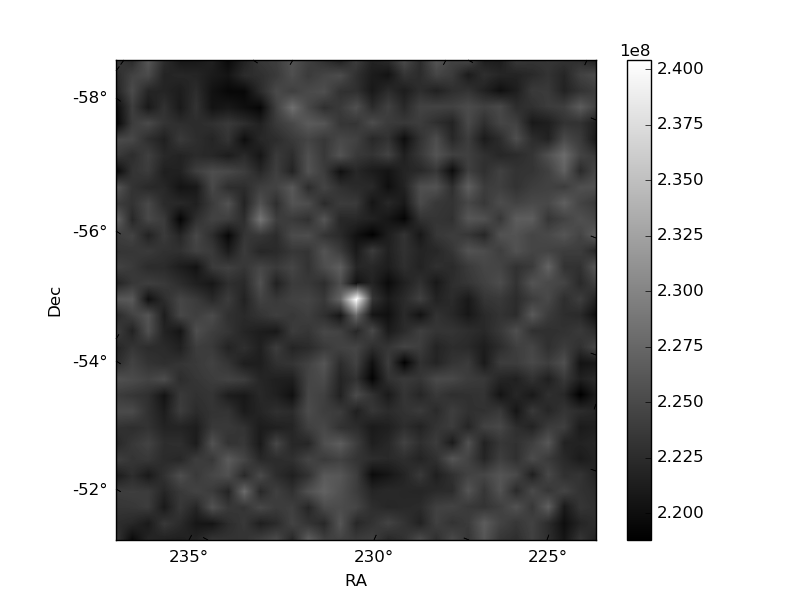
Histogram calculated using DETX and DETY for each event in the final _common_clean file
| Quadrant A | 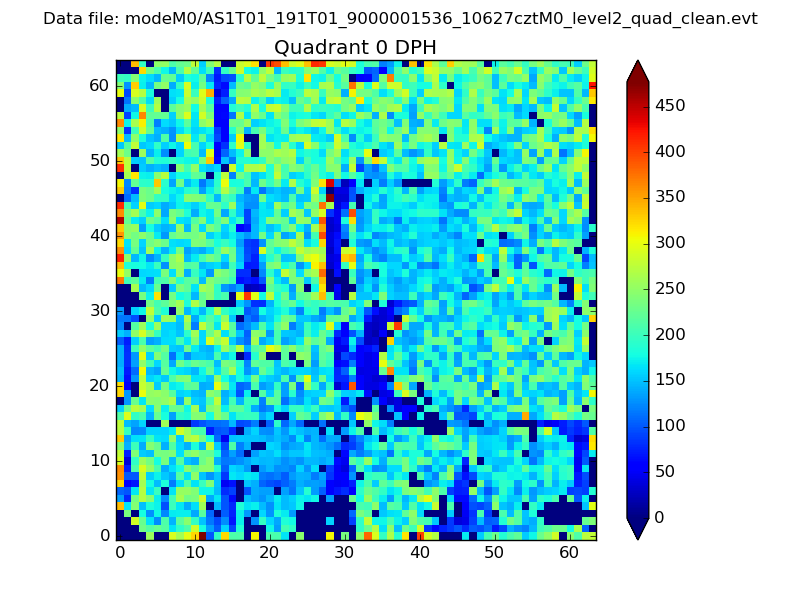 |
 |
Quadrant B |
|---|---|---|---|
| Quadrant D | 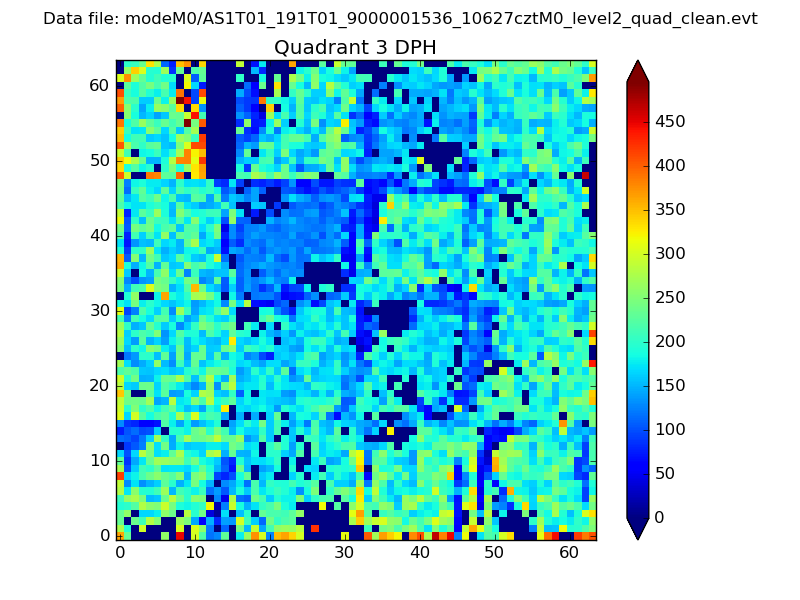 |
 |
Quadrant C |
| Plot type | Count rate plots | Images |
|---|---|---|
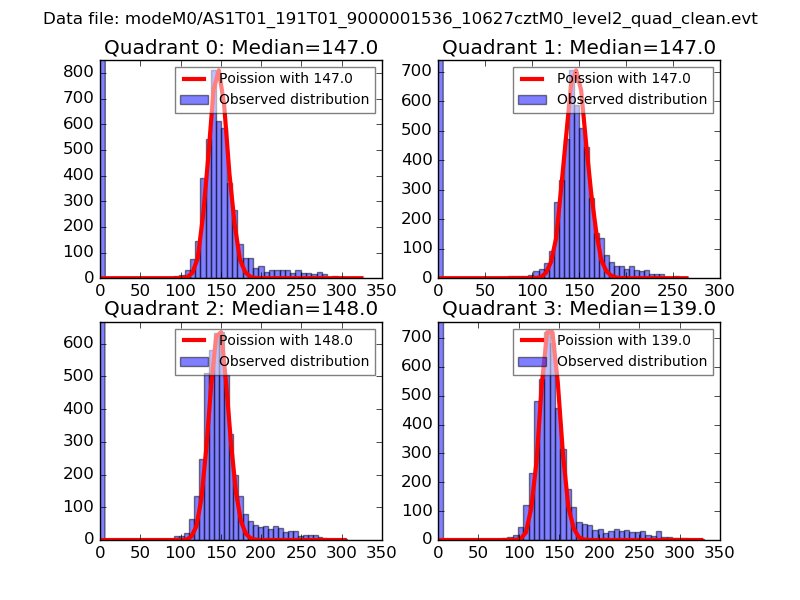
| Comparison with Poisson distribution Blue bars denote a histogram of data divided into 1 sec bins. Red curve is a Poisson curve with rate = median count rate of data. |
 |
 |
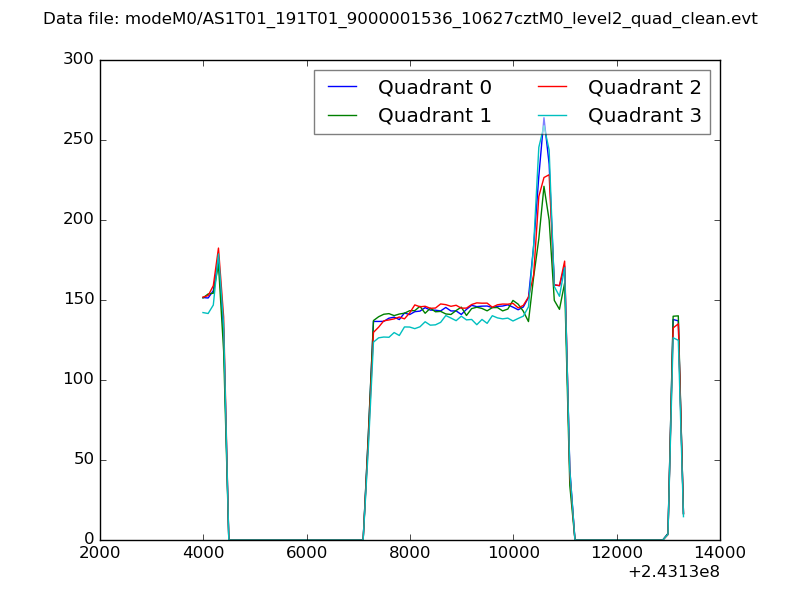
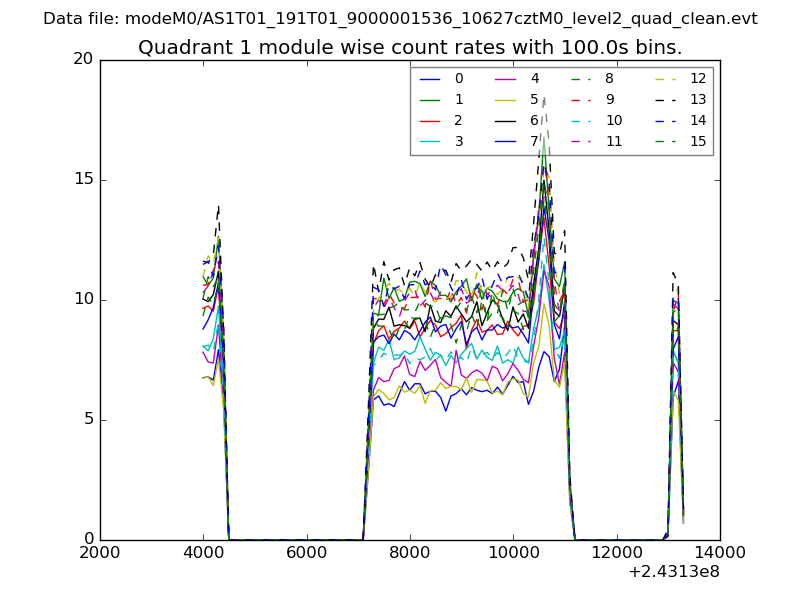
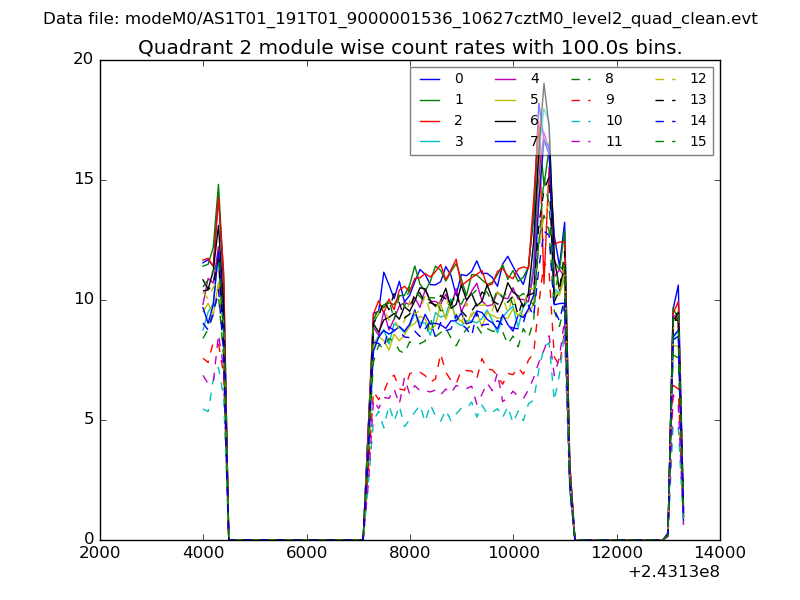
| Quadrant-wise count rates Data is divided into 100 sec bins |
 |
|
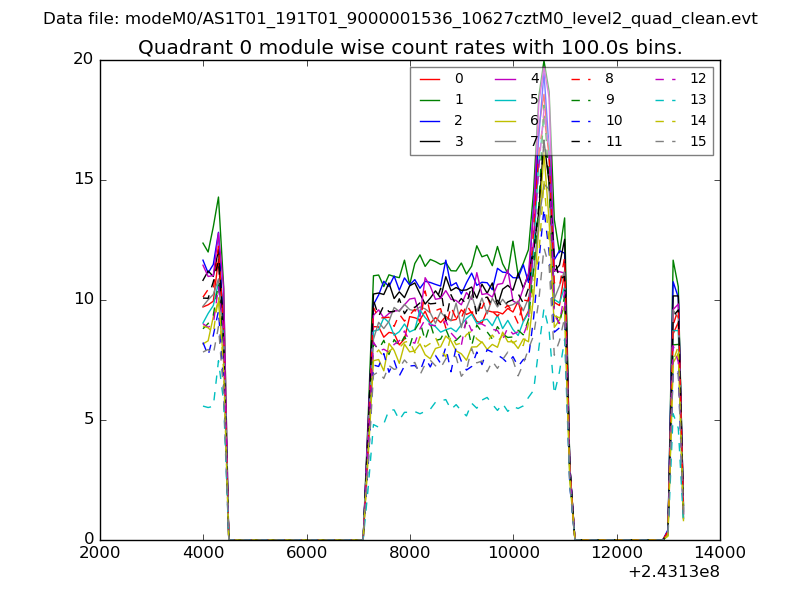
| Module-wise count rates for Quadrant A Data is divided into 100 sec bins |
 |
 |
| Module-wise count rates for Quadrant B Data is divided into 100 sec bins |
 |
 |
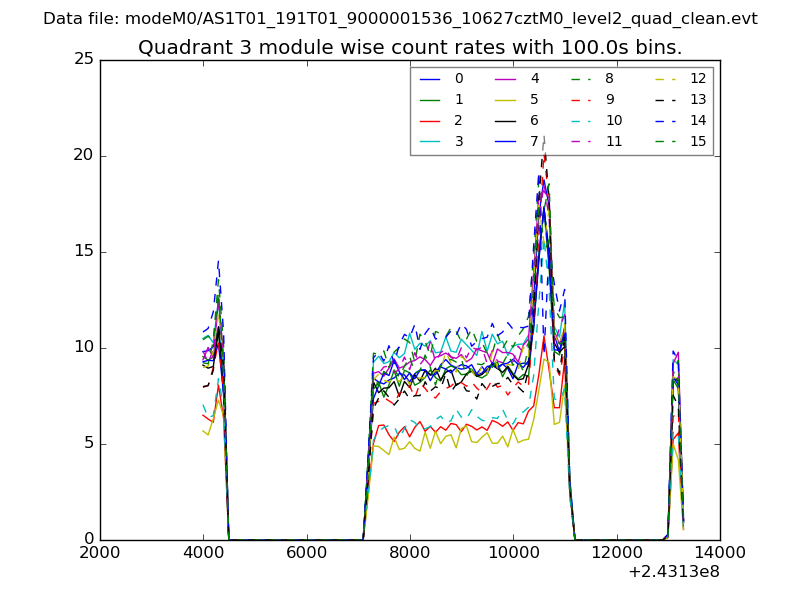
| Module-wise count rates for Quadrant C Data is divided into 100 sec bins |
 |
 |
| Module-wise count rates for Quadrant D Data is divided into 100 sec bins |
 |
 |
| Parameter | Plot |
|---|---|
| CZT HV Monitor |  |
| D_VDD | 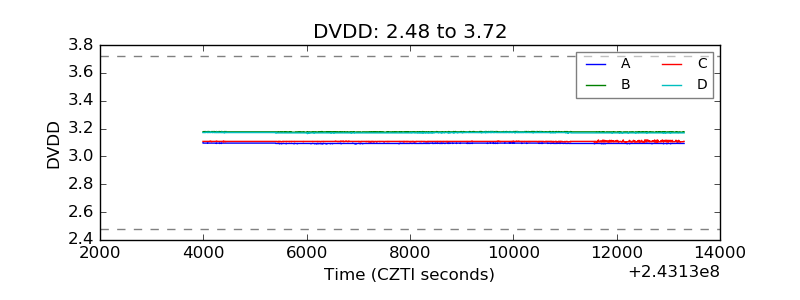 |
| Temperature 1 | 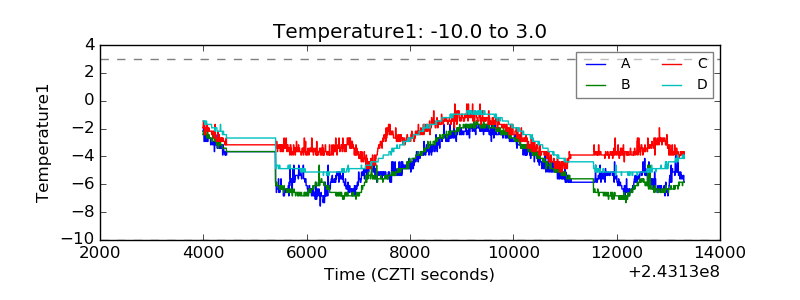 |
| Veto HV Monitor | 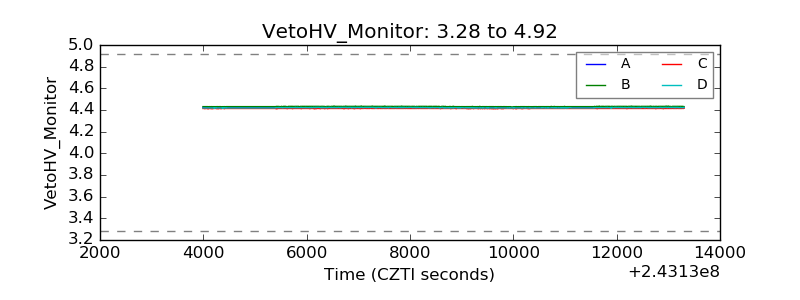 |
| Veto LLD |  |
| Alpha Counter | 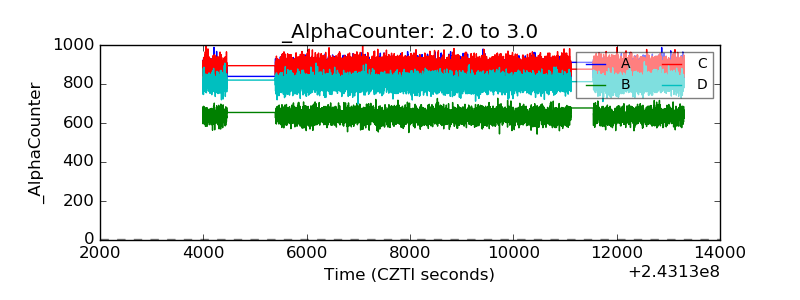 |
| _CPM_Rate | 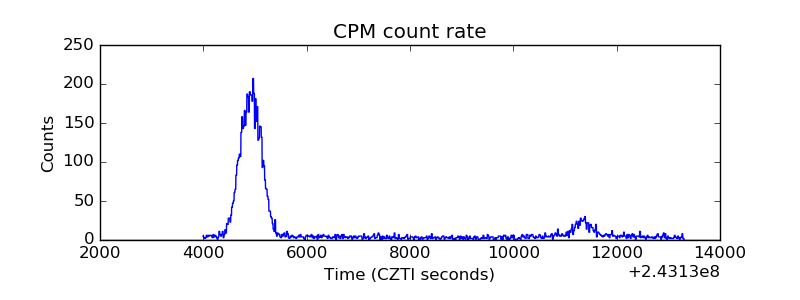 |
| CZT Counter | 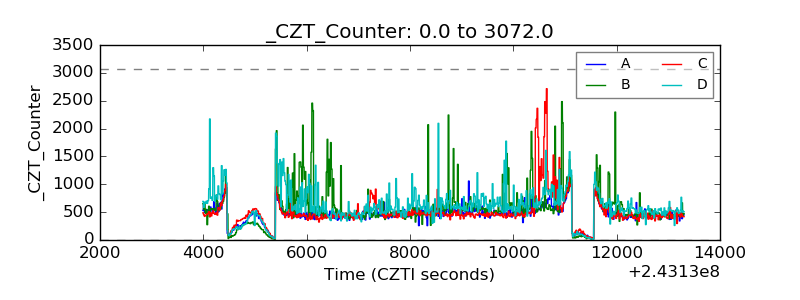 |
| +2.5 Volts monitor |  |
| +5 Volts monitor |  |
| _ROLL_ROT | 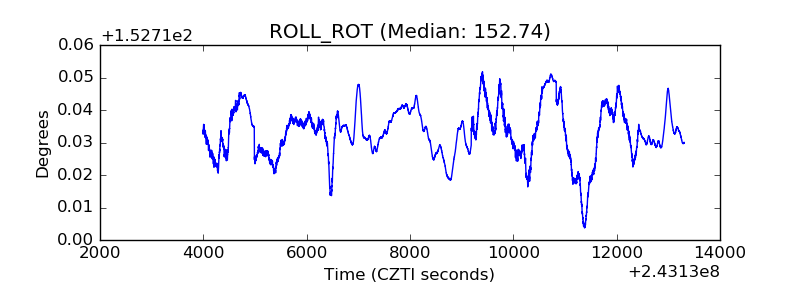 |
| _Roll_DEC | 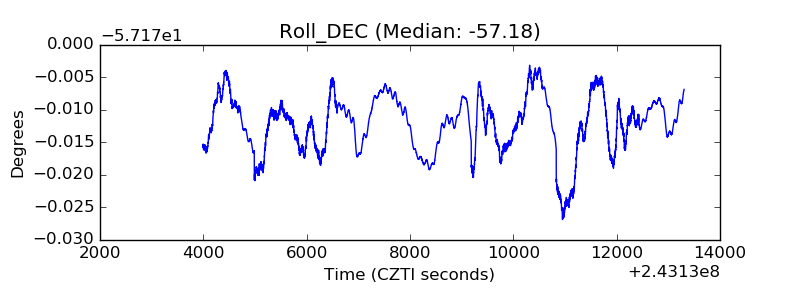 |
| _Roll_RA | 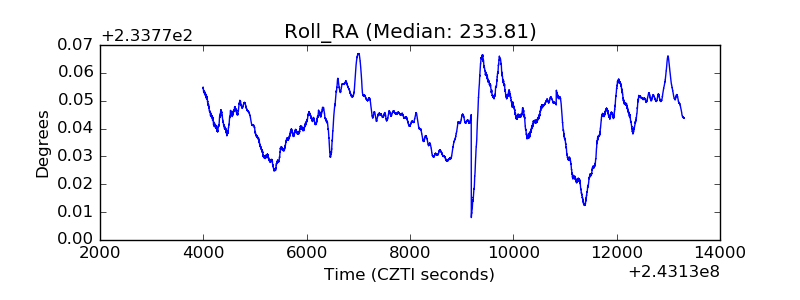 |
| Veto Counter | 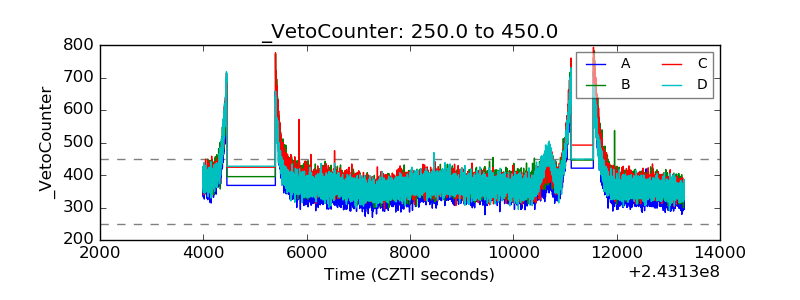 |