| Param | Original file | Final file |
|---|---|---|
| Filename | modeM0/AS1T01_191T01_9000001536_10628cztM0_level2.evt | modeM0/AS1T01_191T01_9000001536_10628cztM0_level2_quad_clean.evt |
| Size (bytes) | 646,761,600 | 103,072,320 |
| Size | 616.8 MB | 98.3 MB |
| Events in quadrant A | 4,043,998 | 657,773 |
| Events in quadrant B | 5,969,668 | 624,772 |
| Events in quadrant C | 3,859,610 | 658,847 |
| Events in quadrant D | 5,170,447 | 622,568 |
| Mode SS | |||
|---|---|---|---|
| Quadrant | BADHDUFLAG | Total packets | Discarded packets |
| A | 0 | 162 | 0 |
| B | 0 | 162 | 0 |
| C | 0 | 162 | 0 |
| D | 0 | 162 | 0 |
| Mode M9 | |||
|---|---|---|---|
| Quadrant | BADHDUFLAG | Total packets | Discarded packets |
| A | 0 | 4 | 0 |
| B | 0 | 4 | 0 |
| C | 0 | 4 | 0 |
| D | 0 | 4 | 0 |
| Mode M0 | |||
|---|---|---|---|
| Quadrant | BADHDUFLAG | Total packets | Discarded packets |
| A | 0 | 17275 | 2 |
| B | 0 | 22987 | 1 |
| C | 0 | 16859 | 1 |
| D | 0 | 20700 | 1 |
| Quadrant | Total seconds | Saturated seconds | Saturation percentage |
|---|---|---|---|
| A | 8020 | 302 | 3.765586% |
| B | 8020 | 970 | 12.094763% |
| C | 8020 | 236 | 2.942643% |
| D | 8020 | 256 | 3.192020% |
Noise dominated data is calculated using 1-second bins in cleaned event files. If a bin has >2000 counts, and if more than 50% of those come from <1% of pixels, then it is considered to be noise-dominated and hence unusable.
| Quadrant | # 1 sec bins | Bins with >0 counts | Bins with >2000 counts | High rate bins dominated by noise | Noise dominated (total time) | Noise dominated (detector-on time) | Marked lightcurve |
|---|---|---|---|---|---|---|---|
| A | 8450 | 8021 | 22 | 22 | 0.26% | 0.27% | 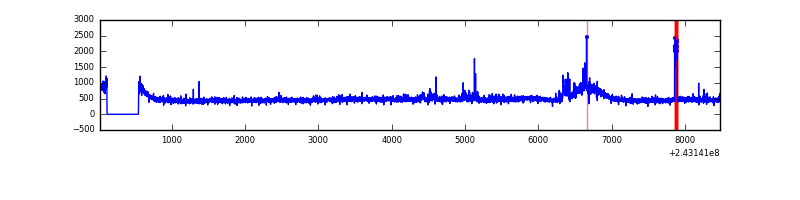 |
| B | 8450 | 8021 | 407 | 407 | 4.82% | 5.07% |  |
| C | 8450 | 8021 | 0 | 0 | 0.00% | 0.00% | 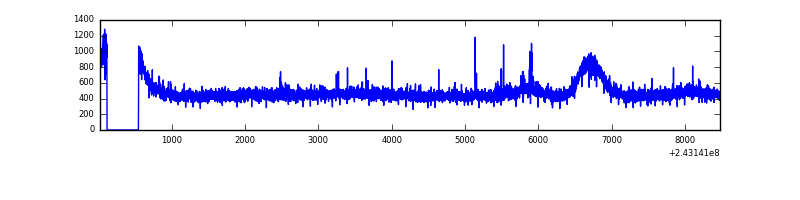 |
| D | 8450 | 8021 | 20 | 20 | 0.24% | 0.25% | 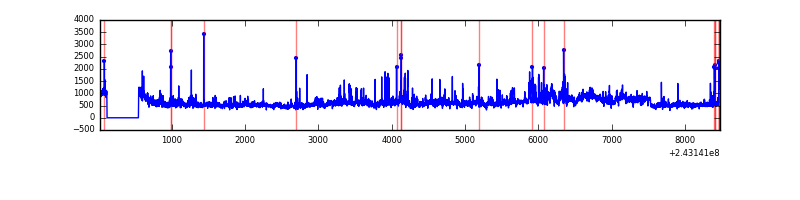 |
Top three noisy pixels from each quadrant. If the there are fewer than three noisy pixels in the level2.evt file, extra rows are filled as -1
| Pixel properties | Quadrant properties | ||||||
|---|---|---|---|---|---|---|---|
| Quadrant | DetID | PixID | Counts | Sigma | Mean | Median | Sigma |
| A | 15 | 239 | 141686 | 685.2 | 986 | 967 | 205.4 |
| A | 13 | 251 | 40523 | 192.61 | 986 | 967 | 205.4 |
| A | 1 | 162 | 35966 | 170.42 | 986 | 967 | 205.4 |
| B | 4 | 239 | 1983360 | 10662.84 | 959 | 937 | 185.9 |
| B | 0 | 219 | 167341 | 895.04 | 959 | 937 | 185.9 |
| B | 0 | 214 | 60946 | 322.77 | 959 | 937 | 185.9 |
| C | 4 | 254 | 53432 | 233.26 | 966 | 974 | 224.9 |
| C | 8 | 128 | 15117 | 62.89 | 966 | 974 | 224.9 |
| C | 8 | 112 | 8776 | 34.69 | 966 | 974 | 224.9 |
| D | 1 | 52 | 557223 | 2411.99 | 954 | 926 | 230.6 |
| D | 2 | 16 | 545497 | 2361.15 | 954 | 926 | 230.6 |
| D | 8 | 195 | 281438 | 1216.24 | 954 | 926 | 230.6 |
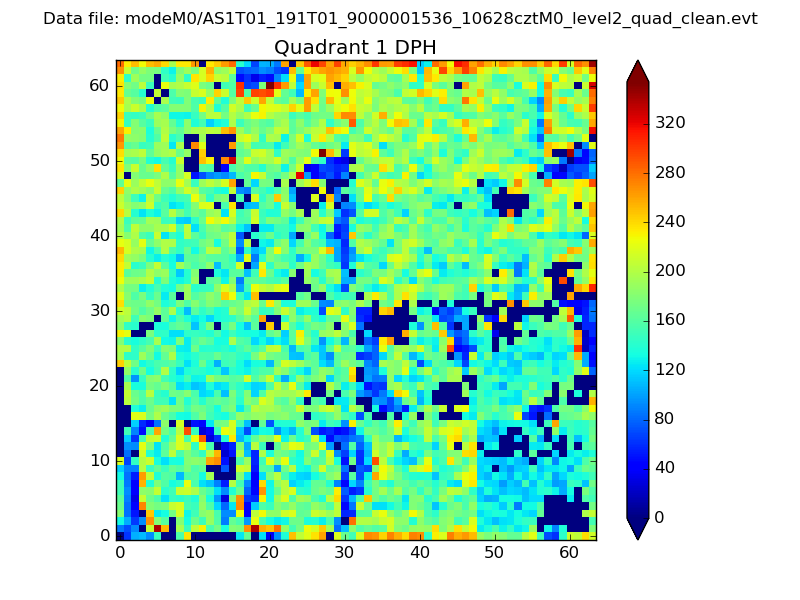
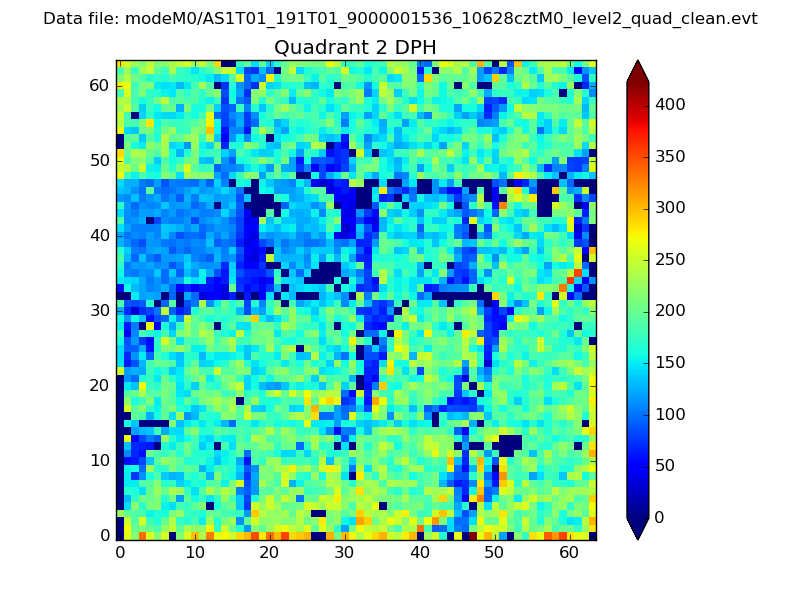
Histogram calculated using DETX and DETY for each event in the final _common_clean file
| Quadrant A | 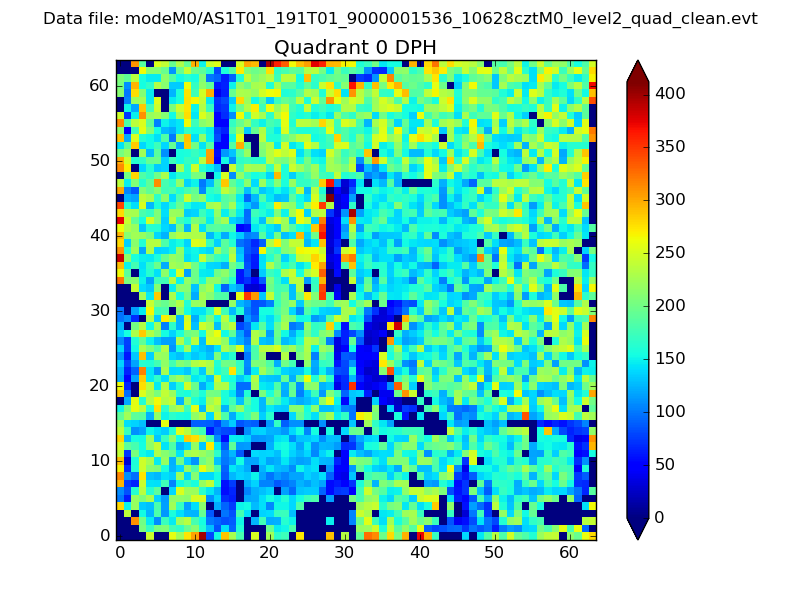 |
 |
Quadrant B |
|---|---|---|---|
| Quadrant D |  |
 |
Quadrant C |
| Plot type | Count rate plots | Images |
|---|---|---|
| Comparison with Poisson distribution Blue bars denote a histogram of data divided into 1 sec bins. Red curve is a Poisson curve with rate = median count rate of data. |
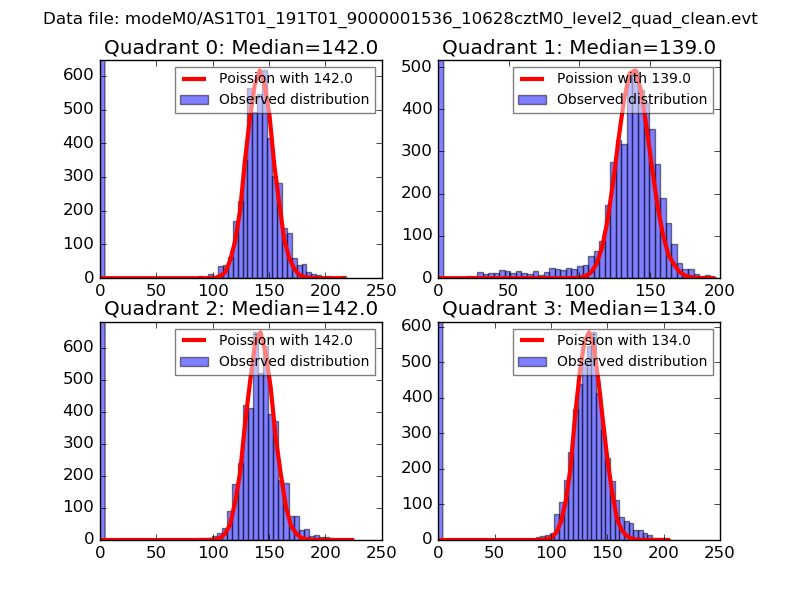 |
 |
| Quadrant-wise count rates Data is divided into 100 sec bins |
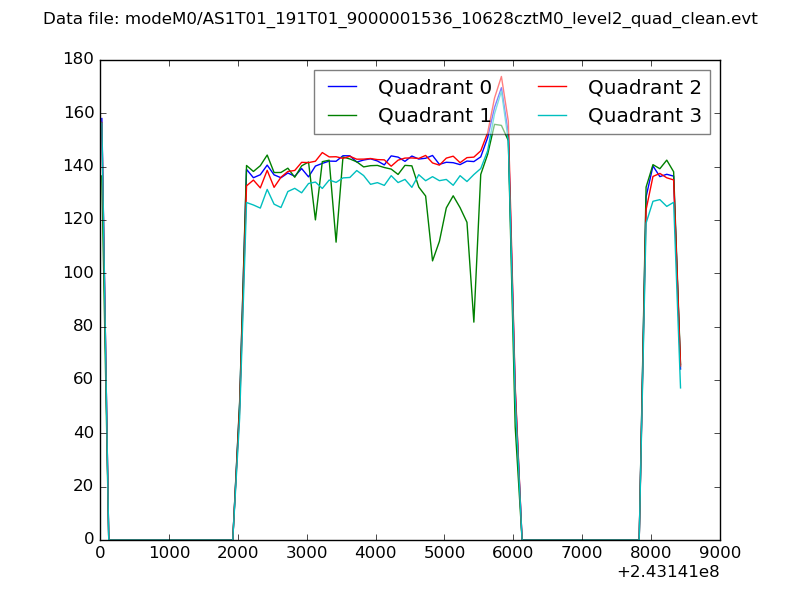 |
|
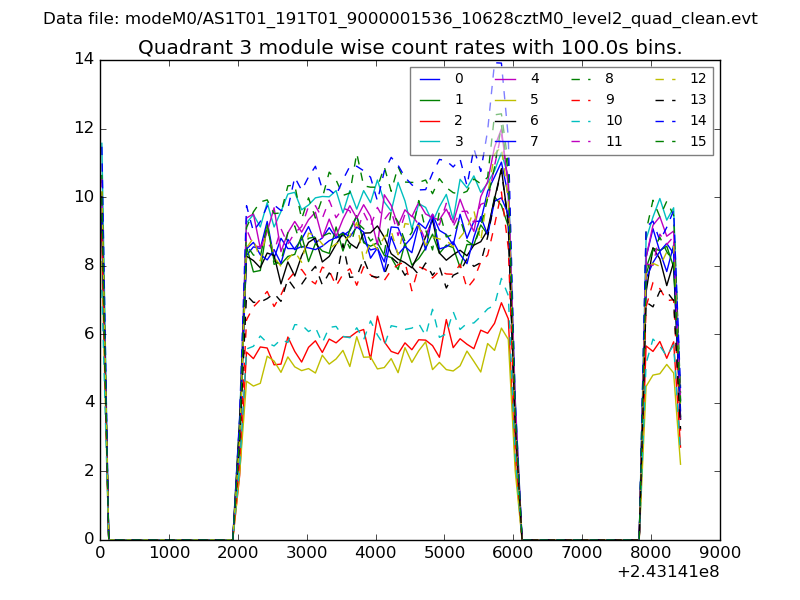
| Module-wise count rates for Quadrant A Data is divided into 100 sec bins |
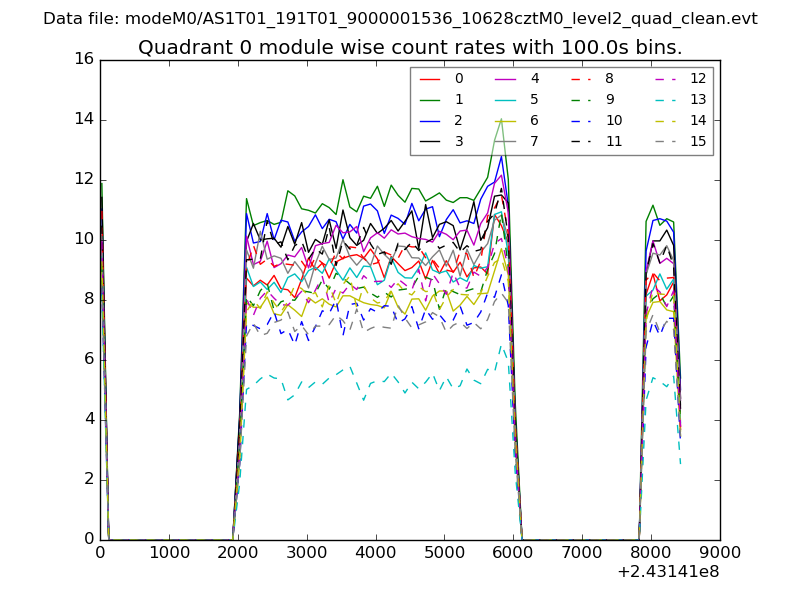 |
 |
| Module-wise count rates for Quadrant B Data is divided into 100 sec bins |
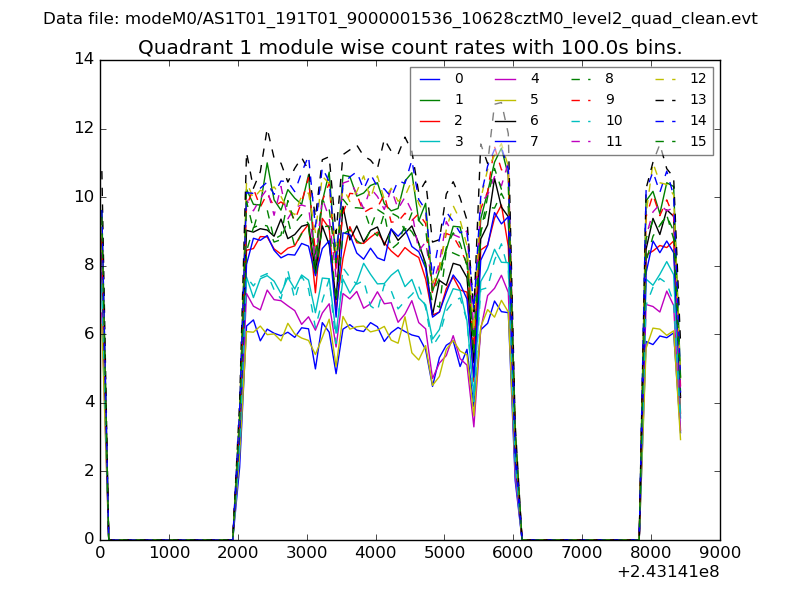 |
 |
| Module-wise count rates for Quadrant C Data is divided into 100 sec bins |
 |
 |
| Module-wise count rates for Quadrant D Data is divided into 100 sec bins |
 |
 |
| Parameter | Plot |
|---|---|
| CZT HV Monitor | 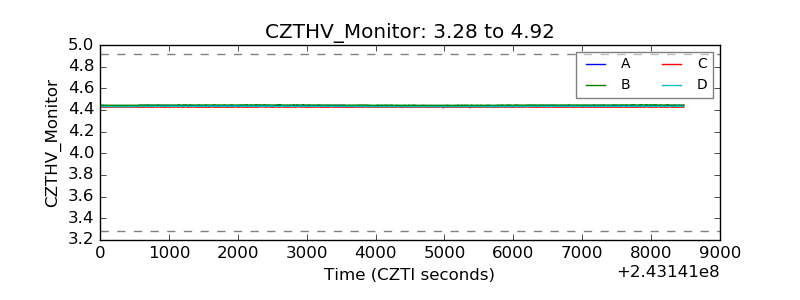 |
| D_VDD | 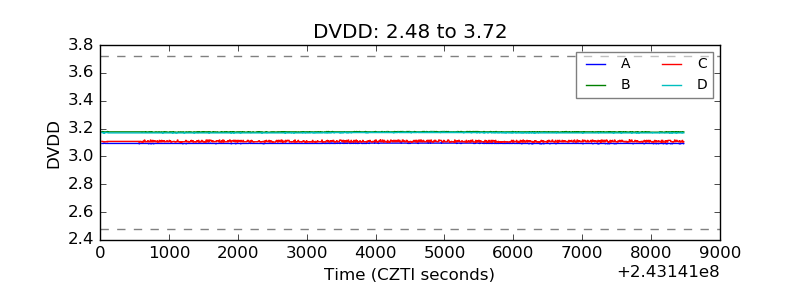 |
| Temperature 1 | 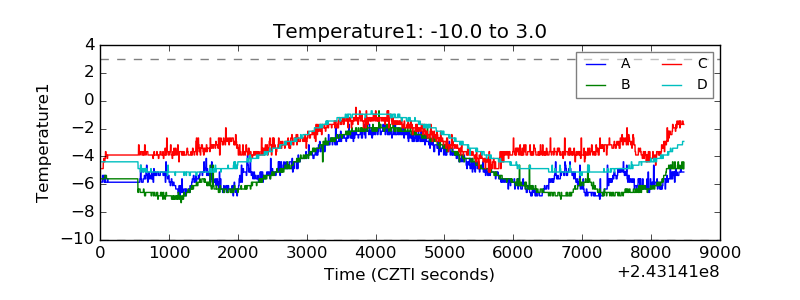 |
| Veto HV Monitor | 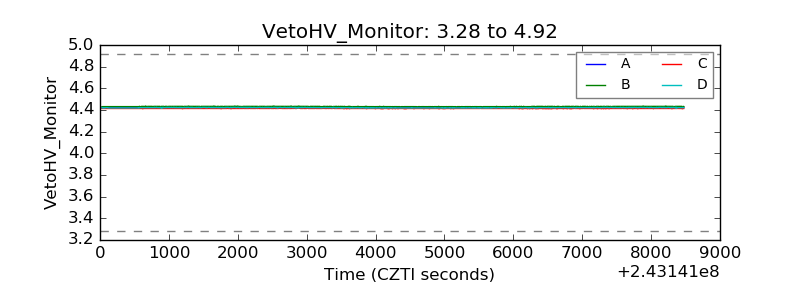 |
| Veto LLD | 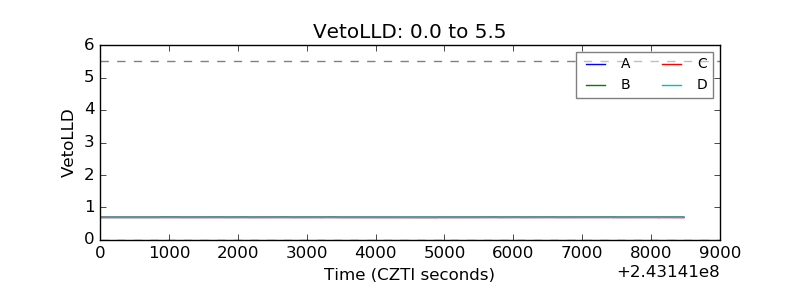 |
| Alpha Counter | 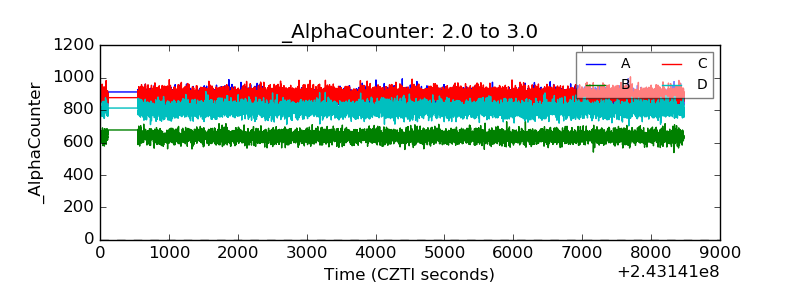 |
| _CPM_Rate | 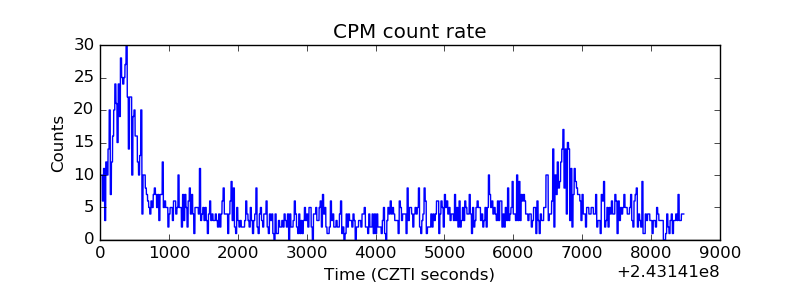 |
| CZT Counter | 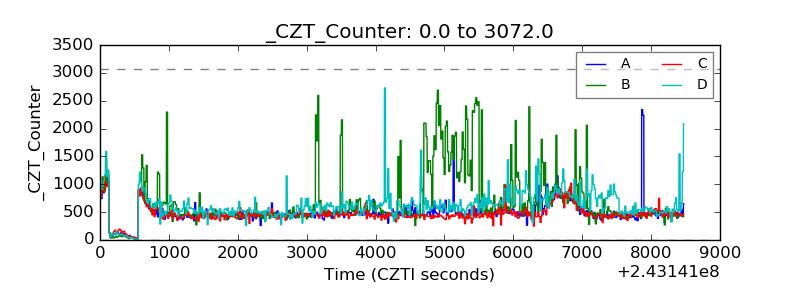 |
| +2.5 Volts monitor |  |
| +5 Volts monitor |  |
| _ROLL_ROT | 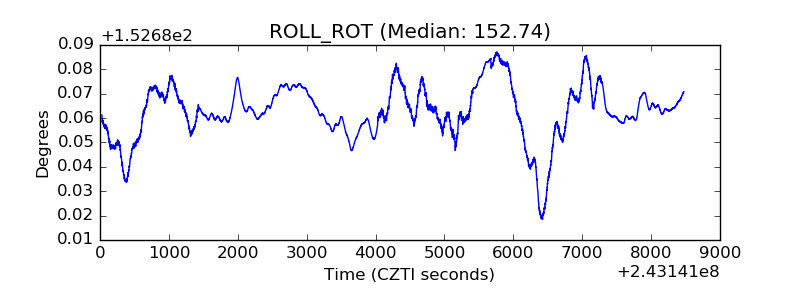 |
| _Roll_DEC | 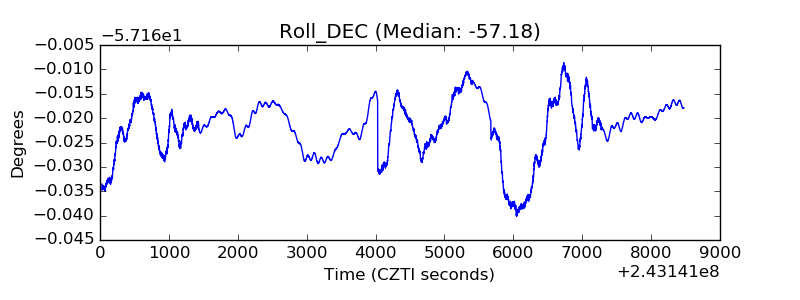 |
| _Roll_RA | 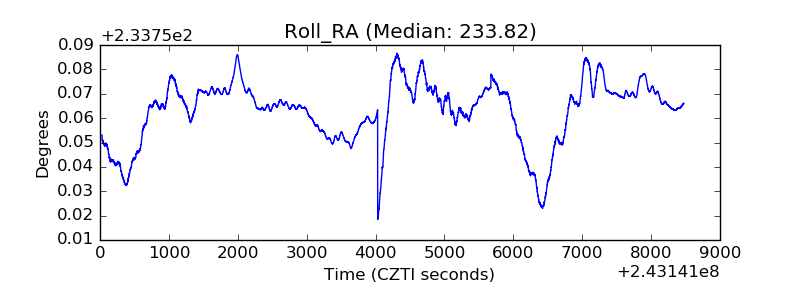 |
| Veto Counter | 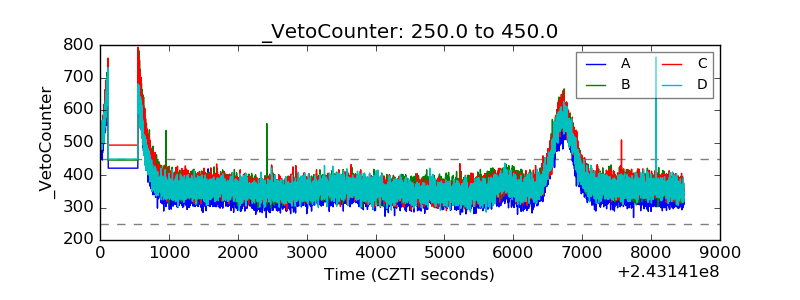 |