| Param | Original file | Final file |
|---|---|---|
| Filename | modeM0/AS1T01_191T01_9000001536_10629cztM0_level2.evt | modeM0/AS1T01_191T01_9000001536_10629cztM0_level2_quad_clean.evt |
| Size (bytes) | 537,733,440 | 104,829,120 |
| Size | 512.8 MB | 100.0 MB |
| Events in quadrant A | 3,305,822 | 690,969 |
| Events in quadrant B | 4,123,935 | 688,412 |
| Events in quadrant C | 3,696,148 | 687,836 |
| Events in quadrant D | 4,701,366 | 636,921 |
| Mode SS | |||
|---|---|---|---|
| Quadrant | BADHDUFLAG | Total packets | Discarded packets |
| A | 0 | 136 | 0 |
| B | 0 | 136 | 0 |
| C | 0 | 136 | 0 |
| D | 0 | 136 | 0 |
| Mode M0 | |||
|---|---|---|---|
| Quadrant | BADHDUFLAG | Total packets | Discarded packets |
| A | 0 | 14156 | 2 |
| B | 0 | 16565 | 1 |
| C | 0 | 15518 | 1 |
| D | 0 | 18388 | 1 |
| Quadrant | Total seconds | Saturated seconds | Saturation percentage |
|---|---|---|---|
| A | 6747 | 196 | 2.904995% |
| B | 6747 | 315 | 4.668742% |
| C | 6747 | 216 | 3.201423% |
| D | 6747 | 313 | 4.639099% |
Noise dominated data is calculated using 1-second bins in cleaned event files. If a bin has >2000 counts, and if more than 50% of those come from <1% of pixels, then it is considered to be noise-dominated and hence unusable.
| Quadrant | # 1 sec bins | Bins with >0 counts | Bins with >2000 counts | High rate bins dominated by noise | Noise dominated (total time) | Noise dominated (detector-on time) | Marked lightcurve |
|---|---|---|---|---|---|---|---|
| A | 6812 | 6748 | 1 | 1 | 0.01% | 0.01% | 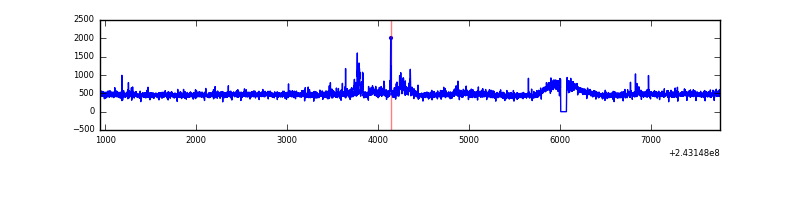 |
| B | 6812 | 6748 | 68 | 68 | 1.00% | 1.01% | 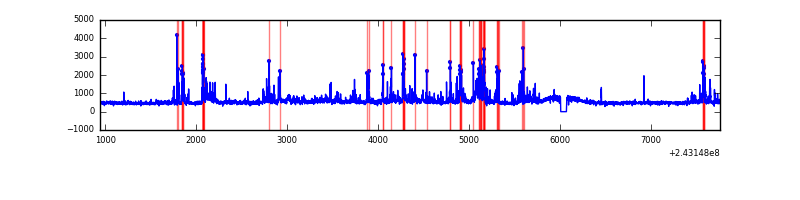 |
| C | 6812 | 6748 | 37 | 37 | 0.54% | 0.55% | 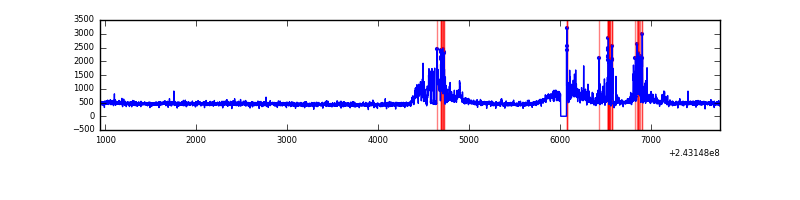 |
| D | 6812 | 6748 | 138 | 138 | 2.03% | 2.05% | 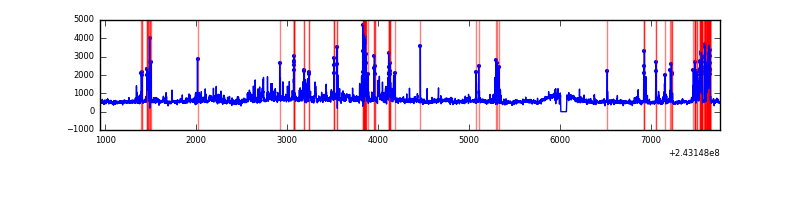 |
Top three noisy pixels from each quadrant. If the there are fewer than three noisy pixels in the level2.evt file, extra rows are filled as -1
| Pixel properties | Quadrant properties | ||||||
|---|---|---|---|---|---|---|---|
| Quadrant | DetID | PixID | Counts | Sigma | Mean | Median | Sigma |
| A | 13 | 251 | 104927 | 607.65 | 815 | 800 | 171.4 |
| A | 1 | 162 | 37370 | 213.41 | 815 | 800 | 171.4 |
| A | 1 | 178 | 12339 | 67.34 | 815 | 800 | 171.4 |
| B | 4 | 239 | 611407 | 3883.95 | 810 | 792 | 157.2 |
| B | 0 | 219 | 120328 | 760.34 | 810 | 792 | 157.2 |
| B | 0 | 85 | 86296 | 543.87 | 810 | 792 | 157.2 |
| C | 4 | 254 | 427334 | 2298.46 | 793 | 800 | 185.6 |
| C | 15 | 48 | 148235 | 794.48 | 793 | 800 | 185.6 |
| C | 8 | 128 | 8241 | 40.1 | 793 | 800 | 185.6 |
| D | 2 | 16 | 470754 | 2443.98 | 782 | 762 | 192.3 |
| D | 8 | 195 | 313996 | 1628.83 | 782 | 762 | 192.3 |
| D | 1 | 52 | 288537 | 1496.44 | 782 | 762 | 192.3 |
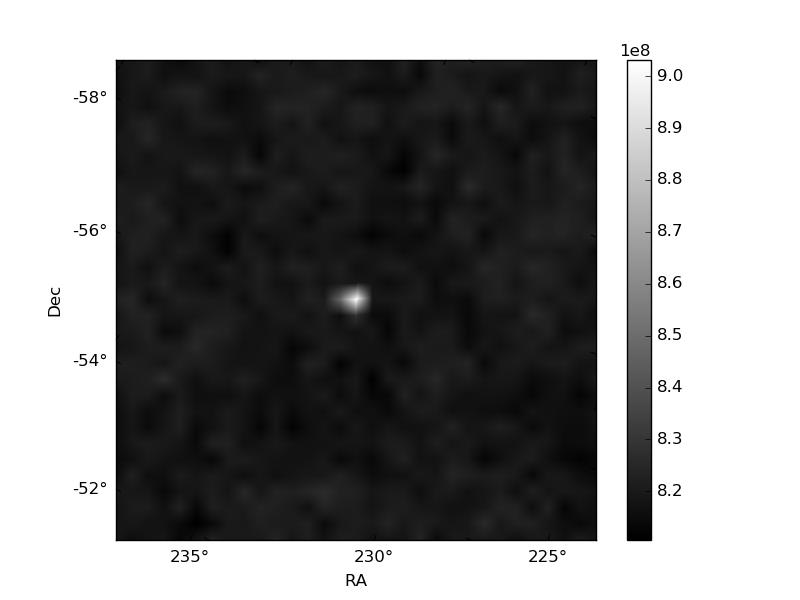
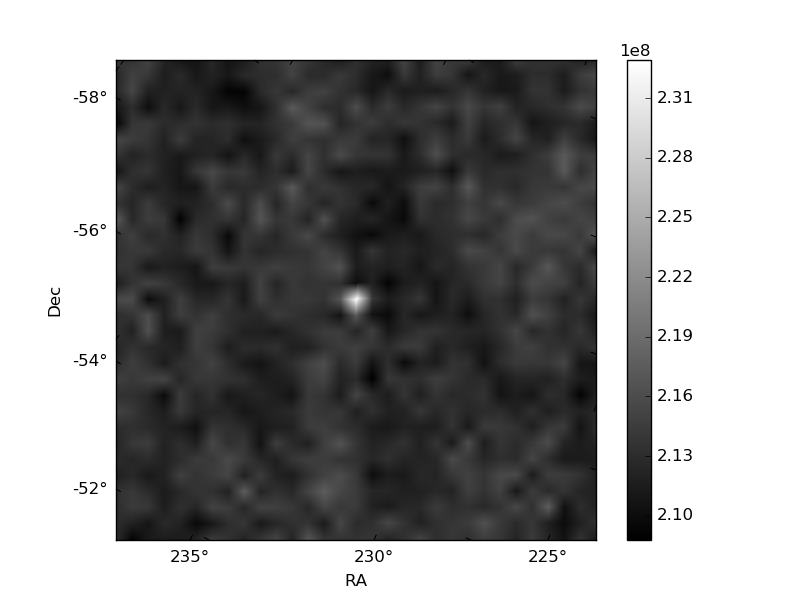
Histogram calculated using DETX and DETY for each event in the final _common_clean file
| Quadrant A | 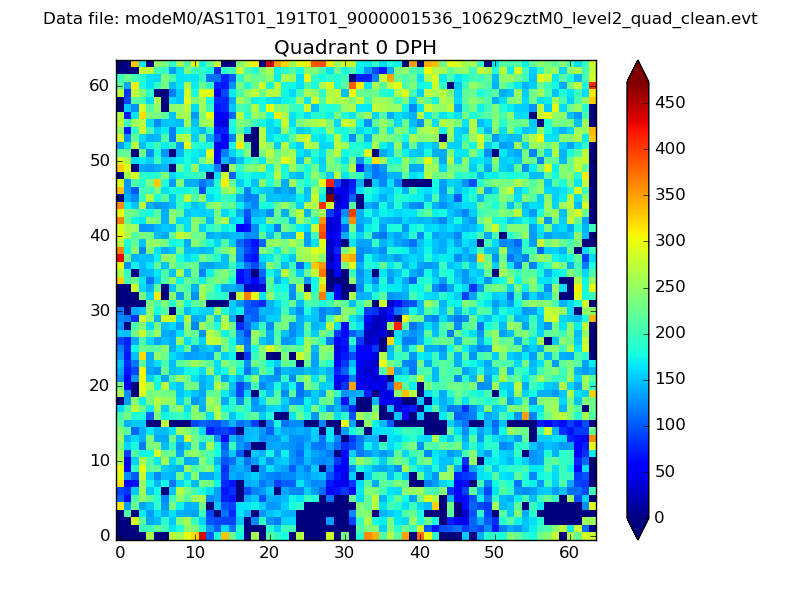 |
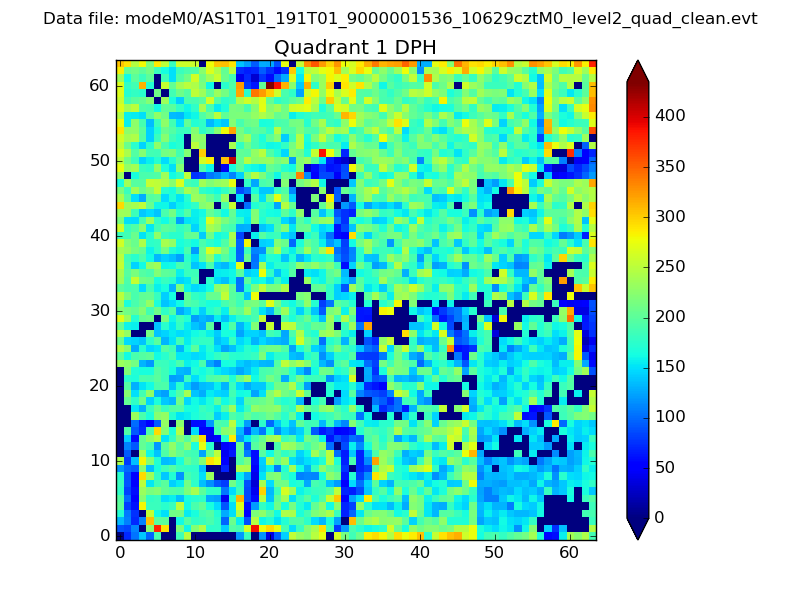 |
Quadrant B |
|---|---|---|---|
| Quadrant D | 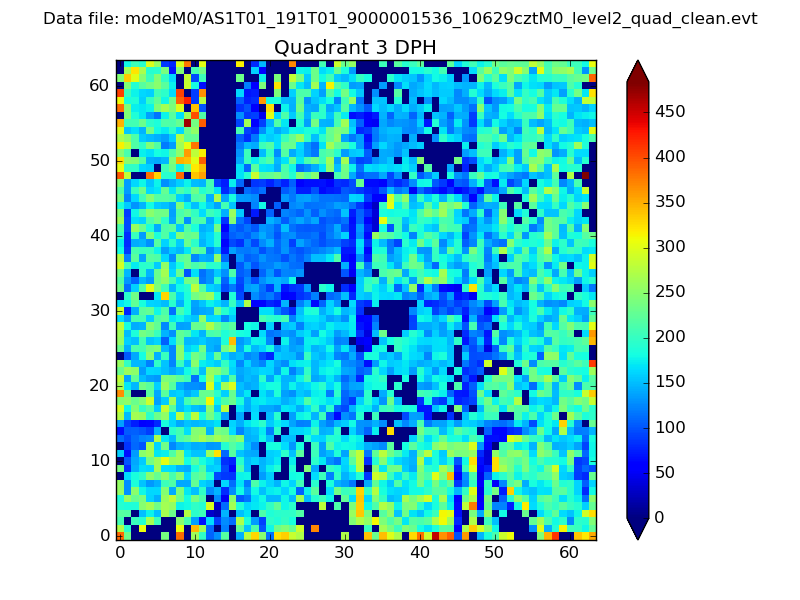 |
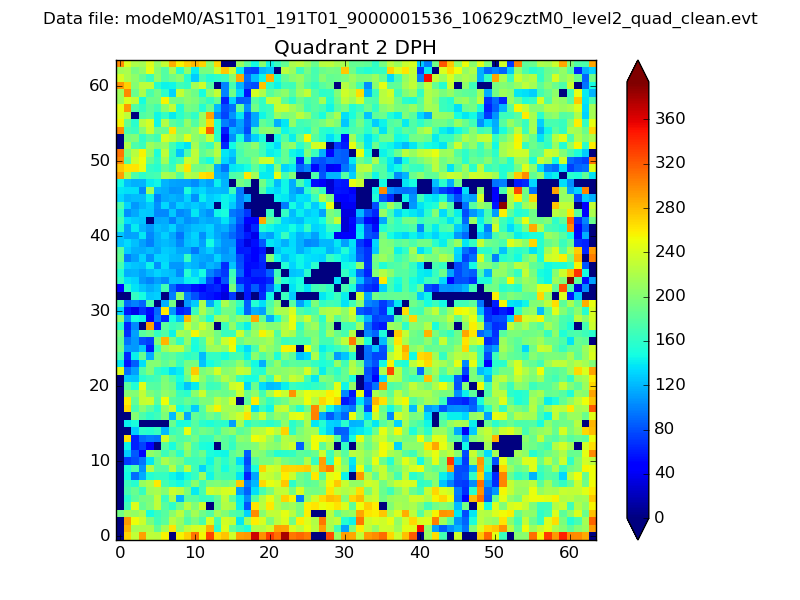 |
Quadrant C |
| Plot type | Count rate plots | Images |
|---|---|---|
| Comparison with Poisson distribution Blue bars denote a histogram of data divided into 1 sec bins. Red curve is a Poisson curve with rate = median count rate of data. |
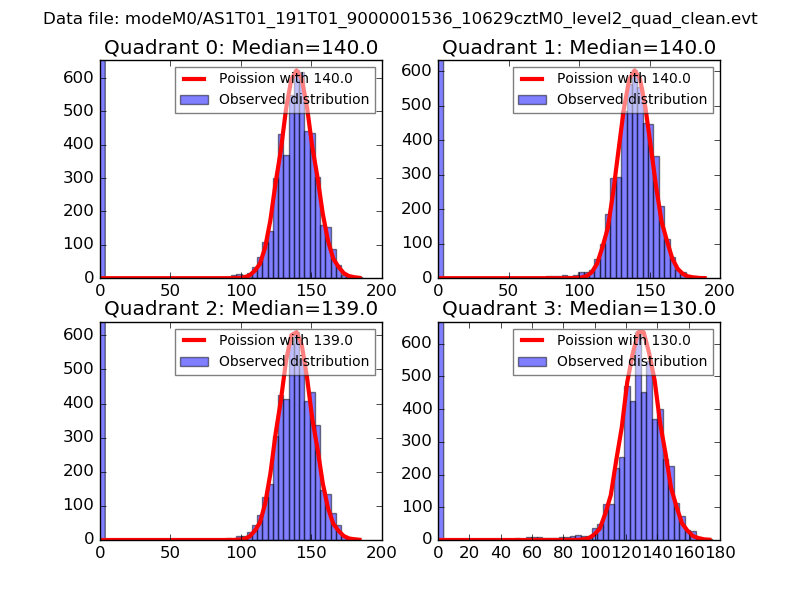 |
 |
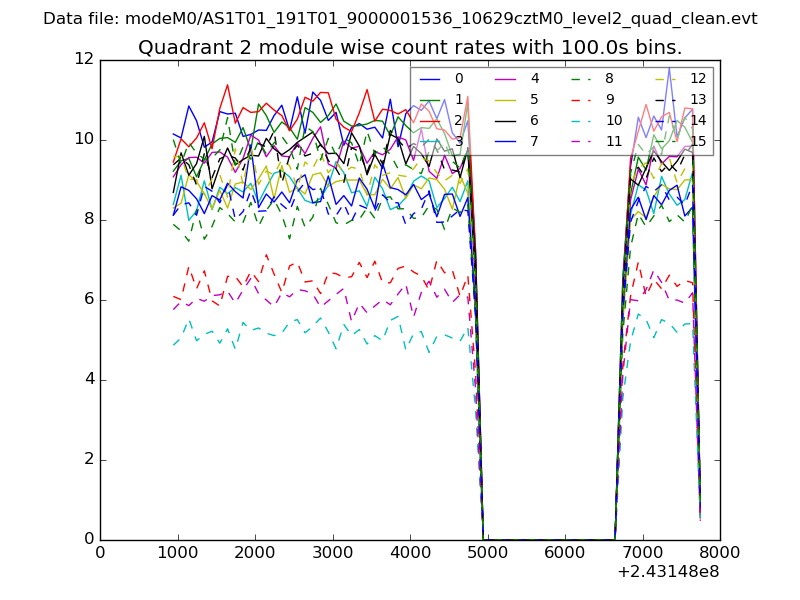
| Quadrant-wise count rates Data is divided into 100 sec bins |
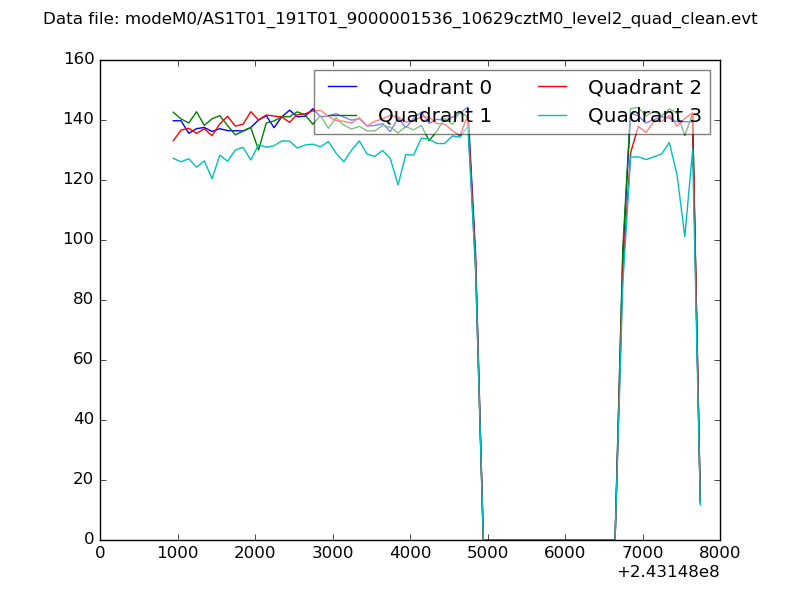 |
|
| Module-wise count rates for Quadrant A Data is divided into 100 sec bins |
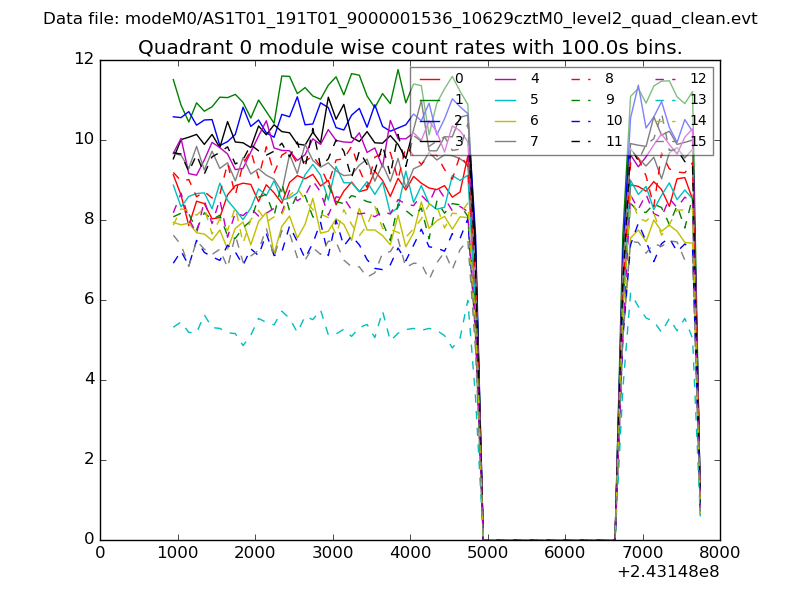 |
 |
| Module-wise count rates for Quadrant B Data is divided into 100 sec bins |
 |
 |
| Module-wise count rates for Quadrant C Data is divided into 100 sec bins |
 |
 |
| Module-wise count rates for Quadrant D Data is divided into 100 sec bins |
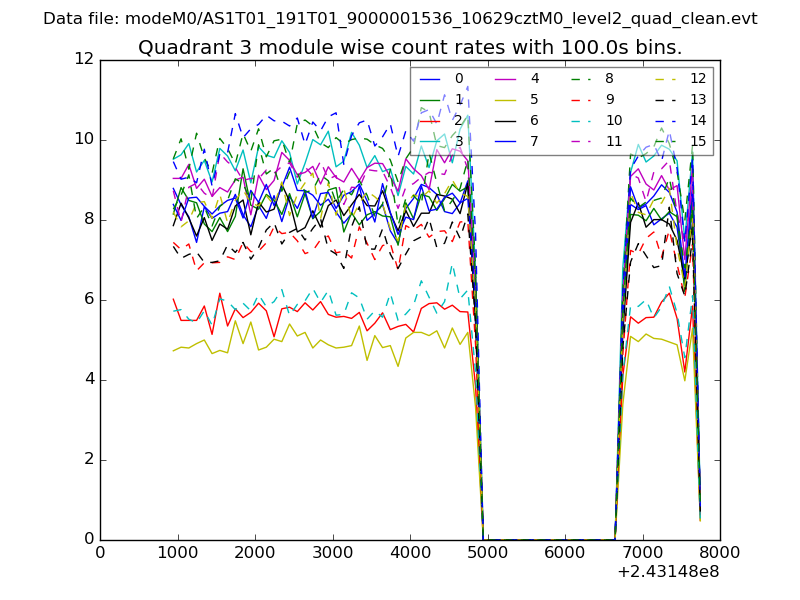 |
 |
| Parameter | Plot |
|---|---|
| CZT HV Monitor | 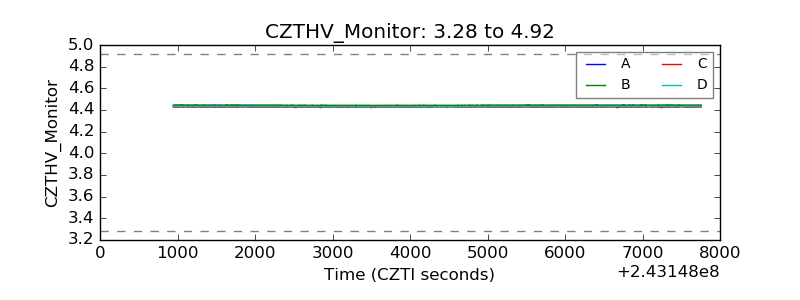 |
| D_VDD |  |
| Temperature 1 | 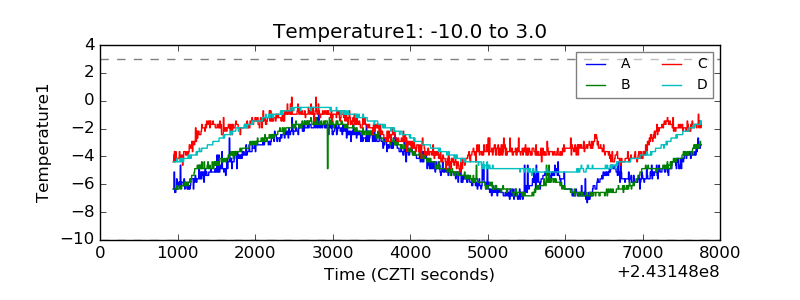 |
| Veto HV Monitor | 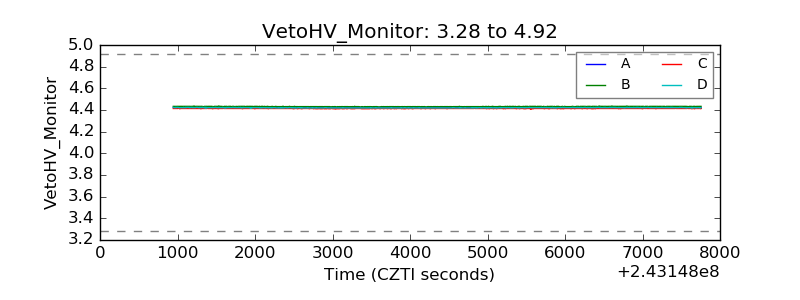 |
| Veto LLD |  |
| Alpha Counter | 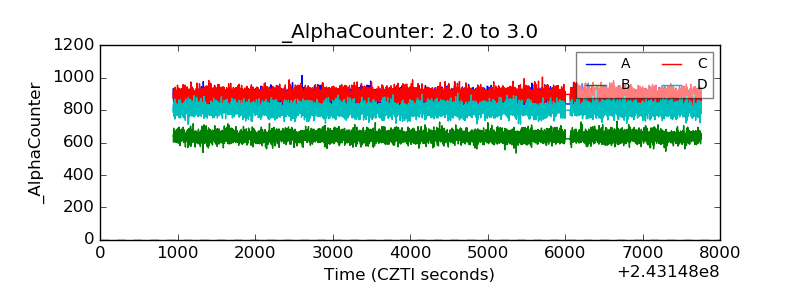 |
| _CPM_Rate | 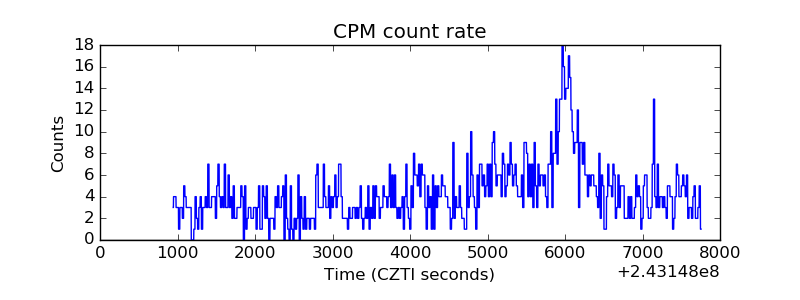 |
| CZT Counter | 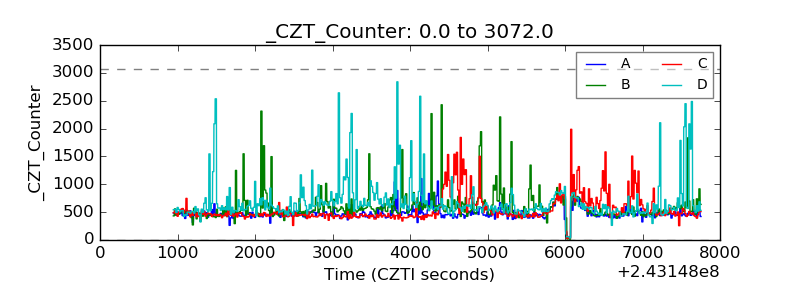 |
| +2.5 Volts monitor |  |
| +5 Volts monitor |  |
| _ROLL_ROT | 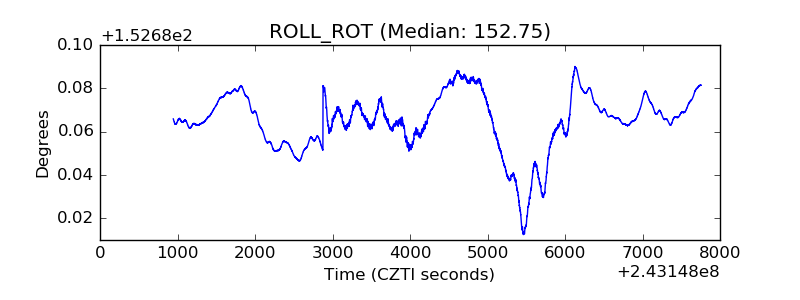 |
| _Roll_DEC | 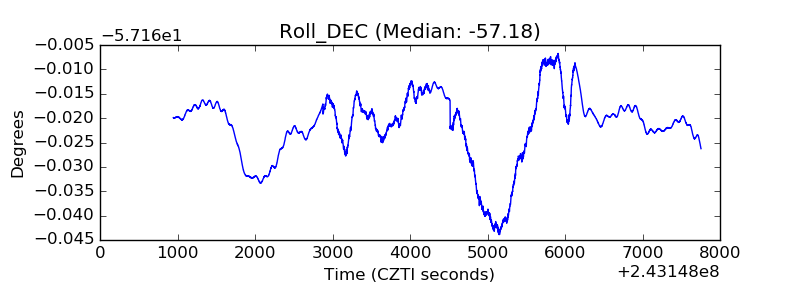 |
| _Roll_RA | 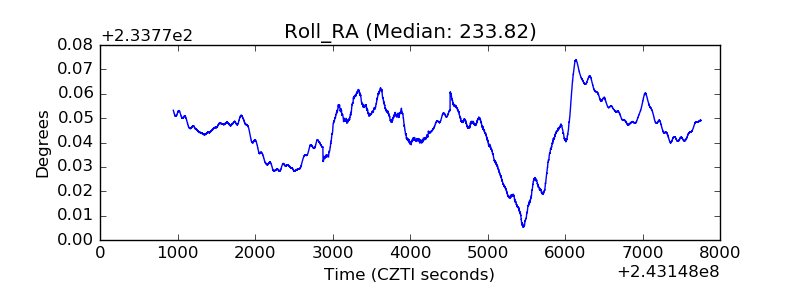 |
| Veto Counter | 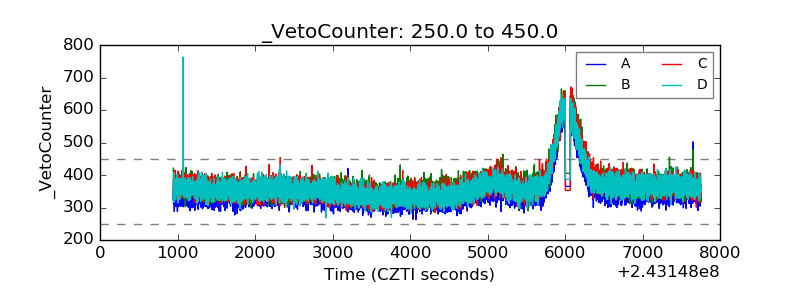 |