| Param | Original file | Final file |
|---|---|---|
| Filename | modeM0/AS1T01_191T01_9000001536_10632cztM0_level2.evt | modeM0/AS1T01_191T01_9000001536_10632cztM0_level2_quad_clean.evt |
| Size (bytes) | 1,611,653,760 | 274,253,760 |
| Size | 1.5 GB | 261.5 MB |
| Events in quadrant A | 8,862,005 | 1,806,528 |
| Events in quadrant B | 11,246,730 | 1,790,261 |
| Events in quadrant C | 9,006,902 | 1,807,573 |
| Events in quadrant D | 18,485,339 | 1,665,249 |
| Mode SS | |||
|---|---|---|---|
| Quadrant | BADHDUFLAG | Total packets | Discarded packets |
| A | 0 | 366 | 0 |
| B | 0 | 366 | 0 |
| C | 0 | 366 | 0 |
| D | 0 | 366 | 0 |
| Mode M9 | |||
|---|---|---|---|
| Quadrant | BADHDUFLAG | Total packets | Discarded packets |
| A | 0 | 17 | 0 |
| B | 0 | 17 | 0 |
| C | 0 | 17 | 0 |
| D | 0 | 17 | 0 |
| Mode M0 | |||
|---|---|---|---|
| Quadrant | BADHDUFLAG | Total packets | Discarded packets |
| A | 0 | 37722 | 4 |
| B | 0 | 44674 | 3 |
| C | 0 | 38994 | 3 |
| D | 0 | 67558 | 3 |
| Quadrant | Total seconds | Saturated seconds | Saturation percentage |
|---|---|---|---|
| A | 17948 | 207 | 1.153332% |
| B | 17948 | 839 | 4.674616% |
| C | 17948 | 354 | 1.972365% |
| D | 17948 | 693 | 3.861154% |
Noise dominated data is calculated using 1-second bins in cleaned event files. If a bin has >2000 counts, and if more than 50% of those come from <1% of pixels, then it is considered to be noise-dominated and hence unusable.
| Quadrant | # 1 sec bins | Bins with >0 counts | Bins with >2000 counts | High rate bins dominated by noise | Noise dominated (total time) | Noise dominated (detector-on time) | Marked lightcurve |
|---|---|---|---|---|---|---|---|
| A | 19698 | 17951 | 5 | 5 | 0.03% | 0.03% | 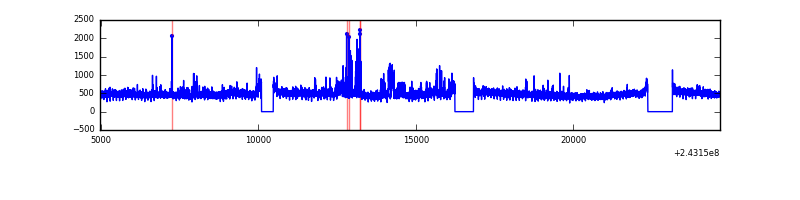 |
| B | 19698 | 17951 | 407 | 407 | 2.07% | 2.27% | 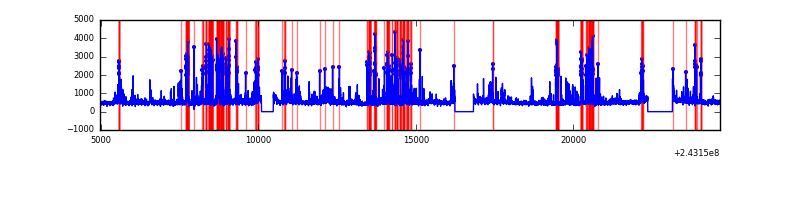 |
| C | 19698 | 17951 | 189 | 189 | 0.96% | 1.05% | 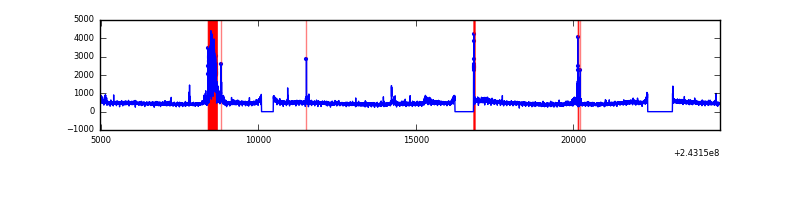 |
| D | 19698 | 17951 | 333 | 333 | 1.69% | 1.86% | 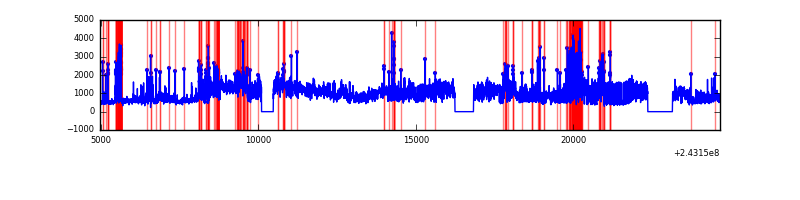 |
Top three noisy pixels from each quadrant. If the there are fewer than three noisy pixels in the level2.evt file, extra rows are filled as -1
| Pixel properties | Quadrant properties | ||||||
|---|---|---|---|---|---|---|---|
| Quadrant | DetID | PixID | Counts | Sigma | Mean | Median | Sigma |
| A | 13 | 251 | 490096 | 1096.69 | 2143 | 2103 | 445.0 |
| A | 1 | 162 | 63832 | 138.73 | 2143 | 2103 | 445.0 |
| A | 1 | 178 | 22556 | 45.96 | 2143 | 2103 | 445.0 |
| B | 4 | 239 | 2487025 | 6115.11 | 2115 | 2068 | 406.4 |
| B | 0 | 219 | 144515 | 350.54 | 2115 | 2068 | 406.4 |
| B | 0 | 214 | 130421 | 315.86 | 2115 | 2068 | 406.4 |
| C | 4 | 254 | 894029 | 1853.54 | 2071 | 2094 | 481.2 |
| C | 14 | 234 | 18176 | 33.42 | 2071 | 2094 | 481.2 |
| C | 13 | 61 | 15320 | 27.49 | 2071 | 2094 | 481.2 |
| D | 1 | 20 | 7170608 | 14316.94 | 2043 | 1992 | 500.7 |
| D | 1 | 52 | 1238080 | 2468.68 | 2043 | 1992 | 500.7 |
| D | 2 | 16 | 1000803 | 1994.79 | 2043 | 1992 | 500.7 |
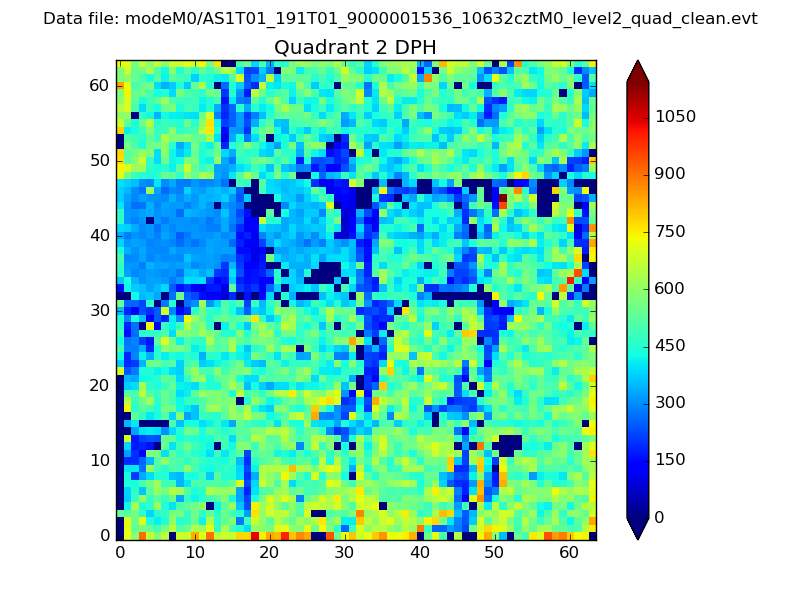
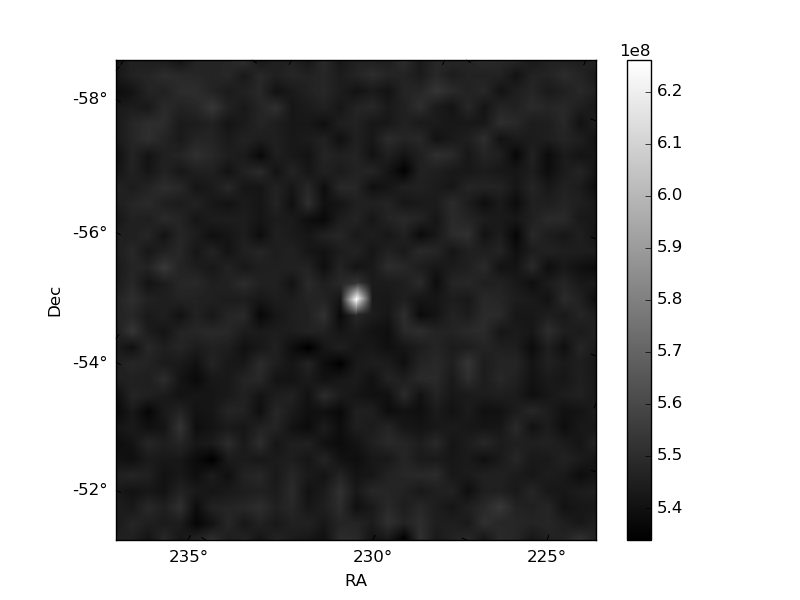
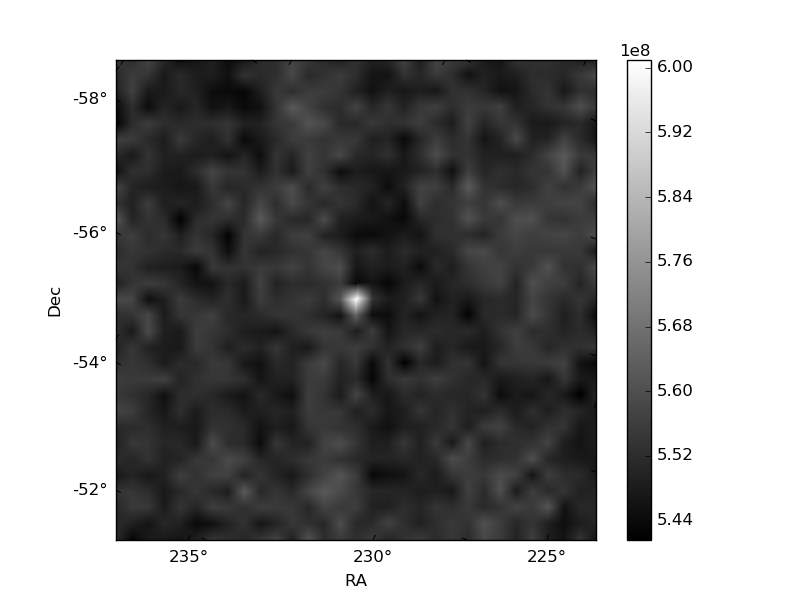
Histogram calculated using DETX and DETY for each event in the final _common_clean file
| Quadrant A |  |
 |
Quadrant B |
|---|---|---|---|
| Quadrant D | 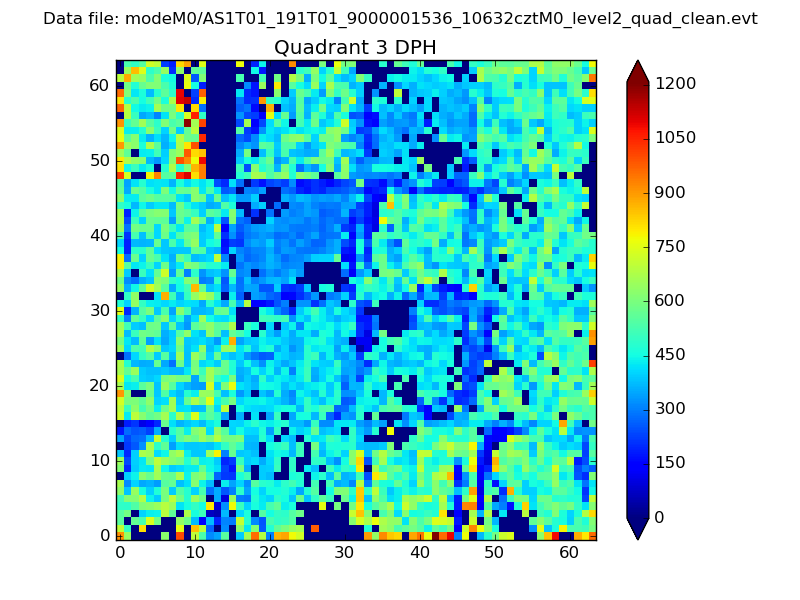 |
 |
Quadrant C |
| Plot type | Count rate plots | Images |
|---|---|---|
| Comparison with Poisson distribution Blue bars denote a histogram of data divided into 1 sec bins. Red curve is a Poisson curve with rate = median count rate of data. |
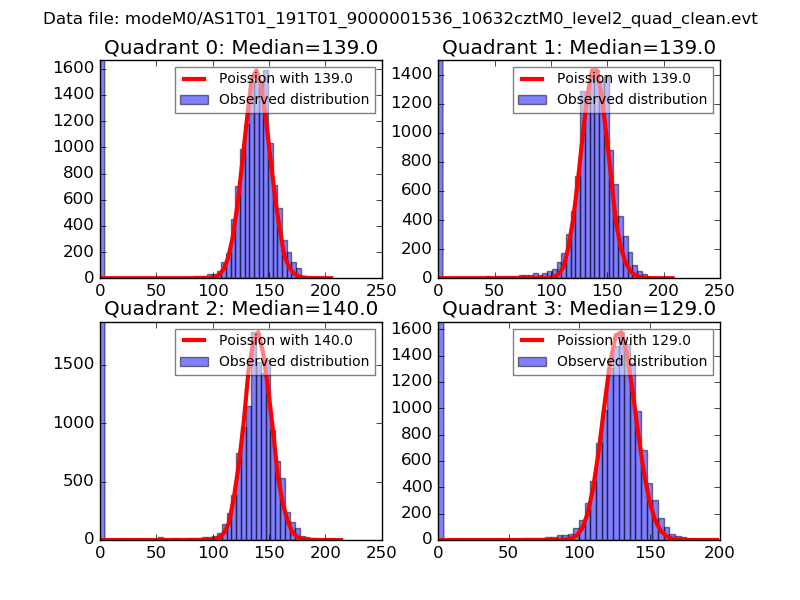 |
 |
| Quadrant-wise count rates Data is divided into 100 sec bins |
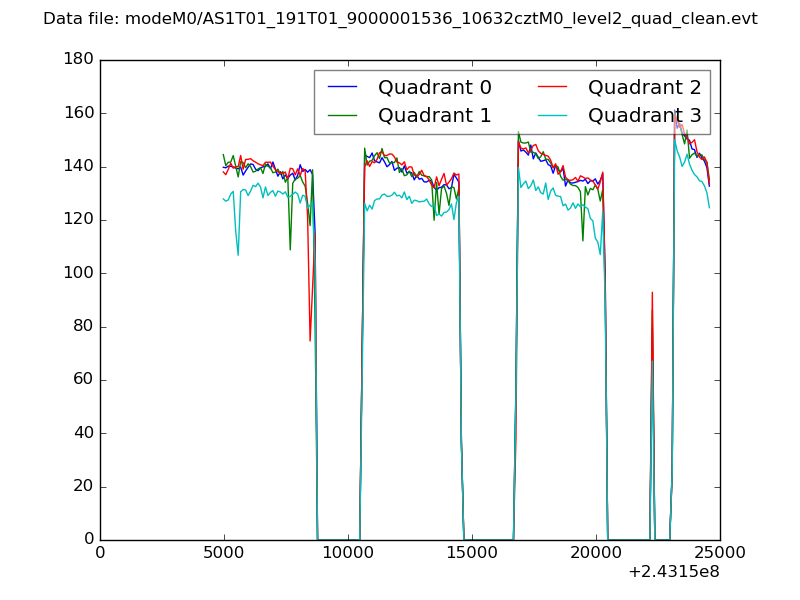 |
|
| Module-wise count rates for Quadrant A Data is divided into 100 sec bins |
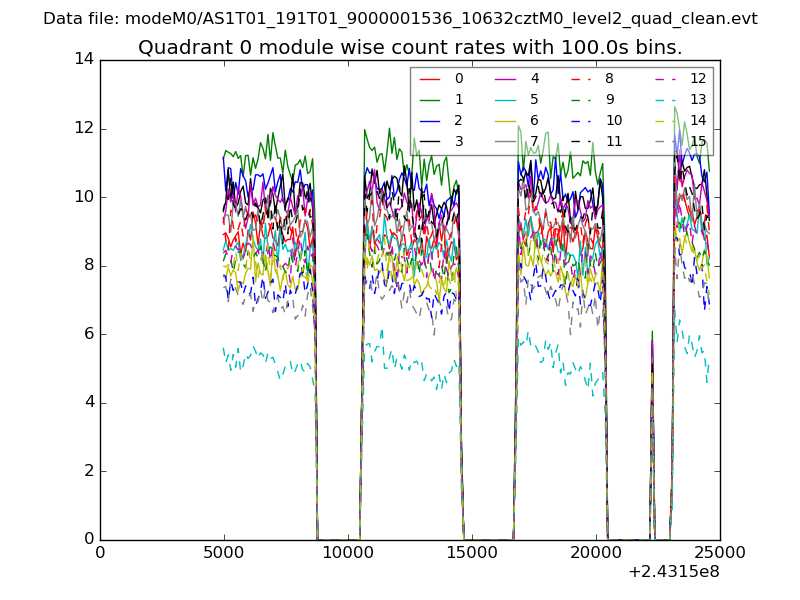 |
 |
| Module-wise count rates for Quadrant B Data is divided into 100 sec bins |
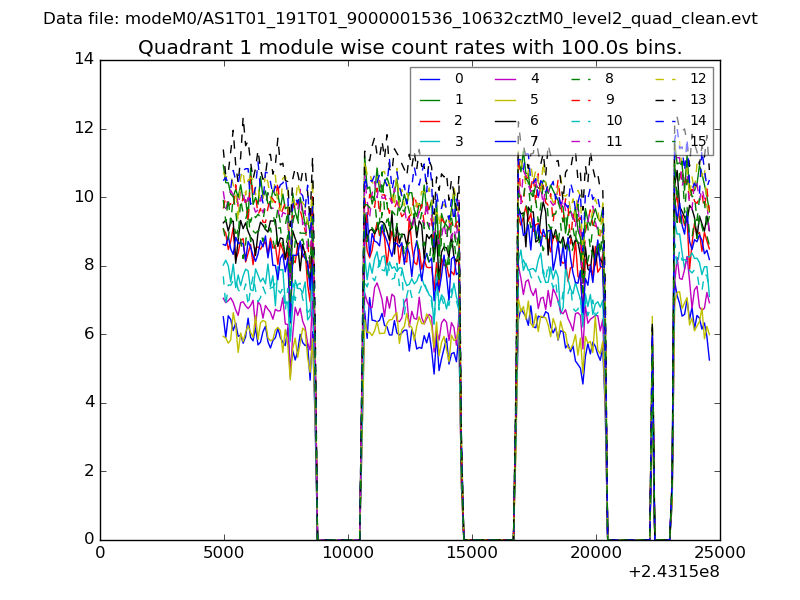 |
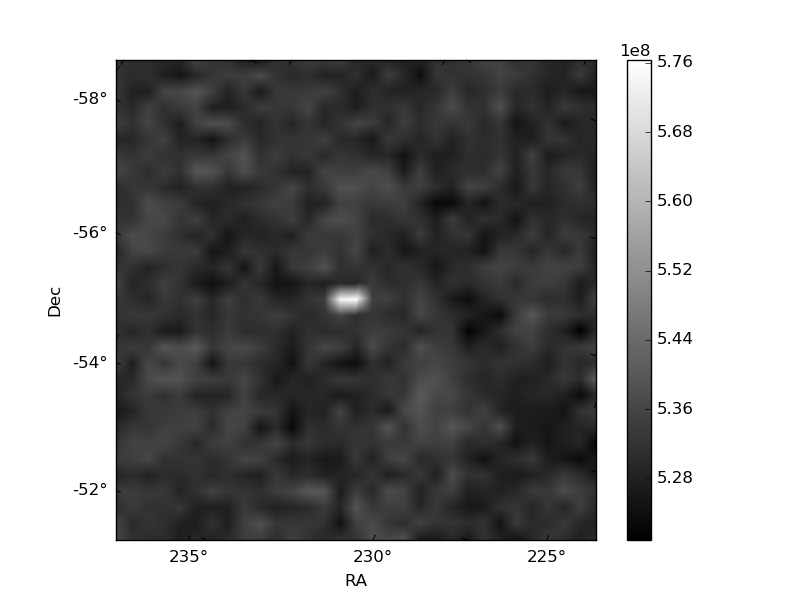 |
| Module-wise count rates for Quadrant C Data is divided into 100 sec bins |
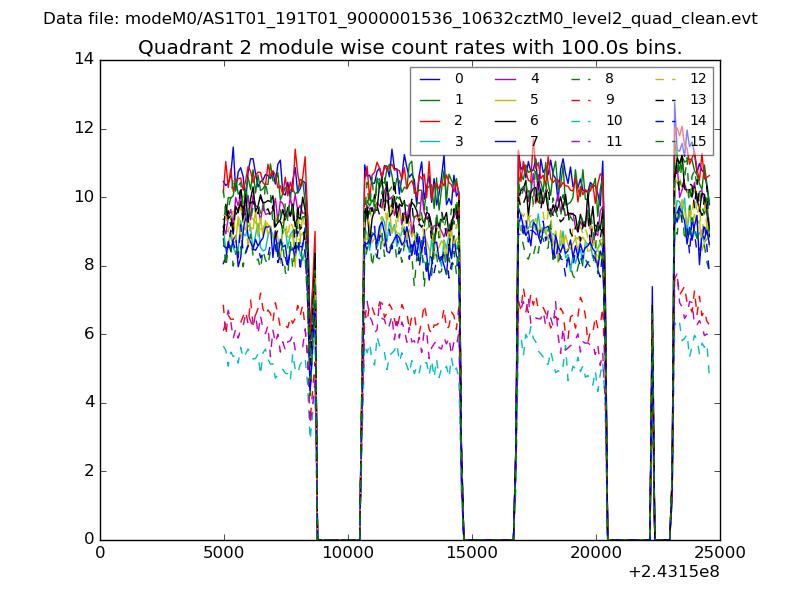 |
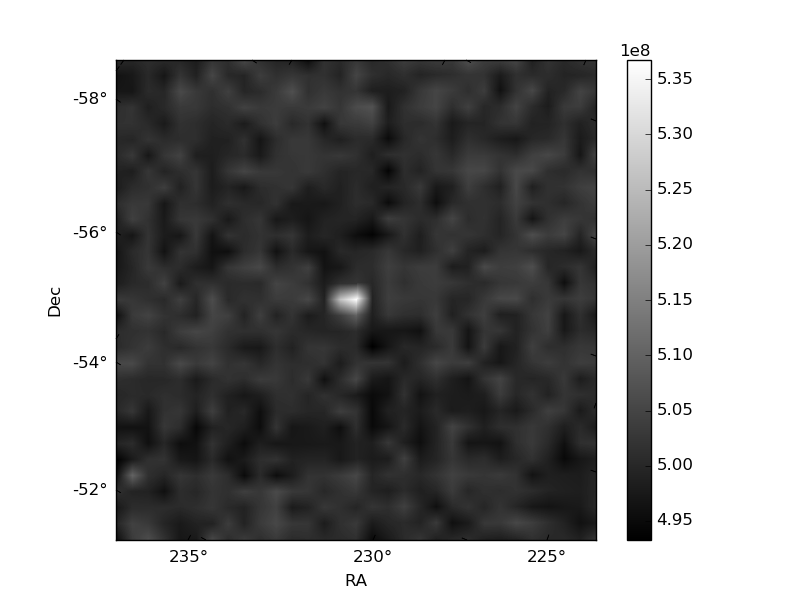 |
| Module-wise count rates for Quadrant D Data is divided into 100 sec bins |
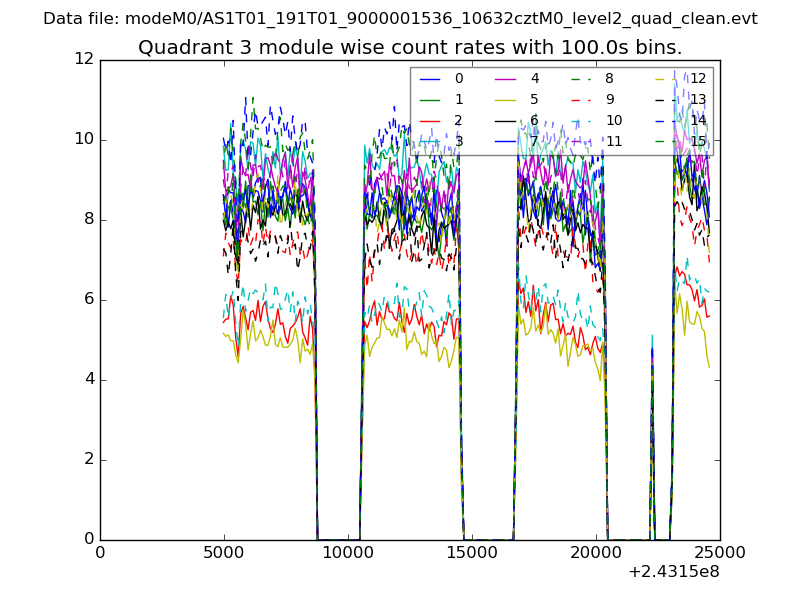 |
 |
| Parameter | Plot |
|---|---|
| CZT HV Monitor | 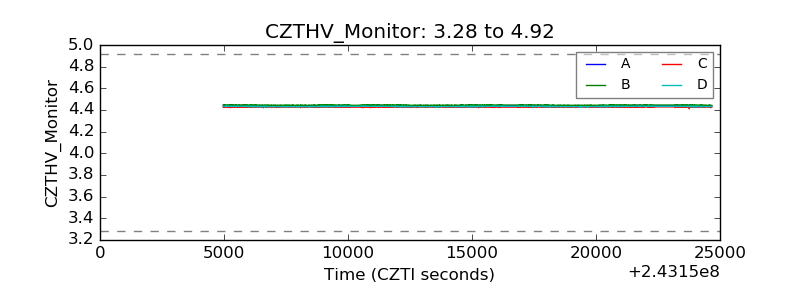 |
| D_VDD | 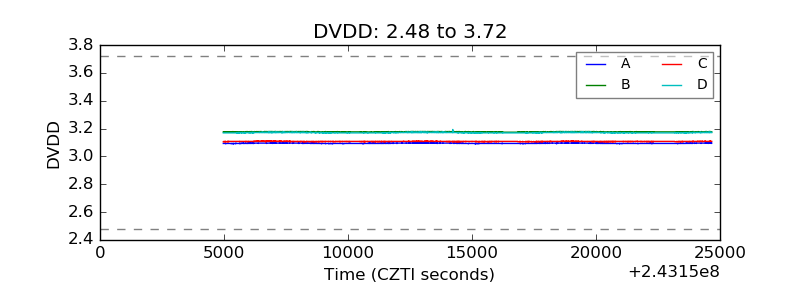 |
| Temperature 1 | 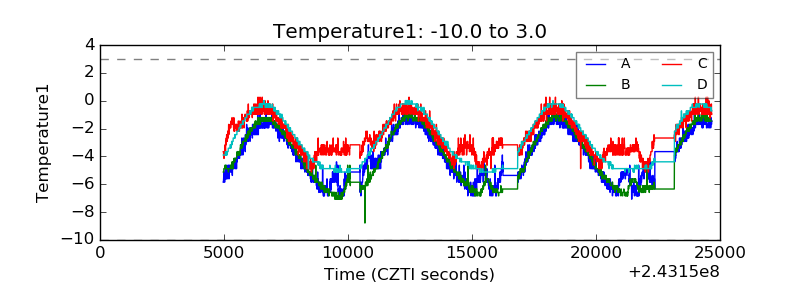 |
| Veto HV Monitor | 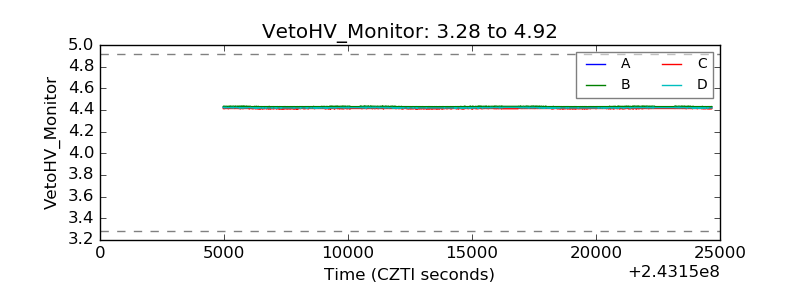 |
| Veto LLD | 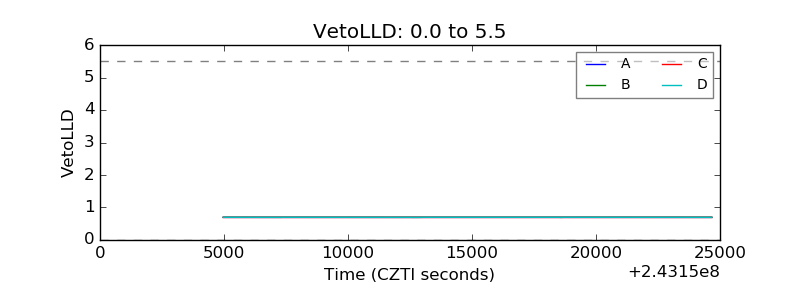 |
| Alpha Counter |  |
| _CPM_Rate | 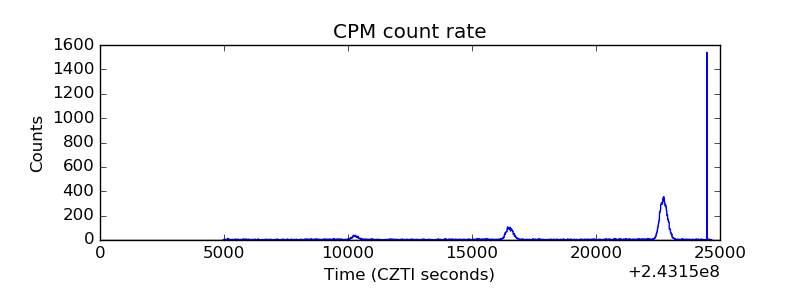 |
| CZT Counter | 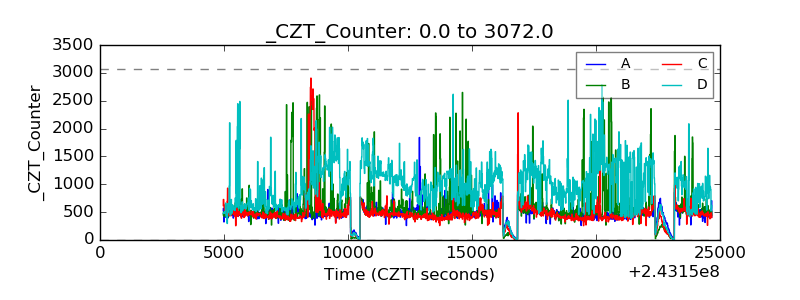 |
| +2.5 Volts monitor |  |
| +5 Volts monitor |  |
| _ROLL_ROT | 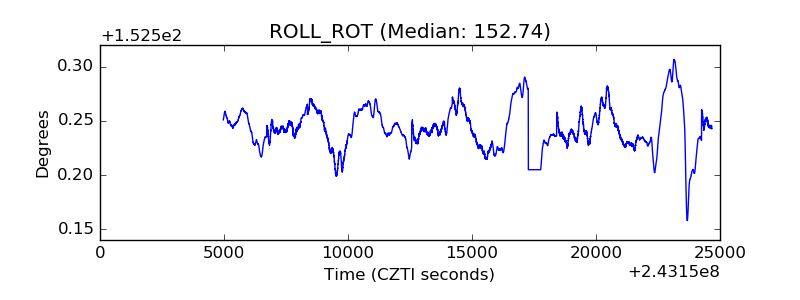 |
| _Roll_DEC | 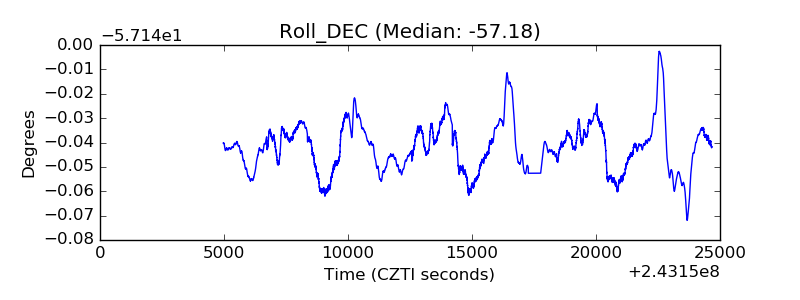 |
| _Roll_RA | 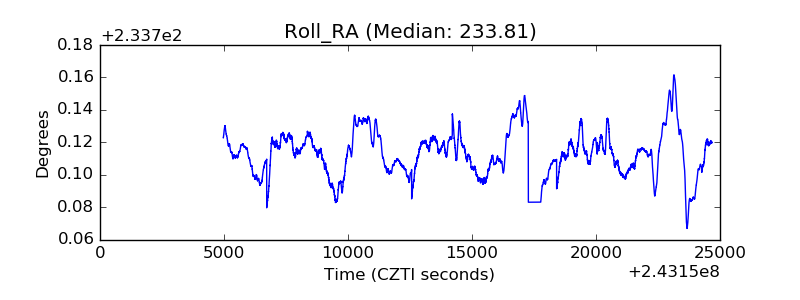 |
| Veto Counter | 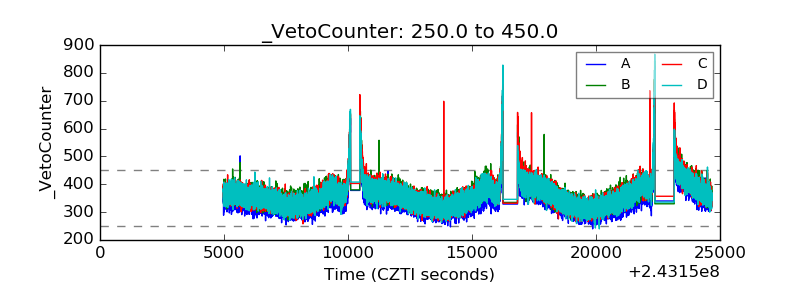 |