| Param | Original file | Final file |
|---|---|---|
| Filename | modeM0/AS1T01_191T01_9000001536_10633cztM0_level2.evt | modeM0/AS1T01_191T01_9000001536_10633cztM0_level2_quad_clean.evt |
| Size (bytes) | 481,115,520 | 94,616,640 |
| Size | 458.8 MB | 90.2 MB |
| Events in quadrant A | 2,852,556 | 629,799 |
| Events in quadrant B | 3,406,073 | 610,816 |
| Events in quadrant C | 3,241,269 | 619,093 |
| Events in quadrant D | 4,665,819 | 588,626 |
| Mode SS | |||
|---|---|---|---|
| Quadrant | BADHDUFLAG | Total packets | Discarded packets |
| A | 0 | 120 | 0 |
| B | 0 | 120 | 0 |
| C | 0 | 120 | 0 |
| D | 0 | 120 | 0 |
| Mode M9 | |||
|---|---|---|---|
| Quadrant | BADHDUFLAG | Total packets | Discarded packets |
| A | 0 | 10 | 0 |
| B | 0 | 10 | 0 |
| C | 0 | 10 | 0 |
| D | 0 | 10 | 0 |
| Mode M0 | |||
|---|---|---|---|
| Quadrant | BADHDUFLAG | Total packets | Discarded packets |
| A | 0 | 12594 | 2 |
| B | 0 | 13990 | 1 |
| C | 0 | 13801 | 1 |
| D | 0 | 18059 | 1 |
| Quadrant | Total seconds | Saturated seconds | Saturation percentage |
|---|---|---|---|
| A | 5977 | 27 | 0.451732% |
| B | 5977 | 102 | 1.706542% |
| C | 5977 | 41 | 0.685963% |
| D | 5977 | 84 | 1.405387% |
Noise dominated data is calculated using 1-second bins in cleaned event files. If a bin has >2000 counts, and if more than 50% of those come from <1% of pixels, then it is considered to be noise-dominated and hence unusable.
| Quadrant | # 1 sec bins | Bins with >0 counts | Bins with >2000 counts | High rate bins dominated by noise | Noise dominated (total time) | Noise dominated (detector-on time) | Marked lightcurve |
|---|---|---|---|---|---|---|---|
| A | 6952 | 5978 | 0 | 0 | 0.00% | 0.00% | 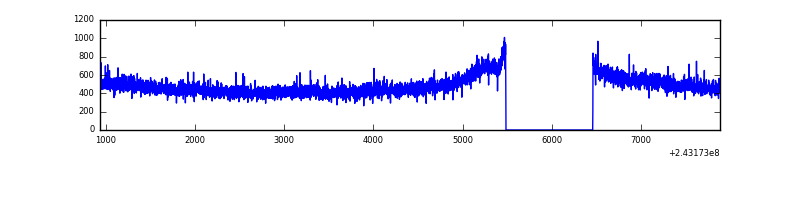 |
| B | 6952 | 5978 | 52 | 52 | 0.75% | 0.87% | 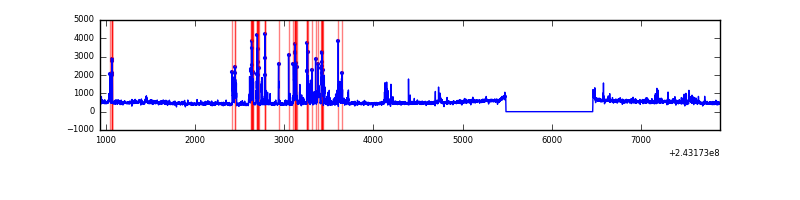 |
| C | 6952 | 5978 | 39 | 39 | 0.56% | 0.65% | 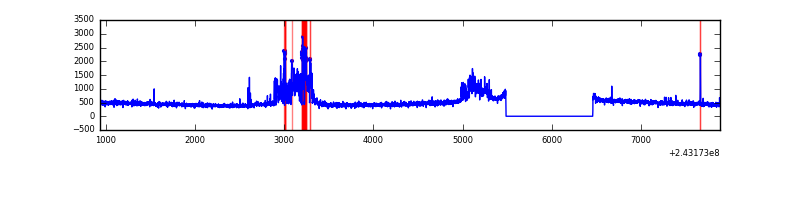 |
| D | 6952 | 5978 | 52 | 52 | 0.75% | 0.87% | 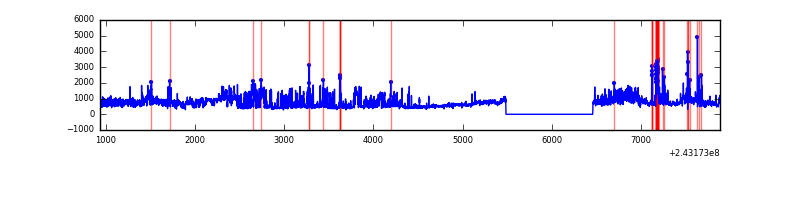 |
Top three noisy pixels from each quadrant. If the there are fewer than three noisy pixels in the level2.evt file, extra rows are filled as -1
| Pixel properties | Quadrant properties | ||||||
|---|---|---|---|---|---|---|---|
| Quadrant | DetID | PixID | Counts | Sigma | Mean | Median | Sigma |
| A | 13 | 251 | 19633 | 122.86 | 730 | 720 | 153.9 |
| A | 1 | 162 | 13701 | 84.32 | 730 | 720 | 153.9 |
| A | 0 | 226 | 6822 | 39.64 | 730 | 720 | 153.9 |
| B | 4 | 239 | 493180 | 3554.52 | 716 | 702 | 138.5 |
| B | 0 | 214 | 43236 | 306.99 | 716 | 702 | 138.5 |
| B | 0 | 219 | 30627 | 215.99 | 716 | 702 | 138.5 |
| C | 4 | 254 | 501917 | 3053.93 | 695 | 703 | 164.1 |
| C | 0 | 207 | 7621 | 42.15 | 695 | 703 | 164.1 |
| C | 4 | 175 | 7234 | 39.79 | 695 | 703 | 164.1 |
| D | 1 | 20 | 1159514 | 6680.64 | 698 | 682 | 173.5 |
| D | 2 | 16 | 322097 | 1852.95 | 698 | 682 | 173.5 |
| D | 8 | 195 | 102506 | 587.01 | 698 | 682 | 173.5 |
Histogram calculated using DETX and DETY for each event in the final _common_clean file
| Quadrant A | 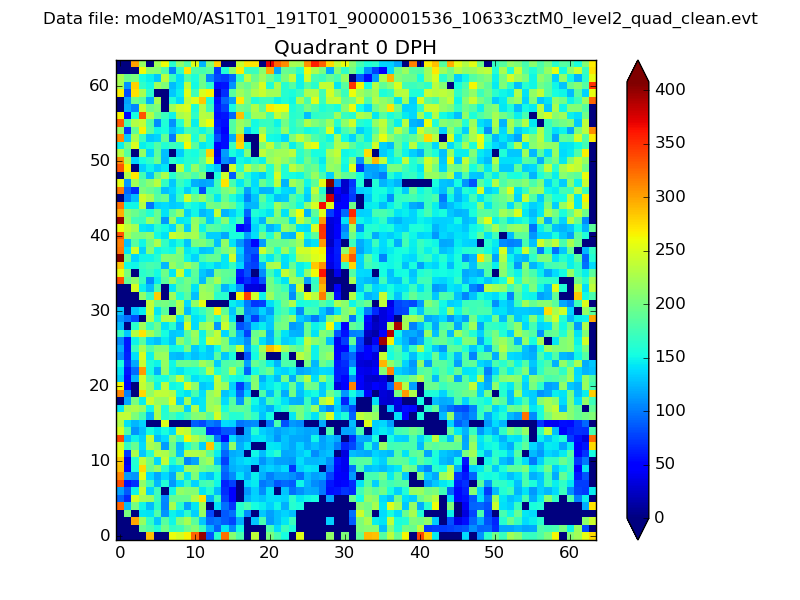 |
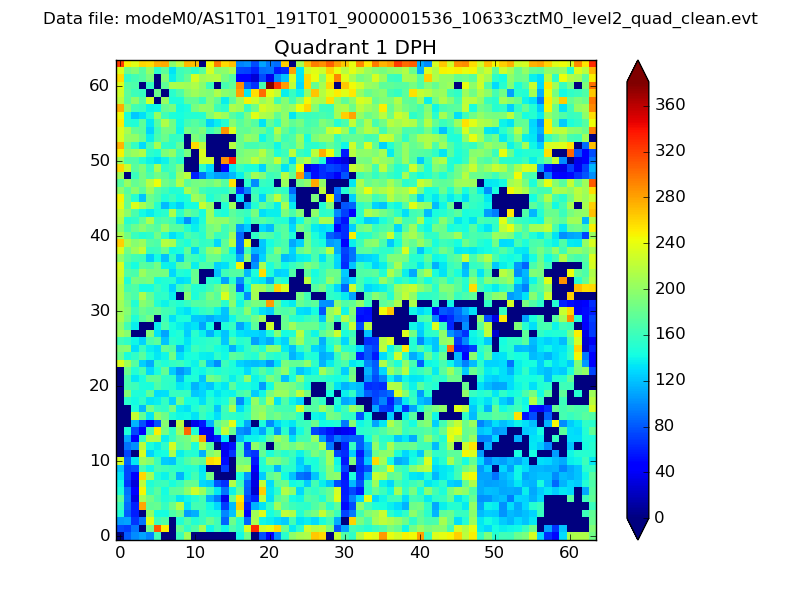 |
Quadrant B |
|---|---|---|---|
| Quadrant D |  |
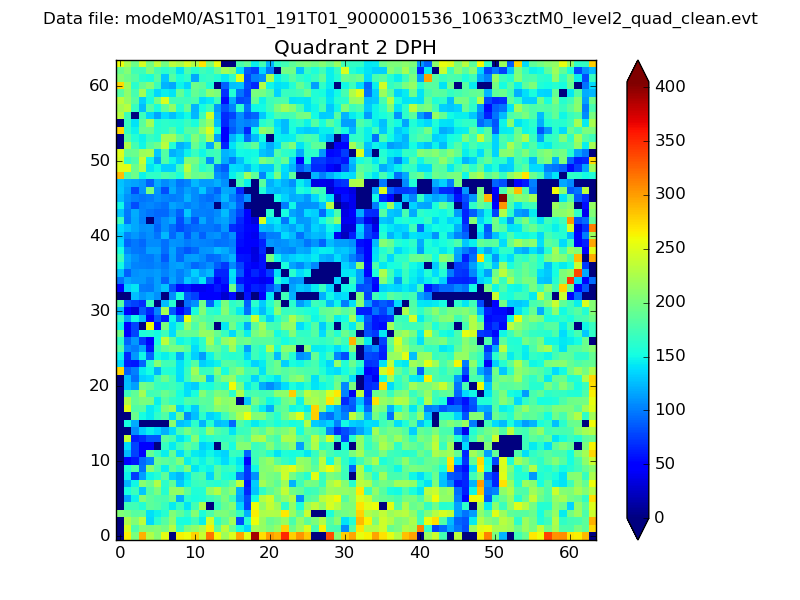 |
Quadrant C |
| Plot type | Count rate plots | Images |
|---|---|---|
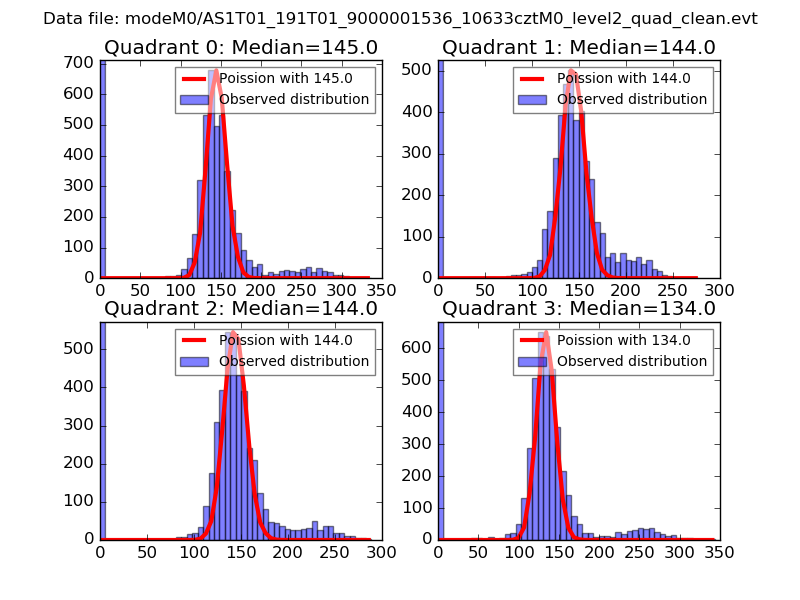
| Comparison with Poisson distribution Blue bars denote a histogram of data divided into 1 sec bins. Red curve is a Poisson curve with rate = median count rate of data. |
 |
 |
| Quadrant-wise count rates Data is divided into 100 sec bins |
 |
|
| Module-wise count rates for Quadrant A Data is divided into 100 sec bins |
 |
 |
| Module-wise count rates for Quadrant B Data is divided into 100 sec bins |
 |
 |
| Module-wise count rates for Quadrant C Data is divided into 100 sec bins |
 |
 |
| Module-wise count rates for Quadrant D Data is divided into 100 sec bins |
 |
 |
| Parameter | Plot |
|---|---|
| CZT HV Monitor |  |
| D_VDD | 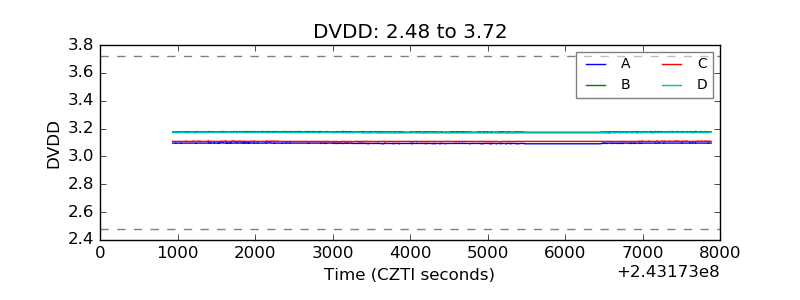 |
| Temperature 1 | 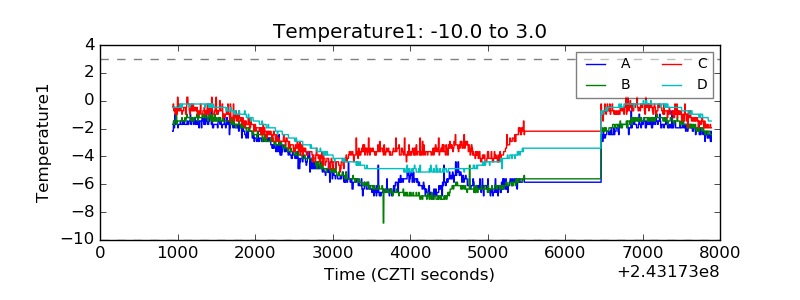 |
| Veto HV Monitor | 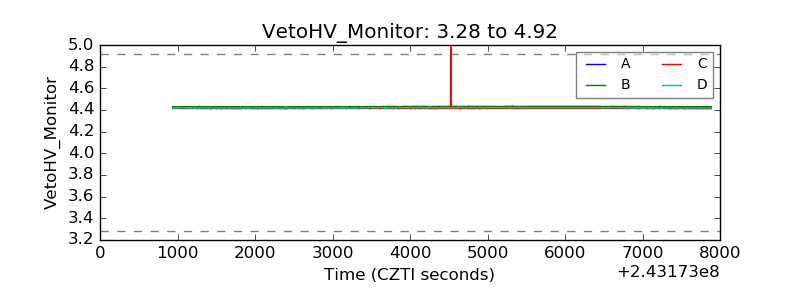 |
| Veto LLD | 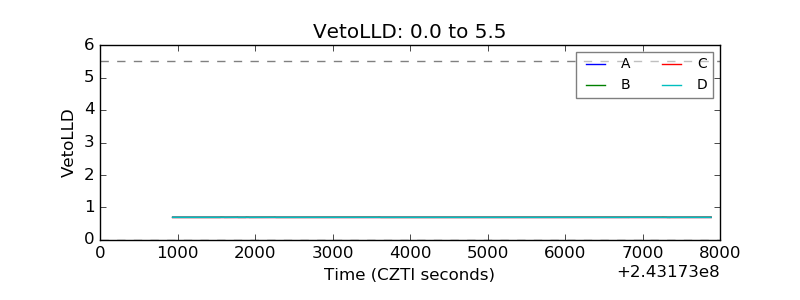 |
| Alpha Counter | 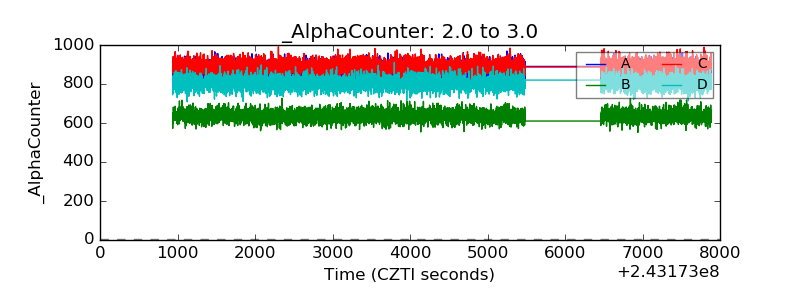 |
| _CPM_Rate | 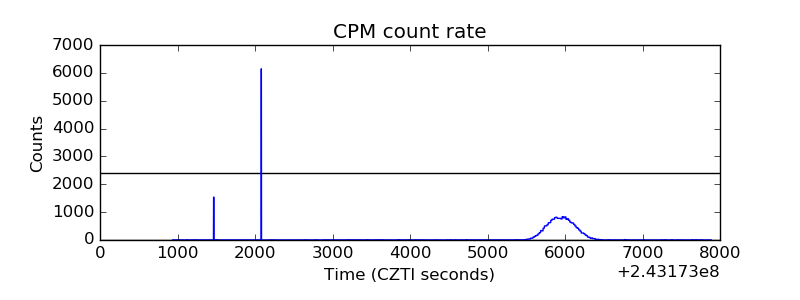 |
| CZT Counter | 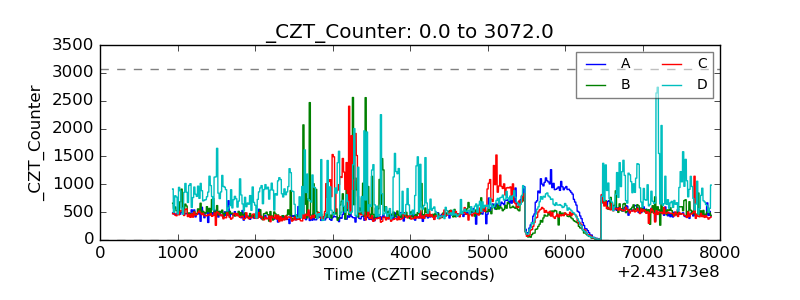 |
| +2.5 Volts monitor |  |
| +5 Volts monitor | 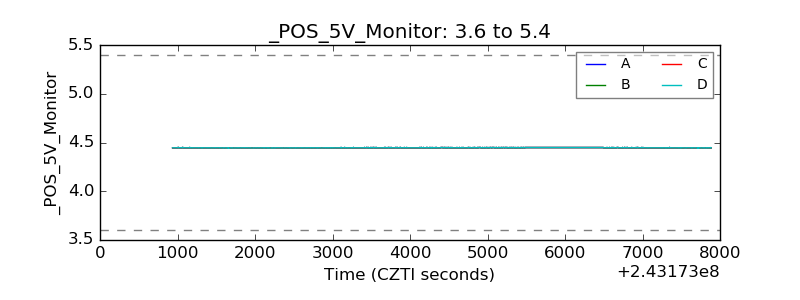 |
| _ROLL_ROT | 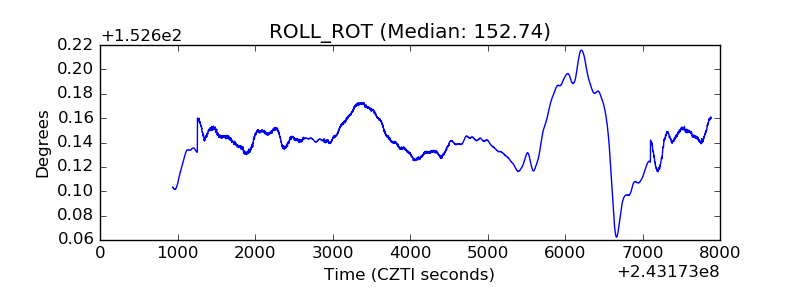 |
| _Roll_DEC | 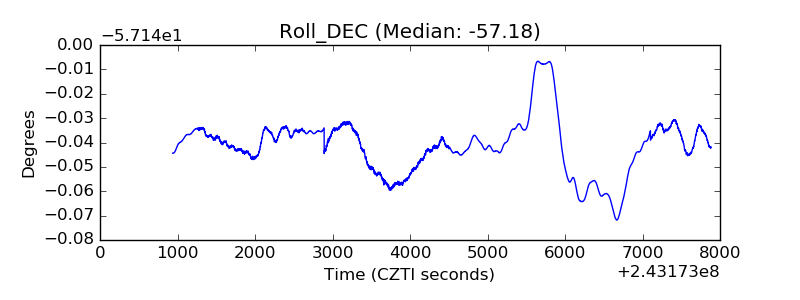 |
| _Roll_RA | 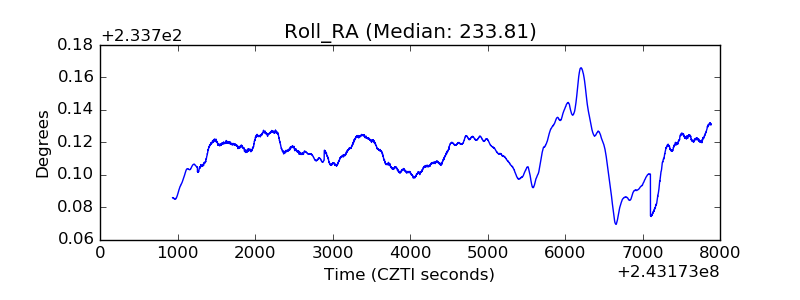 |
| Veto Counter | 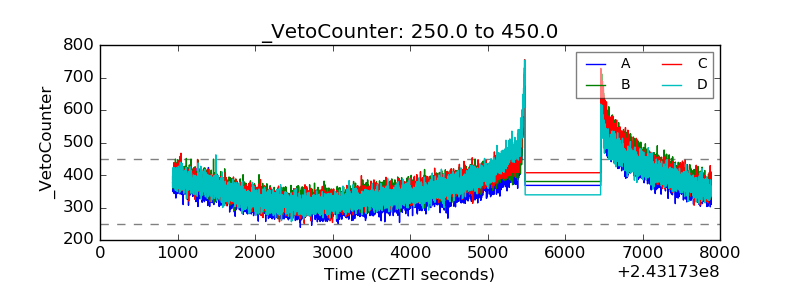 |