| Param | Original file | Final file |
|---|---|---|
| Filename | modeM0/AS1T01_191T01_9000001536_10635cztM0_level2.evt | modeM0/AS1T01_191T01_9000001536_10635cztM0_level2_quad_clean.evt |
| Size (bytes) | 454,057,920 | 86,474,880 |
| Size | 433.0 MB | 82.5 MB |
| Events in quadrant A | 2,688,219 | 573,959 |
| Events in quadrant B | 3,641,507 | 559,337 |
| Events in quadrant C | 2,658,218 | 568,093 |
| Events in quadrant D | 4,385,711 | 528,120 |
| Mode SS | |||
|---|---|---|---|
| Quadrant | BADHDUFLAG | Total packets | Discarded packets |
| A | 0 | 112 | 0 |
| B | 0 | 112 | 0 |
| C | 0 | 112 | 0 |
| D | 0 | 112 | 0 |
| Mode M9 | |||
|---|---|---|---|
| Quadrant | BADHDUFLAG | Total packets | Discarded packets |
| A | 0 | 11 | 0 |
| B | 0 | 11 | 0 |
| C | 0 | 11 | 0 |
| D | 0 | 11 | 0 |
| Mode M0 | |||
|---|---|---|---|
| Quadrant | BADHDUFLAG | Total packets | Discarded packets |
| A | 0 | 11854 | 2 |
| B | 0 | 14502 | 1 |
| C | 0 | 11789 | 1 |
| D | 0 | 16803 | 1 |
| Quadrant | Total seconds | Saturated seconds | Saturation percentage |
|---|---|---|---|
| A | 5566 | 46 | 0.826446% |
| B | 5566 | 238 | 4.275961% |
| C | 5566 | 19 | 0.341358% |
| D | 5566 | 136 | 2.443406% |
Noise dominated data is calculated using 1-second bins in cleaned event files. If a bin has >2000 counts, and if more than 50% of those come from <1% of pixels, then it is considered to be noise-dominated and hence unusable.
| Quadrant | # 1 sec bins | Bins with >0 counts | Bins with >2000 counts | High rate bins dominated by noise | Noise dominated (total time) | Noise dominated (detector-on time) | Marked lightcurve |
|---|---|---|---|---|---|---|---|
| A | 6656 | 5567 | 0 | 0 | 0.00% | 0.00% | 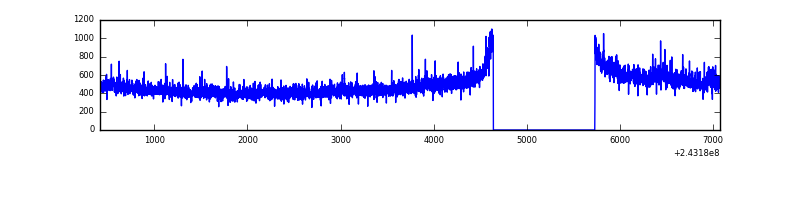 |
| B | 6656 | 5567 | 122 | 122 | 1.83% | 2.19% | 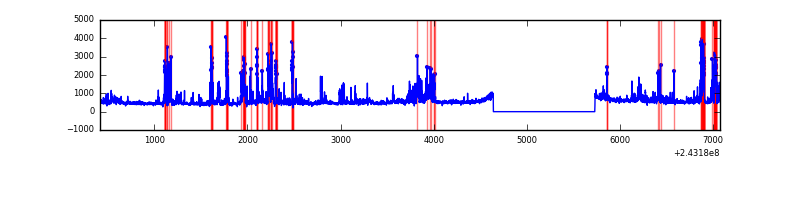 |
| C | 6656 | 5567 | 3 | 3 | 0.05% | 0.05% | 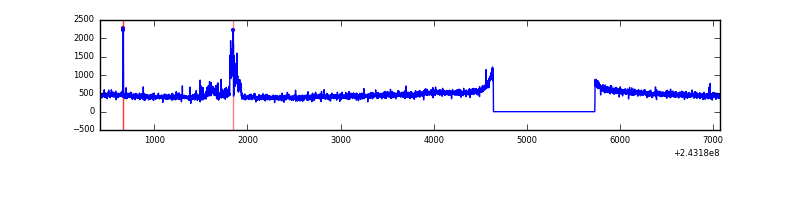 |
| D | 6656 | 5567 | 123 | 123 | 1.85% | 2.21% | 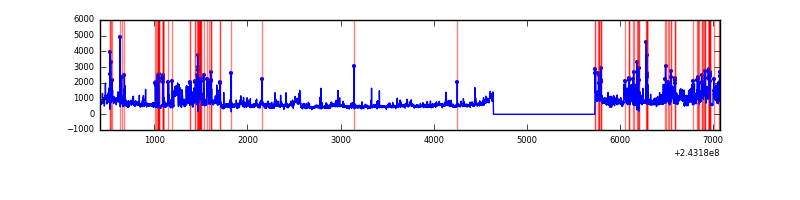 |
Top three noisy pixels from each quadrant. If the there are fewer than three noisy pixels in the level2.evt file, extra rows are filled as -1
| Pixel properties | Quadrant properties | ||||||
|---|---|---|---|---|---|---|---|
| Quadrant | DetID | PixID | Counts | Sigma | Mean | Median | Sigma |
| A | 13 | 251 | 63256 | 444.58 | 676 | 665 | 140.8 |
| A | 1 | 162 | 11366 | 76.01 | 676 | 665 | 140.8 |
| A | 0 | 226 | 6143 | 38.91 | 676 | 665 | 140.8 |
| B | 4 | 239 | 853612 | 6665.67 | 667 | 654 | 128.0 |
| B | 0 | 219 | 41558 | 319.65 | 667 | 654 | 128.0 |
| B | 0 | 187 | 35277 | 270.57 | 667 | 654 | 128.0 |
| C | 4 | 254 | 120533 | 794.74 | 646 | 654 | 150.8 |
| C | 0 | 207 | 8664 | 53.1 | 646 | 654 | 150.8 |
| C | 13 | 61 | 4897 | 28.13 | 646 | 654 | 150.8 |
| D | 1 | 20 | 419996 | 2668.18 | 639 | 624 | 157.2 |
| D | 5 | 222 | 407280 | 2587.27 | 639 | 624 | 157.2 |
| D | 2 | 16 | 353789 | 2246.95 | 639 | 624 | 157.2 |
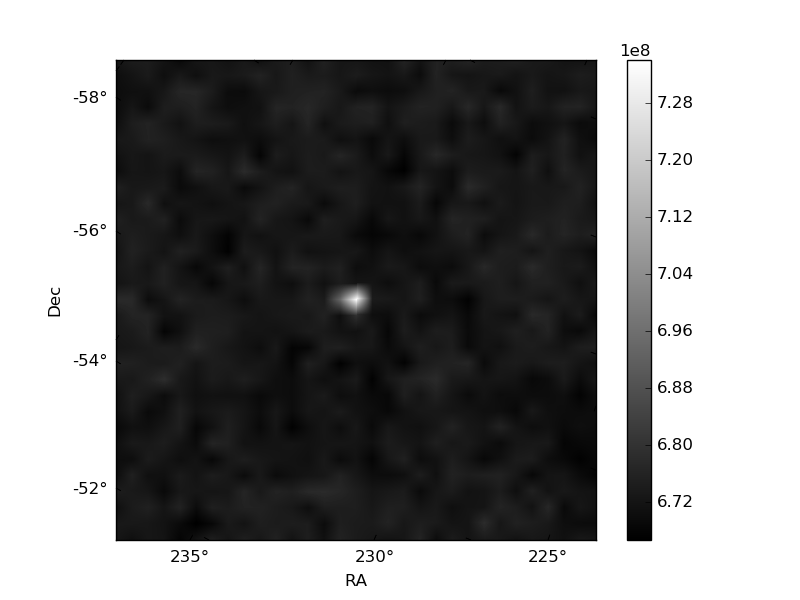
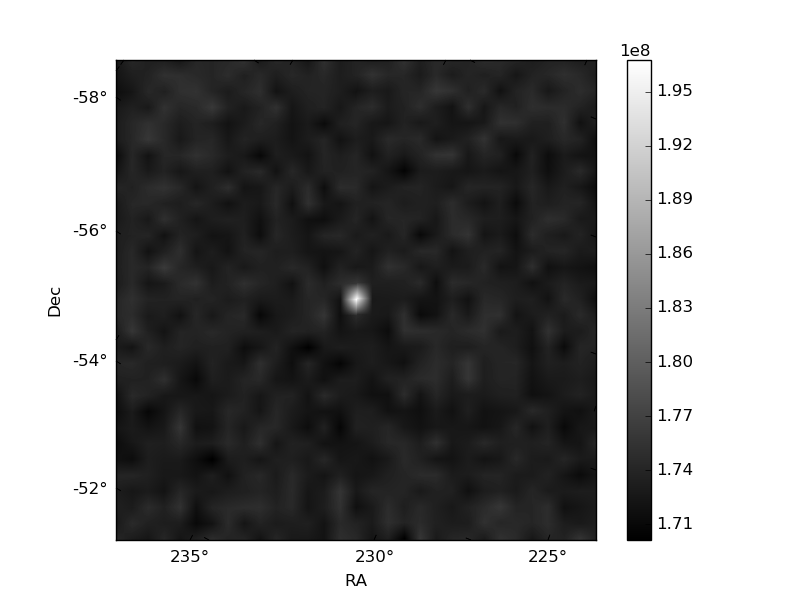
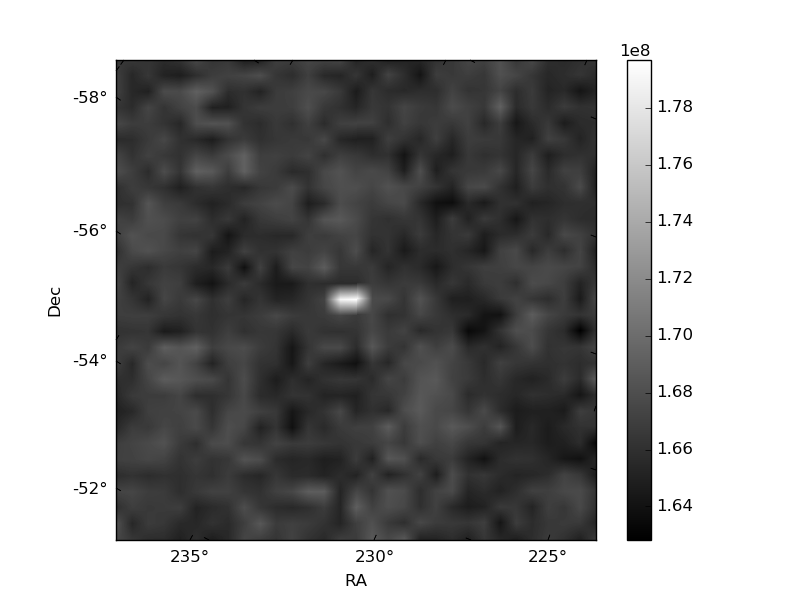
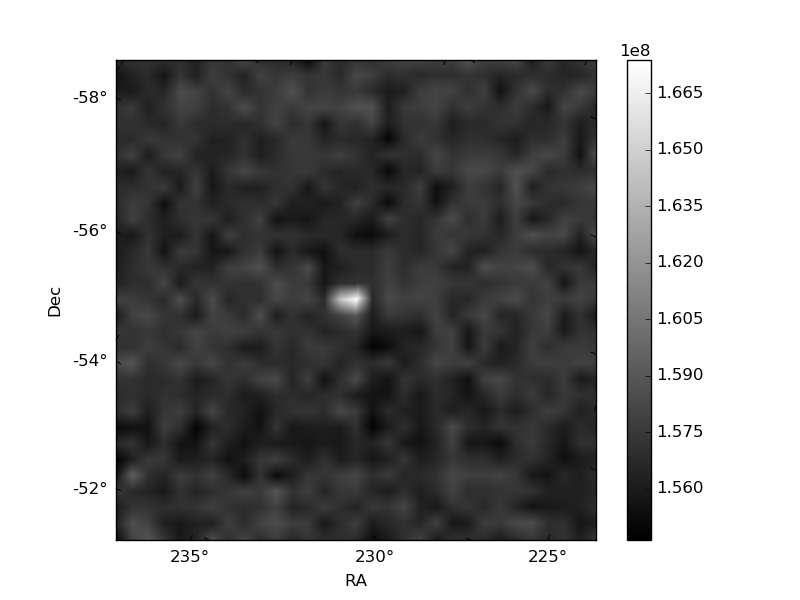
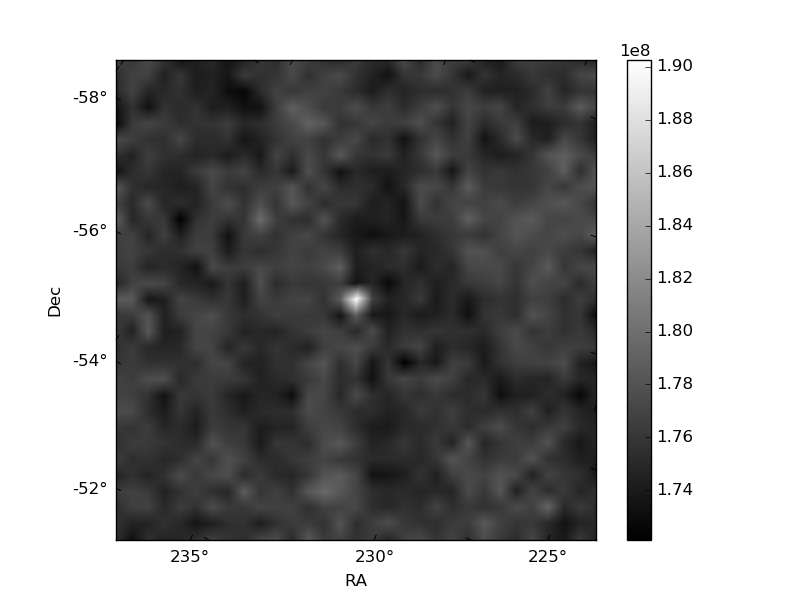
Histogram calculated using DETX and DETY for each event in the final _common_clean file
| Quadrant A | 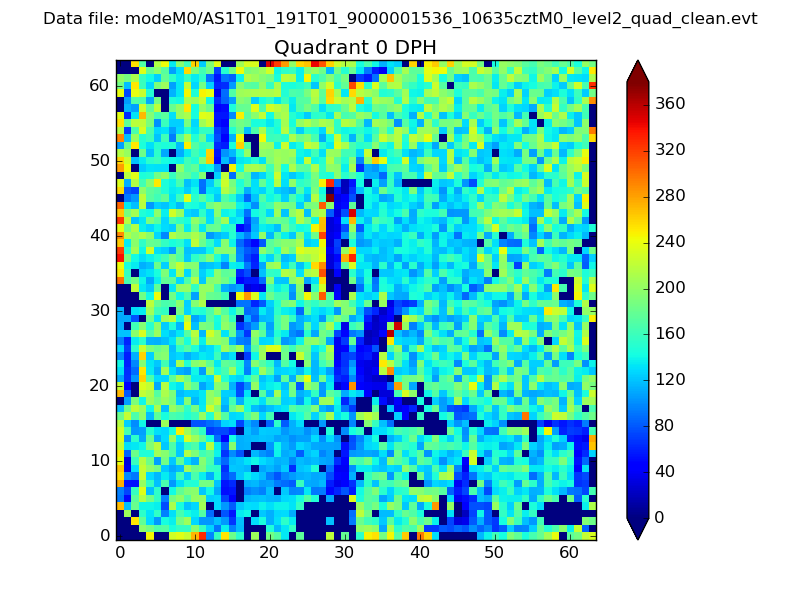 |
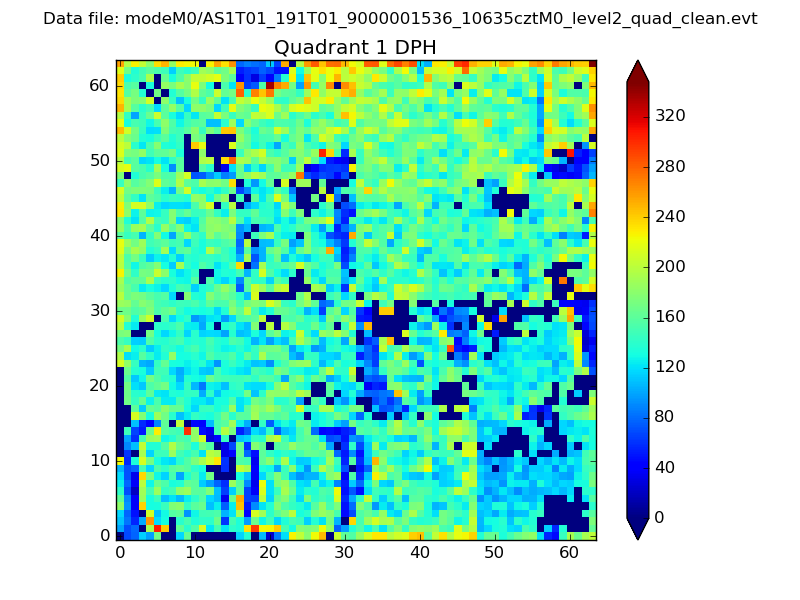 |
Quadrant B |
|---|---|---|---|
| Quadrant D | 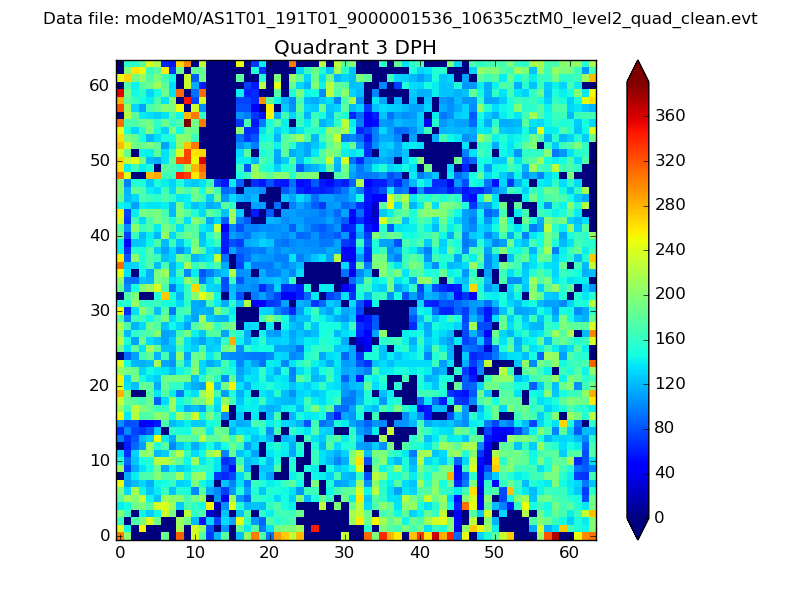 |
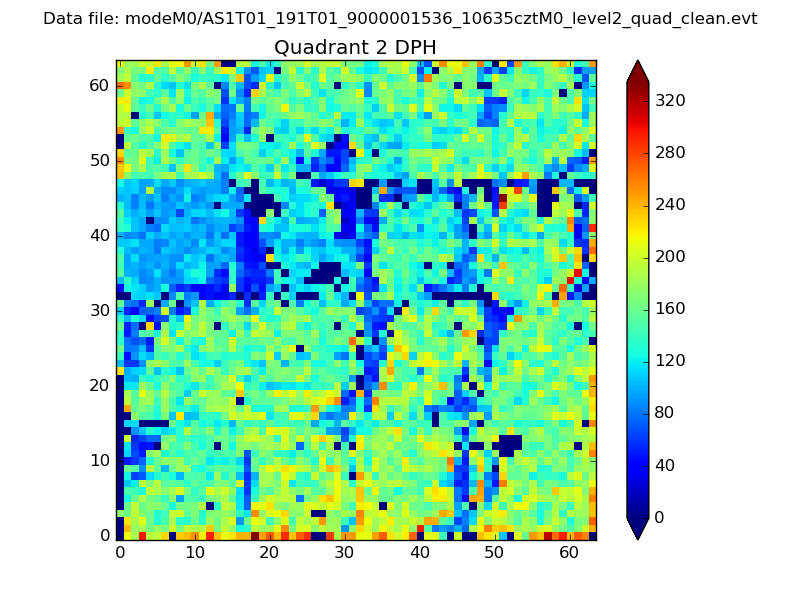 |
Quadrant C |
| Plot type | Count rate plots | Images |
|---|---|---|
| Comparison with Poisson distribution Blue bars denote a histogram of data divided into 1 sec bins. Red curve is a Poisson curve with rate = median count rate of data. |
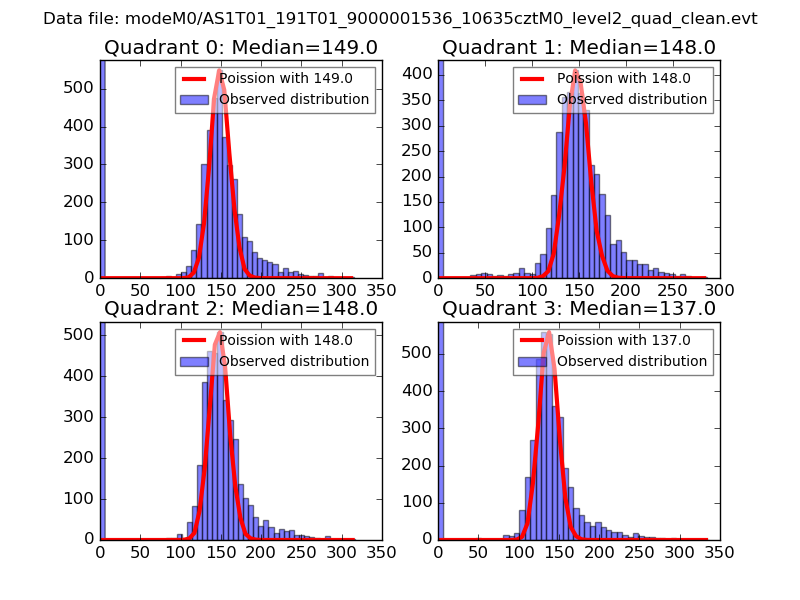 |
 |
| Quadrant-wise count rates Data is divided into 100 sec bins |
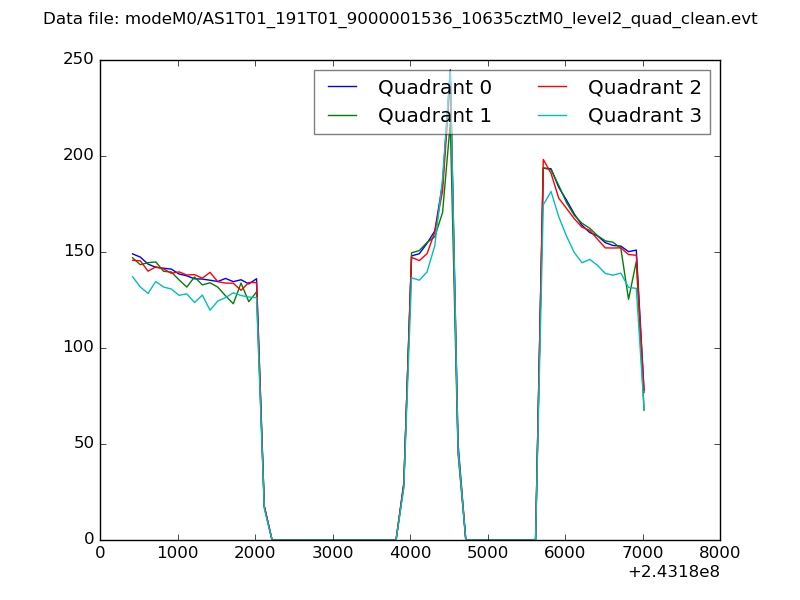 |
|
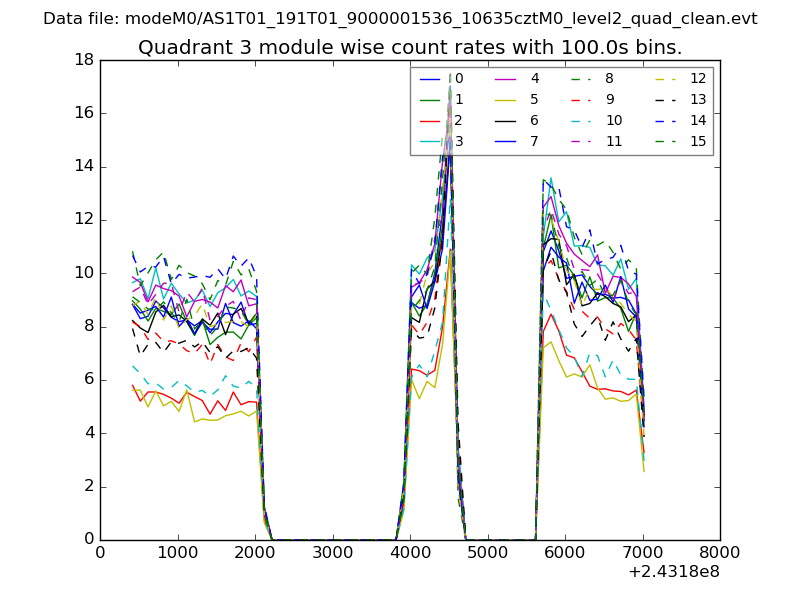
| Module-wise count rates for Quadrant A Data is divided into 100 sec bins |
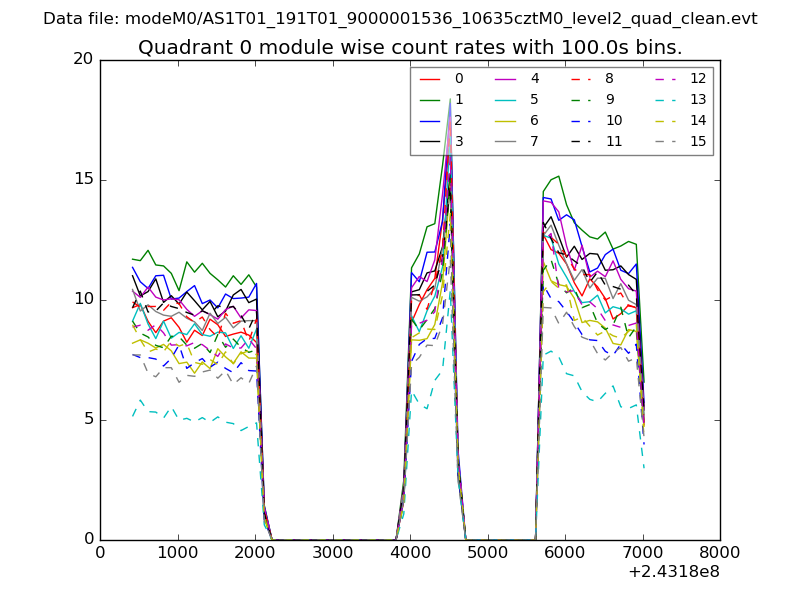 |
 |
| Module-wise count rates for Quadrant B Data is divided into 100 sec bins |
 |
 |
| Module-wise count rates for Quadrant C Data is divided into 100 sec bins |
 |
 |
| Module-wise count rates for Quadrant D Data is divided into 100 sec bins |
 |
 |
| Parameter | Plot |
|---|---|
| CZT HV Monitor |  |
| D_VDD | 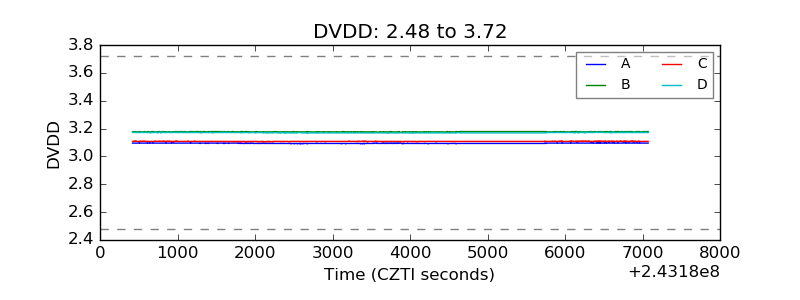 |
| Temperature 1 | 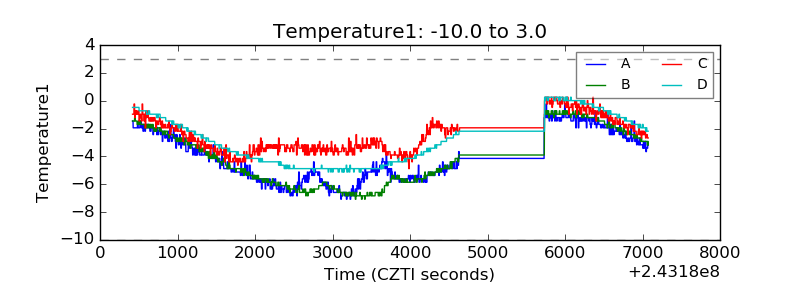 |
| Veto HV Monitor | 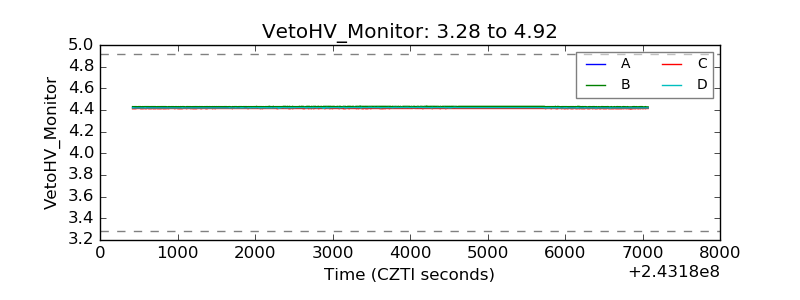 |
| Veto LLD | 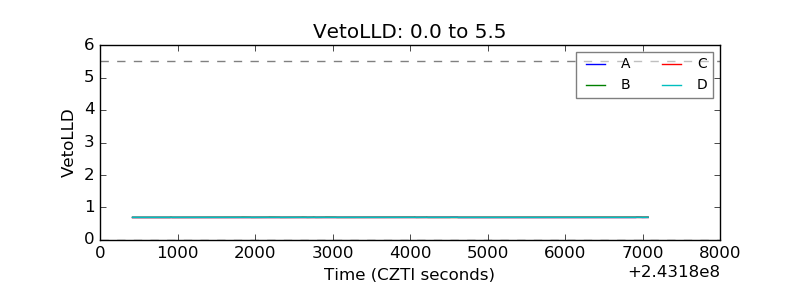 |
| Alpha Counter | 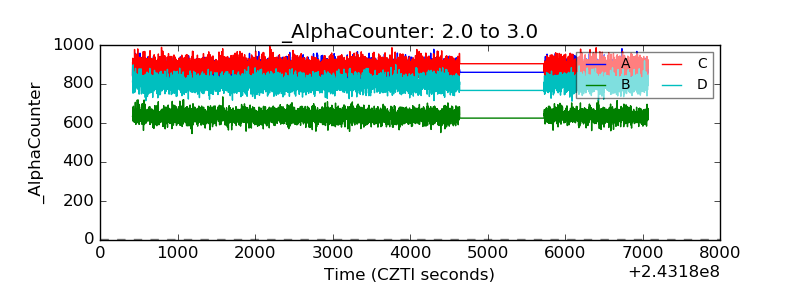 |
| _CPM_Rate | 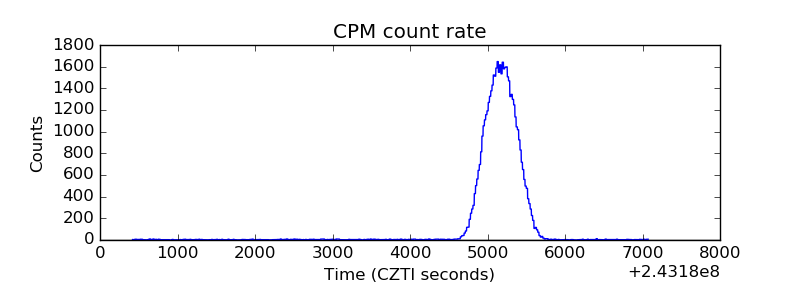 |
| CZT Counter |  |
| +2.5 Volts monitor |  |
| +5 Volts monitor | 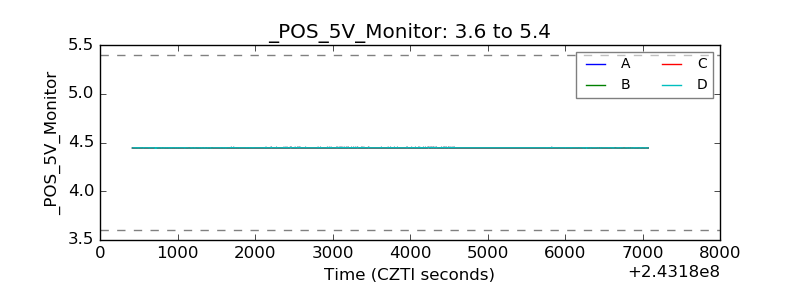 |
| _ROLL_ROT | 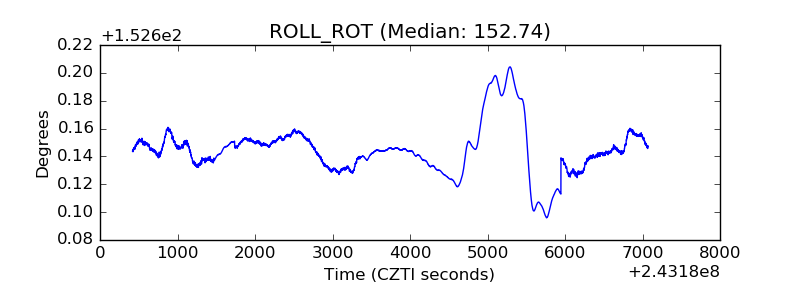 |
| _Roll_DEC | 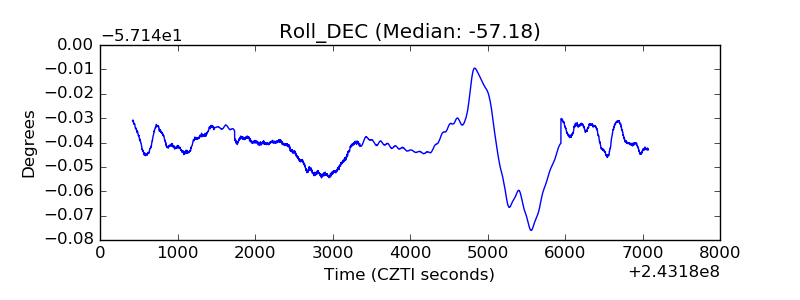 |
| _Roll_RA | 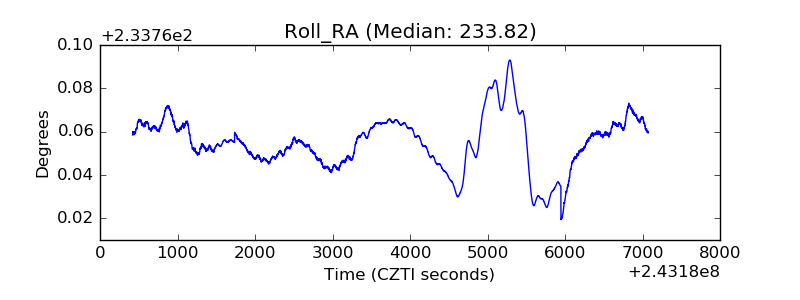 |
| Veto Counter | 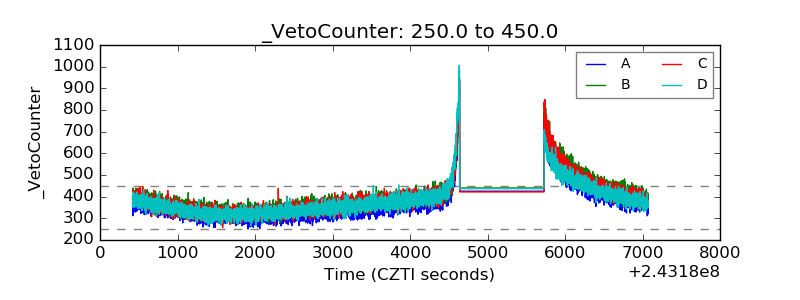 |