| Param | Original file | Final file |
|---|---|---|
| Filename | modeM0/AS1T01_191T01_9000001536_10637cztM0_level2.evt | modeM0/AS1T01_191T01_9000001536_10637cztM0_level2_quad_clean.evt |
| Size (bytes) | 502,871,040 | 92,191,680 |
| Size | 479.6 MB | 87.9 MB |
| Events in quadrant A | 2,802,800 | 618,185 |
| Events in quadrant B | 4,636,434 | 597,067 |
| Events in quadrant C | 3,452,454 | 613,261 |
| Events in quadrant D | 3,952,240 | 565,786 |
| Mode SS | |||
|---|---|---|---|
| Quadrant | BADHDUFLAG | Total packets | Discarded packets |
| A | 0 | 116 | 0 |
| B | 0 | 116 | 0 |
| C | 0 | 116 | 0 |
| D | 0 | 116 | 0 |
| Mode M9 | |||
|---|---|---|---|
| Quadrant | BADHDUFLAG | Total packets | Discarded packets |
| A | 0 | 13 | 0 |
| B | 0 | 13 | 0 |
| C | 0 | 13 | 0 |
| D | 0 | 13 | 0 |
| Mode M0 | |||
|---|---|---|---|
| Quadrant | BADHDUFLAG | Total packets | Discarded packets |
| A | 0 | 11968 | 2 |
| B | 0 | 17435 | 1 |
| C | 0 | 13966 | 1 |
| D | 0 | 15818 | 1 |
| Quadrant | Total seconds | Saturated seconds | Saturation percentage |
|---|---|---|---|
| A | 5685 | 35 | 0.615655% |
| B | 5685 | 530 | 9.322779% |
| C | 5685 | 229 | 4.028144% |
| D | 5685 | 69 | 1.213720% |
Noise dominated data is calculated using 1-second bins in cleaned event files. If a bin has >2000 counts, and if more than 50% of those come from <1% of pixels, then it is considered to be noise-dominated and hence unusable.
| Quadrant | # 1 sec bins | Bins with >0 counts | Bins with >2000 counts | High rate bins dominated by noise | Noise dominated (total time) | Noise dominated (detector-on time) | Marked lightcurve |
|---|---|---|---|---|---|---|---|
| A | 6990 | 5686 | 0 | 0 | 0.00% | 0.00% | 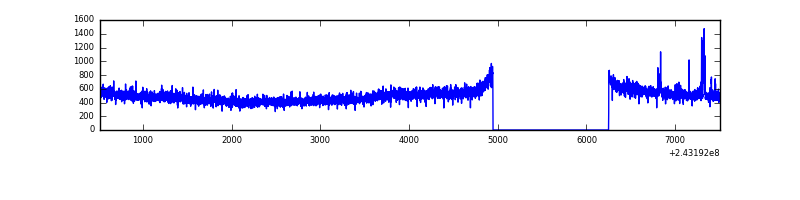 |
| B | 6990 | 5686 | 359 | 359 | 5.14% | 6.31% | 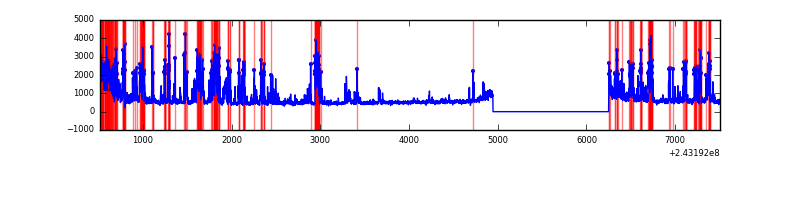 |
| C | 6990 | 5686 | 192 | 192 | 2.75% | 3.38% | 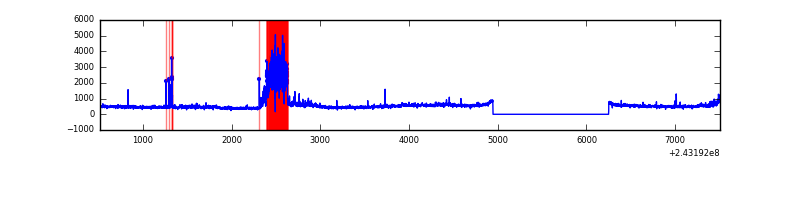 |
| D | 6990 | 5686 | 45 | 45 | 0.64% | 0.79% | 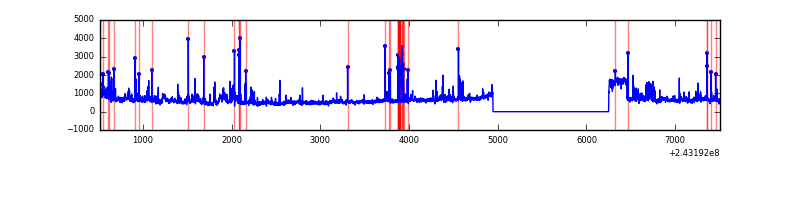 |
Top three noisy pixels from each quadrant. If the there are fewer than three noisy pixels in the level2.evt file, extra rows are filled as -1
| Pixel properties | Quadrant properties | ||||||
|---|---|---|---|---|---|---|---|
| Quadrant | DetID | PixID | Counts | Sigma | Mean | Median | Sigma |
| A | 13 | 251 | 39688 | 264.71 | 709 | 696 | 147.3 |
| A | 1 | 162 | 18205 | 118.86 | 709 | 696 | 147.3 |
| A | 0 | 226 | 6536 | 39.64 | 709 | 696 | 147.3 |
| B | 4 | 239 | 1772545 | 13380.27 | 694 | 682 | 132.4 |
| B | 0 | 219 | 76785 | 574.69 | 694 | 682 | 132.4 |
| B | 11 | 51 | 53545 | 399.2 | 694 | 682 | 132.4 |
| C | 4 | 254 | 814139 | 5278.05 | 665 | 675 | 154.1 |
| C | 14 | 234 | 33442 | 212.6 | 665 | 675 | 154.1 |
| C | 8 | 208 | 7350 | 43.31 | 665 | 675 | 154.1 |
| D | 8 | 195 | 450164 | 2782.79 | 665 | 650 | 161.5 |
| D | 2 | 16 | 289376 | 1787.41 | 665 | 650 | 161.5 |
| D | 1 | 20 | 231357 | 1428.23 | 665 | 650 | 161.5 |
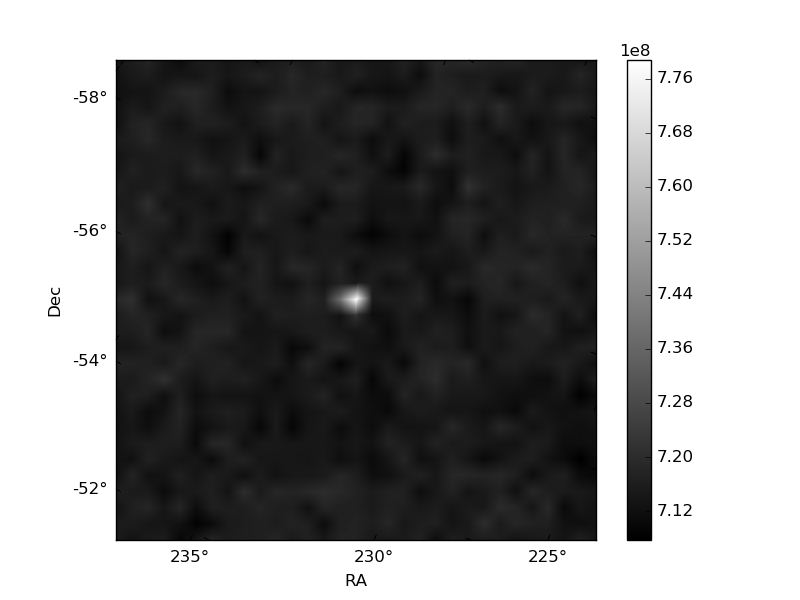
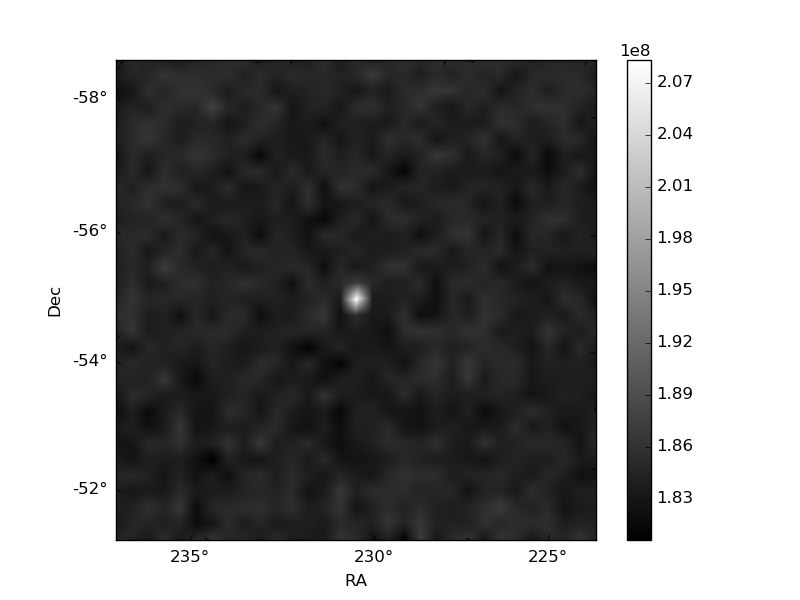
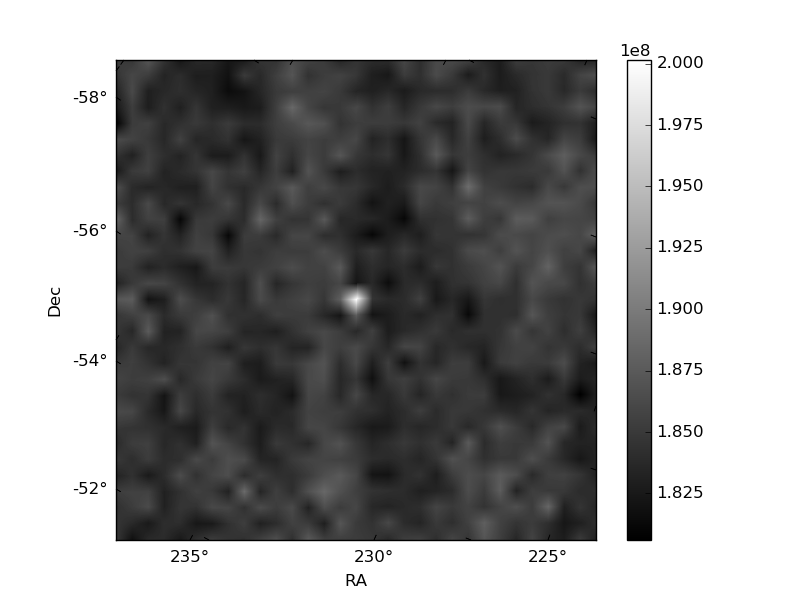
Histogram calculated using DETX and DETY for each event in the final _common_clean file
| Quadrant A | 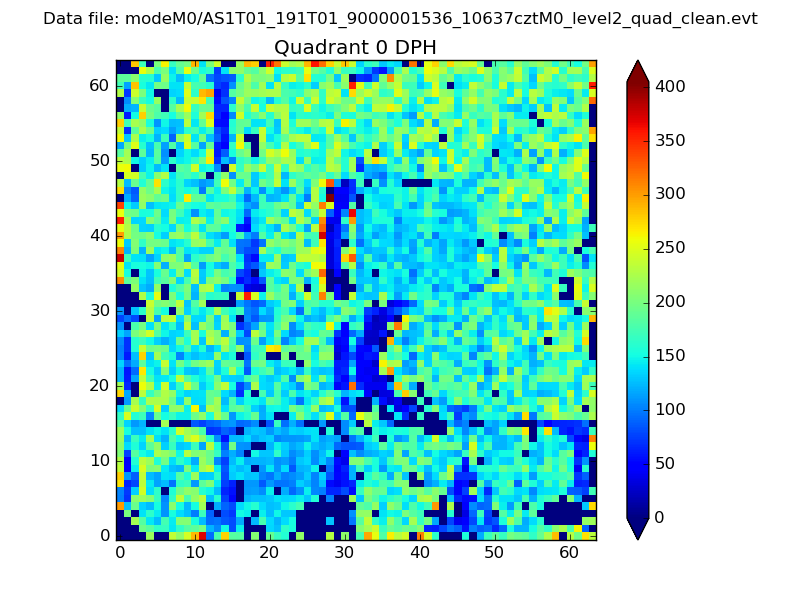 |
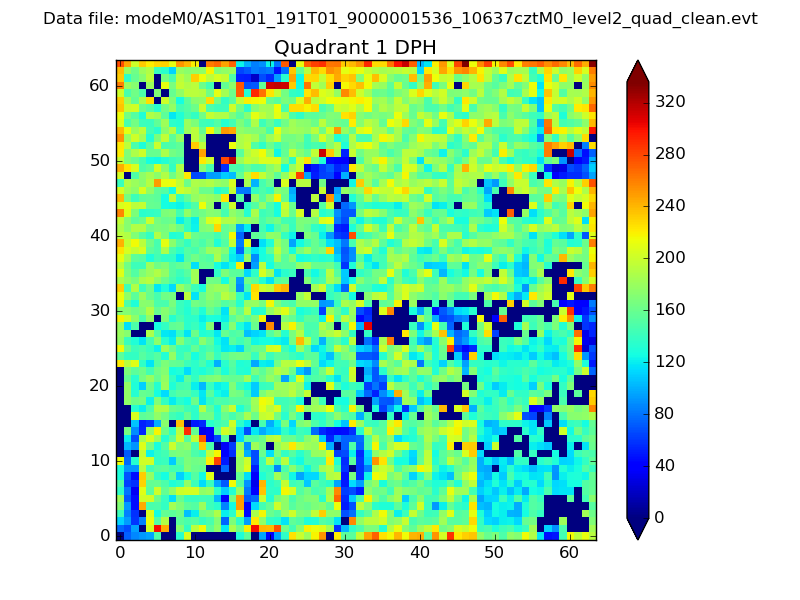 |
Quadrant B |
|---|---|---|---|
| Quadrant D | 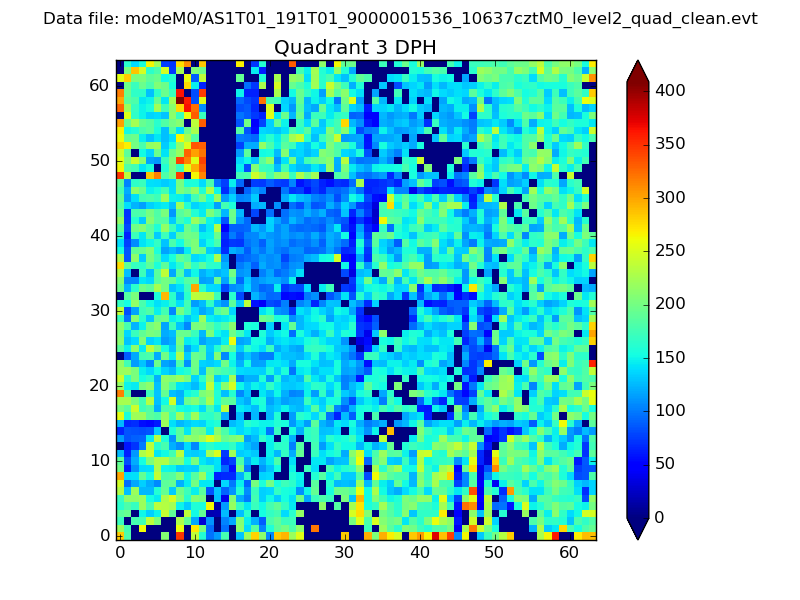 |
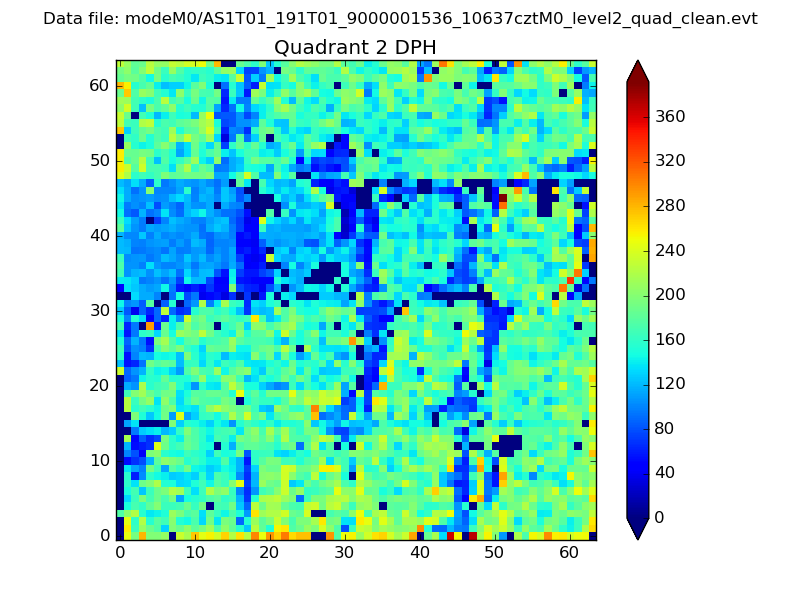 |
Quadrant C |
| Plot type | Count rate plots | Images |
|---|---|---|
| Comparison with Poisson distribution Blue bars denote a histogram of data divided into 1 sec bins. Red curve is a Poisson curve with rate = median count rate of data. |
 |
 |
| Quadrant-wise count rates Data is divided into 100 sec bins |
 |
|
| Module-wise count rates for Quadrant A Data is divided into 100 sec bins |
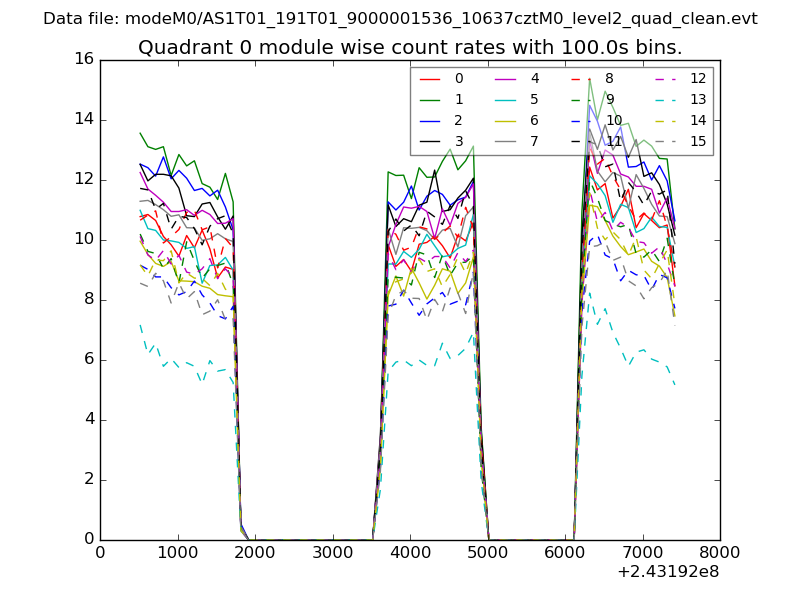 |
 |
| Module-wise count rates for Quadrant B Data is divided into 100 sec bins |
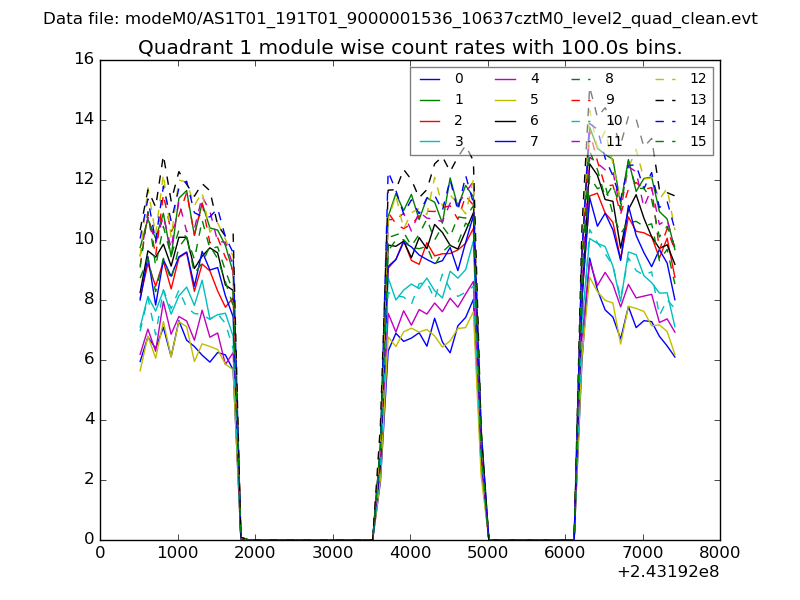 |
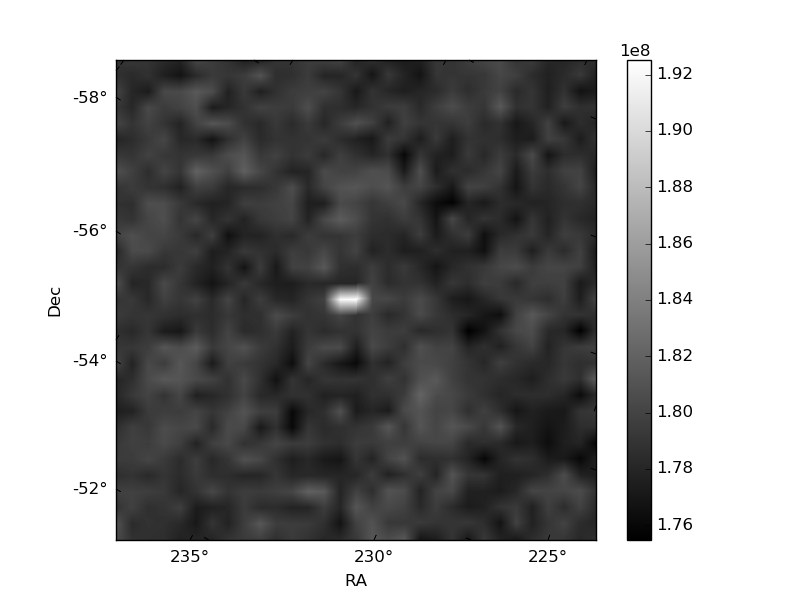 |
| Module-wise count rates for Quadrant C Data is divided into 100 sec bins |
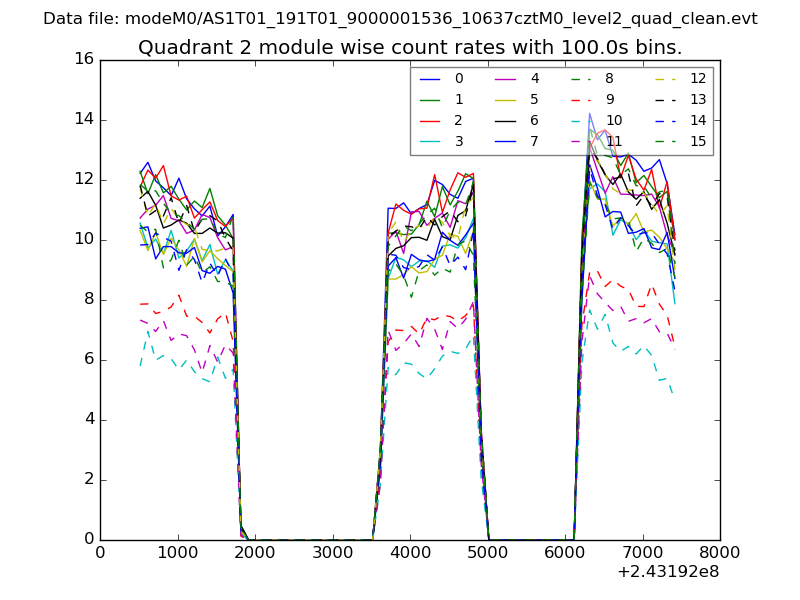 |
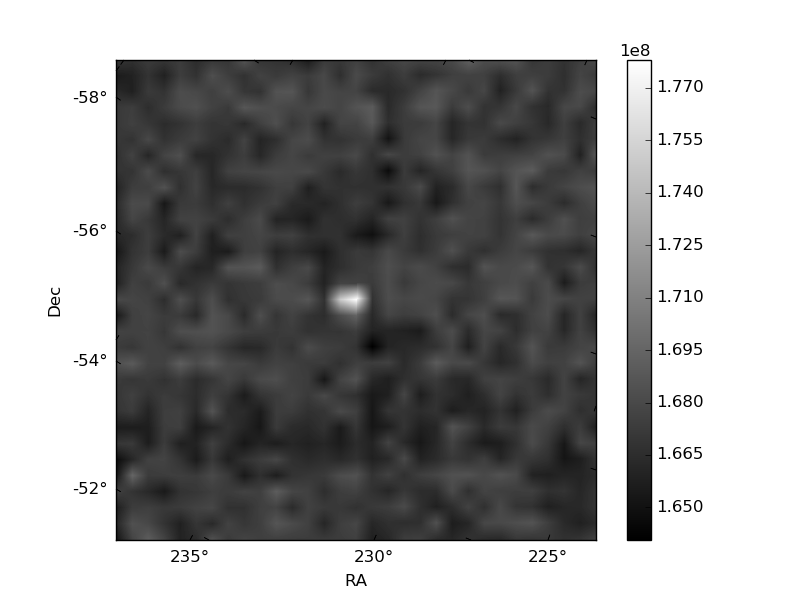 |
| Module-wise count rates for Quadrant D Data is divided into 100 sec bins |
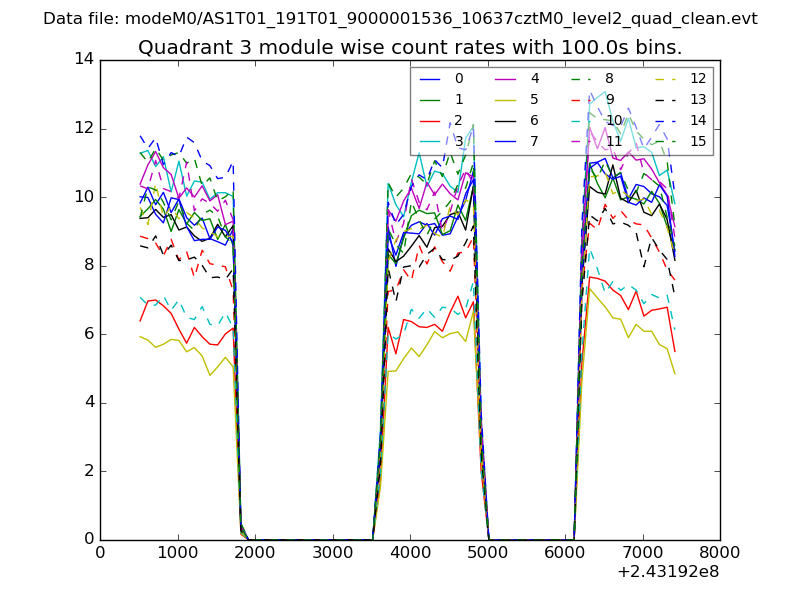 |
 |
| Parameter | Plot |
|---|---|
| CZT HV Monitor | 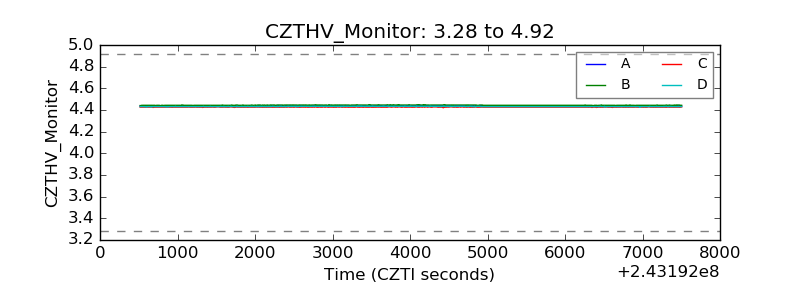 |
| D_VDD | 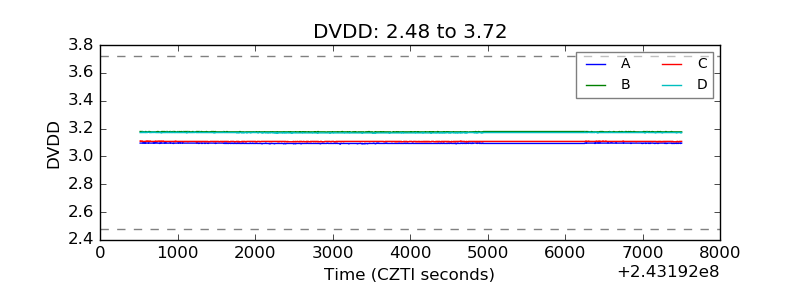 |
| Temperature 1 | 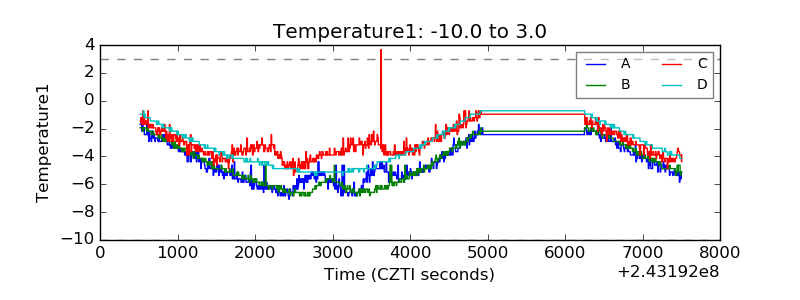 |
| Veto HV Monitor | 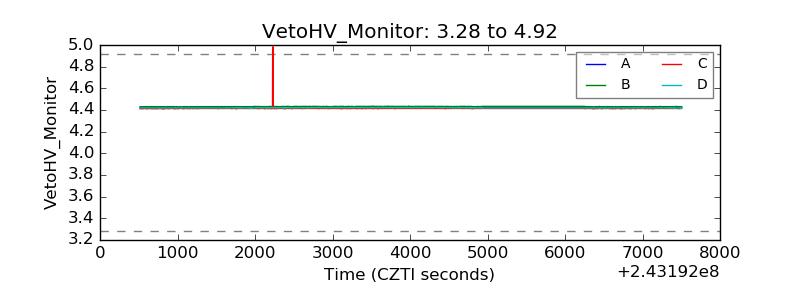 |
| Veto LLD |  |
| Alpha Counter | 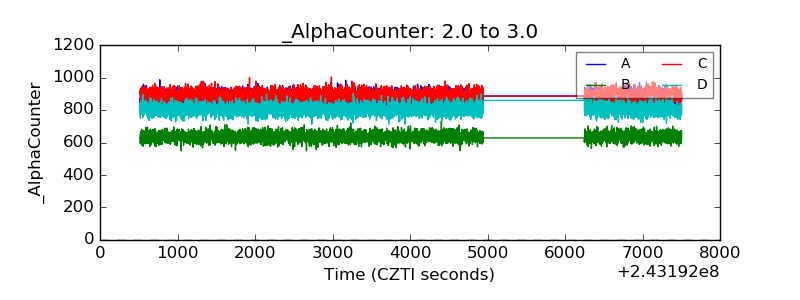 |
| _CPM_Rate |  |
| CZT Counter | 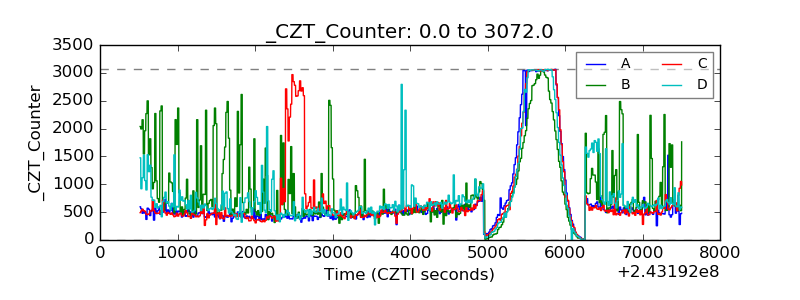 |
| +2.5 Volts monitor |  |
| +5 Volts monitor |  |
| _ROLL_ROT | 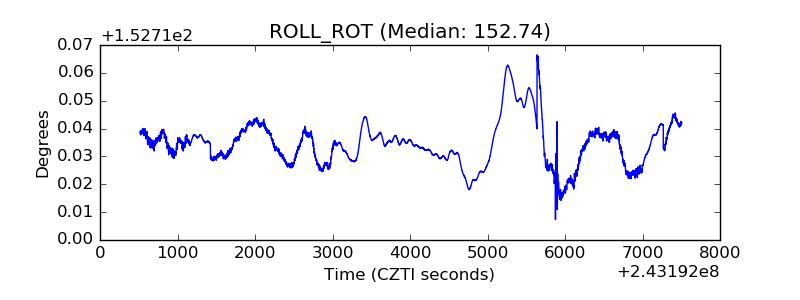 |
| _Roll_DEC | 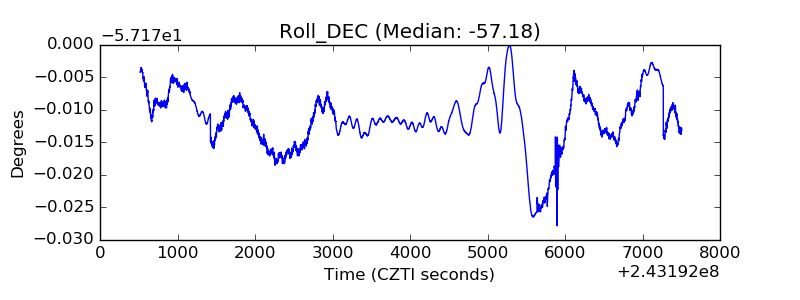 |
| _Roll_RA | 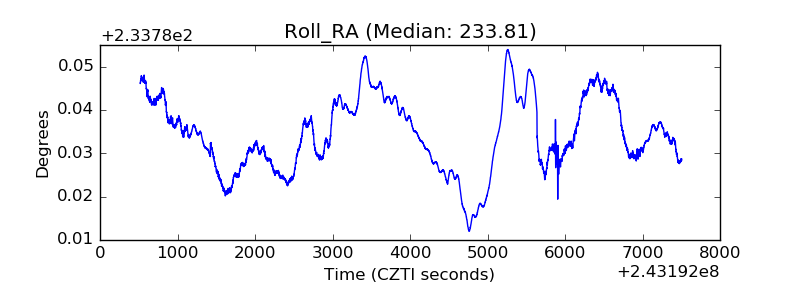 |
| Veto Counter | 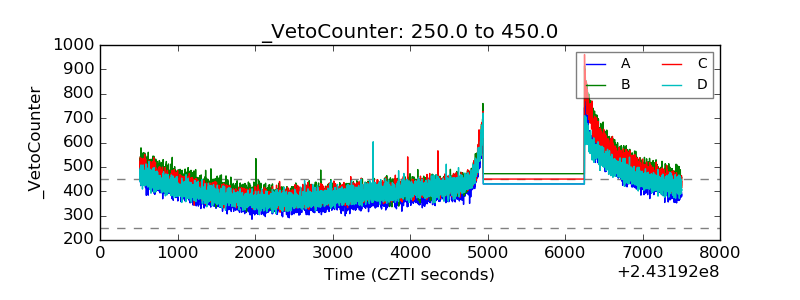 |